Understanding Website Traffic Analytics – A Beginners Guide
Loves Data

Understanding how your business is performing online can be challenging. Analytics is built into just about every platform you use, from the platform you’re using to create your website to Google Ads, Meta Business Insights, and of course, Google Analytics.
Understanding how many people find your business’ website is the first step to unlocking valuable insights to improve your leads, sales, and other online objectives. So what does website traffic mean for a business website, and what should you know about it? Keep reading to find out.
What Is Website Traffic?
Website traffic refers to the number of people who visit your website. It’s a way to measure your website’s popularity. Depending on your marketing channels and website content, you can improve your chances of getting more website traffic.
Traffic can come from a variety of sources. It can occur organically by people finding your site through search engines, social networks, and other free channels. And it can come from paid advertising, including Google Ads, Meta Ads, LinkedIn Ads, and other paid channels.
When you look at the trends for your website’s users and other metrics, you will get a rough idea of how well your website performs. For example, if you’re seeing year-on-year user growth and a steady (or improving) conversion rate, you know that your website is working.
What Website Traffic Terms Should You Know About?
1. Users
Users refer to the total number of people visiting your website.
The standard reports in Google Analytics 4 (GA4) present the number of ‘Active Users’, which is different from ‘Total Users’. For someone to be considered an active user, they need to have spent at least 10 seconds on your website, viewed two or more pages, or converted. If they meet any of these criteria, they are considered engaged and included in the ‘Users’ metric in your reports.
2. New Users
New users are the number of people who came to your website for the first time in the selected date range.
This metric is calculated based on the number of new unique user identifiers. This is commonly the Client ID which is automatically assigned to each new user. If an existing user clears their cookies and returns to your website, a new Client ID will be assigned, and they will again be counted as a new user in your reports.
3. Sessions
Sessions refers to the number of times users visit your website. For example, if a user visits your website on Monday, Tuesday, Wednesday, Thursday, and Friday, you will see five sessions reported for the user.
A session starts when someone visits your website or if they’ve been inactive on your website for over 30 minutes and triggers an event, like navigating to another page.
3. Events
Events collect the information presented in your reports.
Google Analytics will automatically collect a range of events for you. This includes first_visit, session_start, page_view, and user_engagement events. You also have the option to automatically collect additional events using the ‘Enhanced Measurement’ feature. This lets you automatically collect events for important actions, for example, watching embedded YouTube videos, clicking to download files, engaging with form, clicking outbound links, and more. And apart from automatic events, you can implement recommended and custom events using Google Tag Manager or by modifying the Google Tag (gtag.js).
How Can You Analyze Web Traffic?
There are different approaches you can use to analyze your website’s traffic. We will focus on three quick and easy techniques you can use immediately with Google Analytics.
1. Use Automated Insights
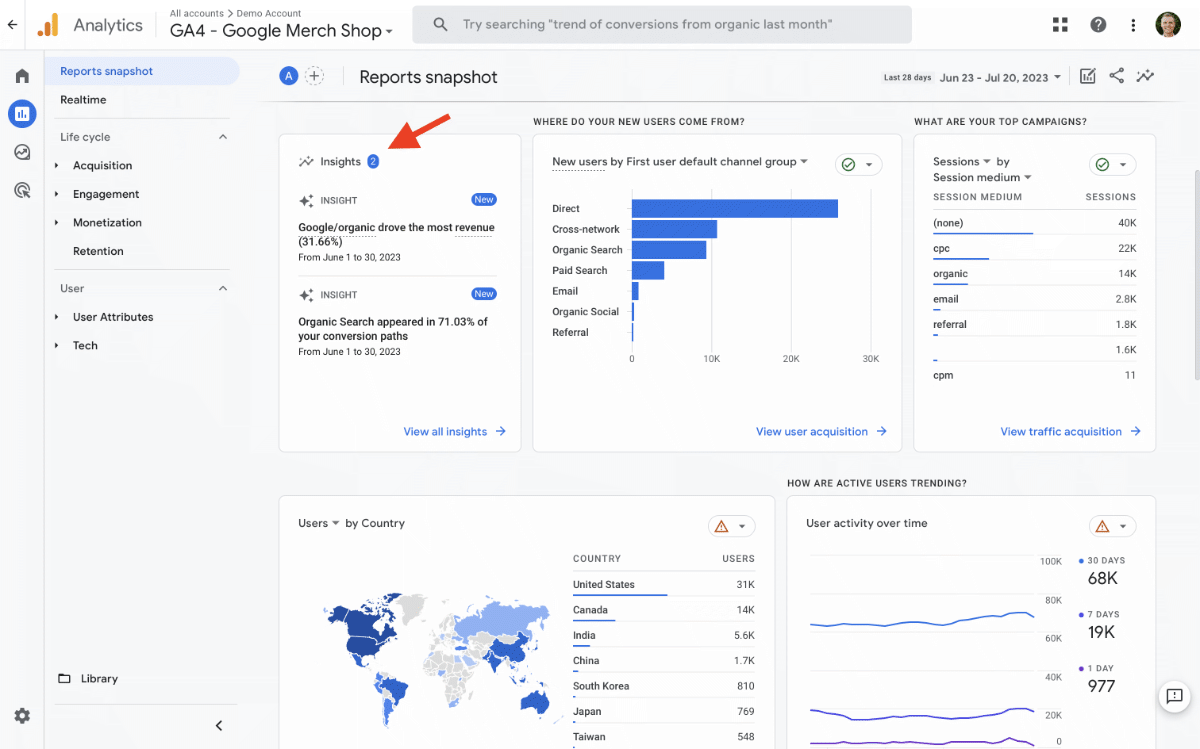
Google Analytics has AI (aka machine learning) built-in. This means any unusual trends, both good and bad, will be automatically highlighted for you. This lets you quickly identify changes that are occurring with your web traffic.

To find the automated insights, navigate to ‘Reports,’ and you will find the ‘Insights’ card in the ‘Reports Snapshot’.
2. Ask Questions
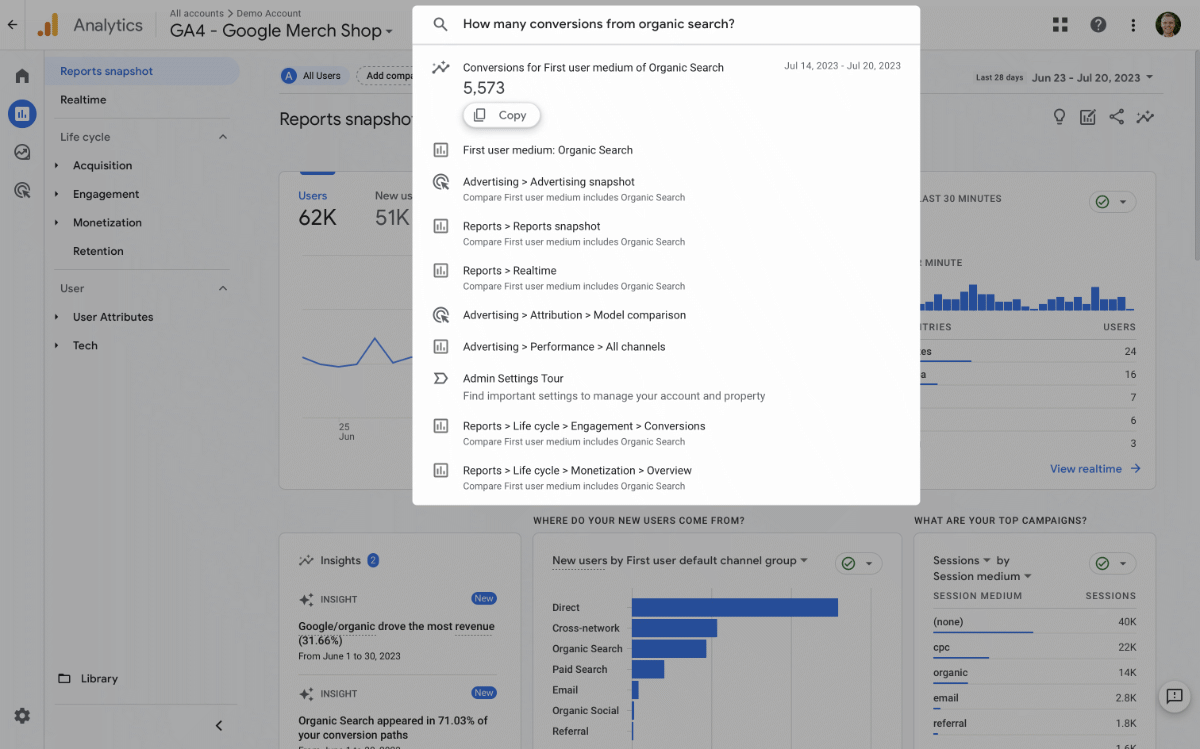
If you know what questions you would like answered about your website’s traffic, simply asking Google Analytics is a great option. At the top of the Google Analytics interface is a handy search feature.

You can type in any questions and see what data is available. You might find it has the answer; if it doesn’t, you can always ask another question.
3. Use Pre-Configured Reports
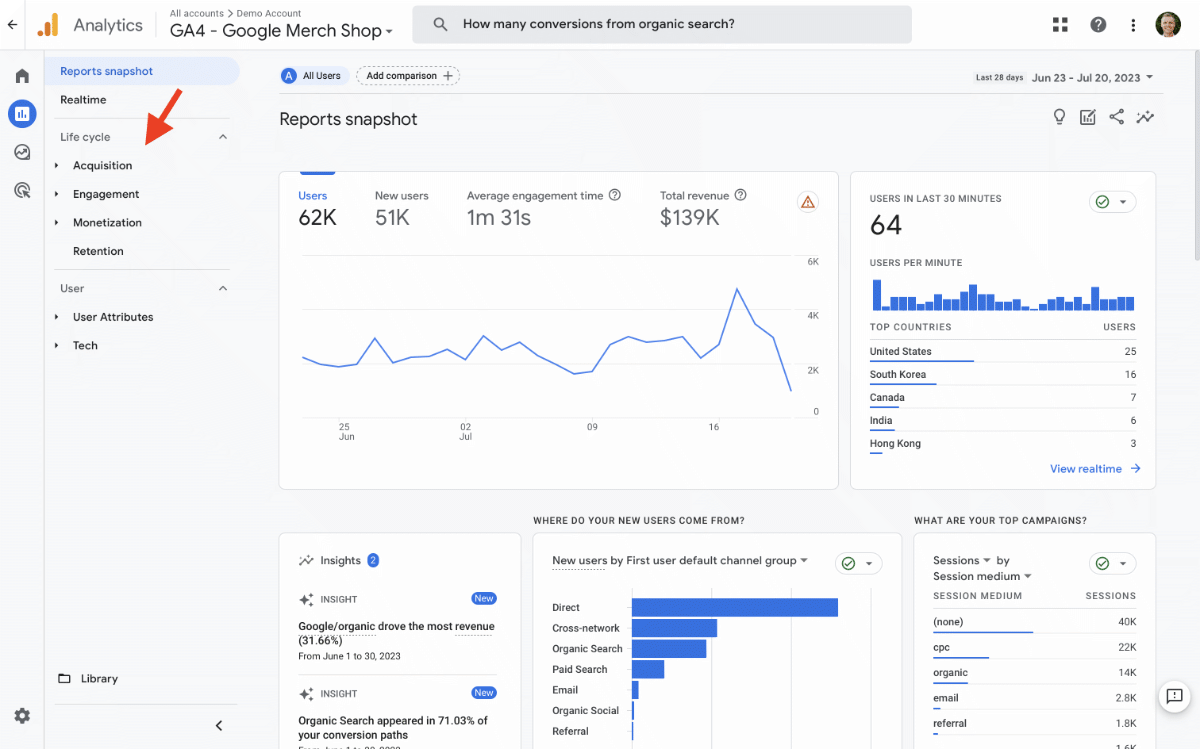
There are also several pre-configured reports available in Google Analytics. These are designed to give you some of the most important information that has been collected about your website and your website’s audience.

Depending on how Google Analytics has been set up (there are many ways to customize reports), you should be able to find reports for who is visiting your website, how they’re finding it, and what they’re doing on your website.
Apart from the pre-configured reports, you can create custom reports in the ‘Explore’ section or even pull data into Looker Studio to create custom dashboards and interactive reports.
Final Thoughts
Understanding the basics of your website’s traffic lets you understand how your business is doing online. You’ll be confident answering questions like – are your total number of users higher or lower than expected? What is the conversion rate for your marketing channels? And is your average purchase revenue going up or down?
By answering these types of questions about your website, you will be in tune with trends impacting your key performance metrics, and you’ll be in a better position to take action if things begin to change. For example, you can tweak your marketing strategy based on data and pinpoint areas where your website can be improved.
You can learn more about your website traffic and the reports available in Google Analytics by joining the Google Analytics 4 (GA4) Course from Loves Data. Completing the course will enhance your skills and help you master Google’s digital analytics platform.


Comments