GA4 (Google Analytics 4) Scroll Tracking
Loves Data
You can automatically track when people scroll pages on your website using the Enhanced Measurement feature in Google Analytics. Scroll tracking is enabled by default when you create a GA4 property, but to double check if it’s enabled or not, navigate to ‘Admin’, select ‘Data Streams’, and open the data stream that’s added to your website. You should see the web stream details, which looks like this:
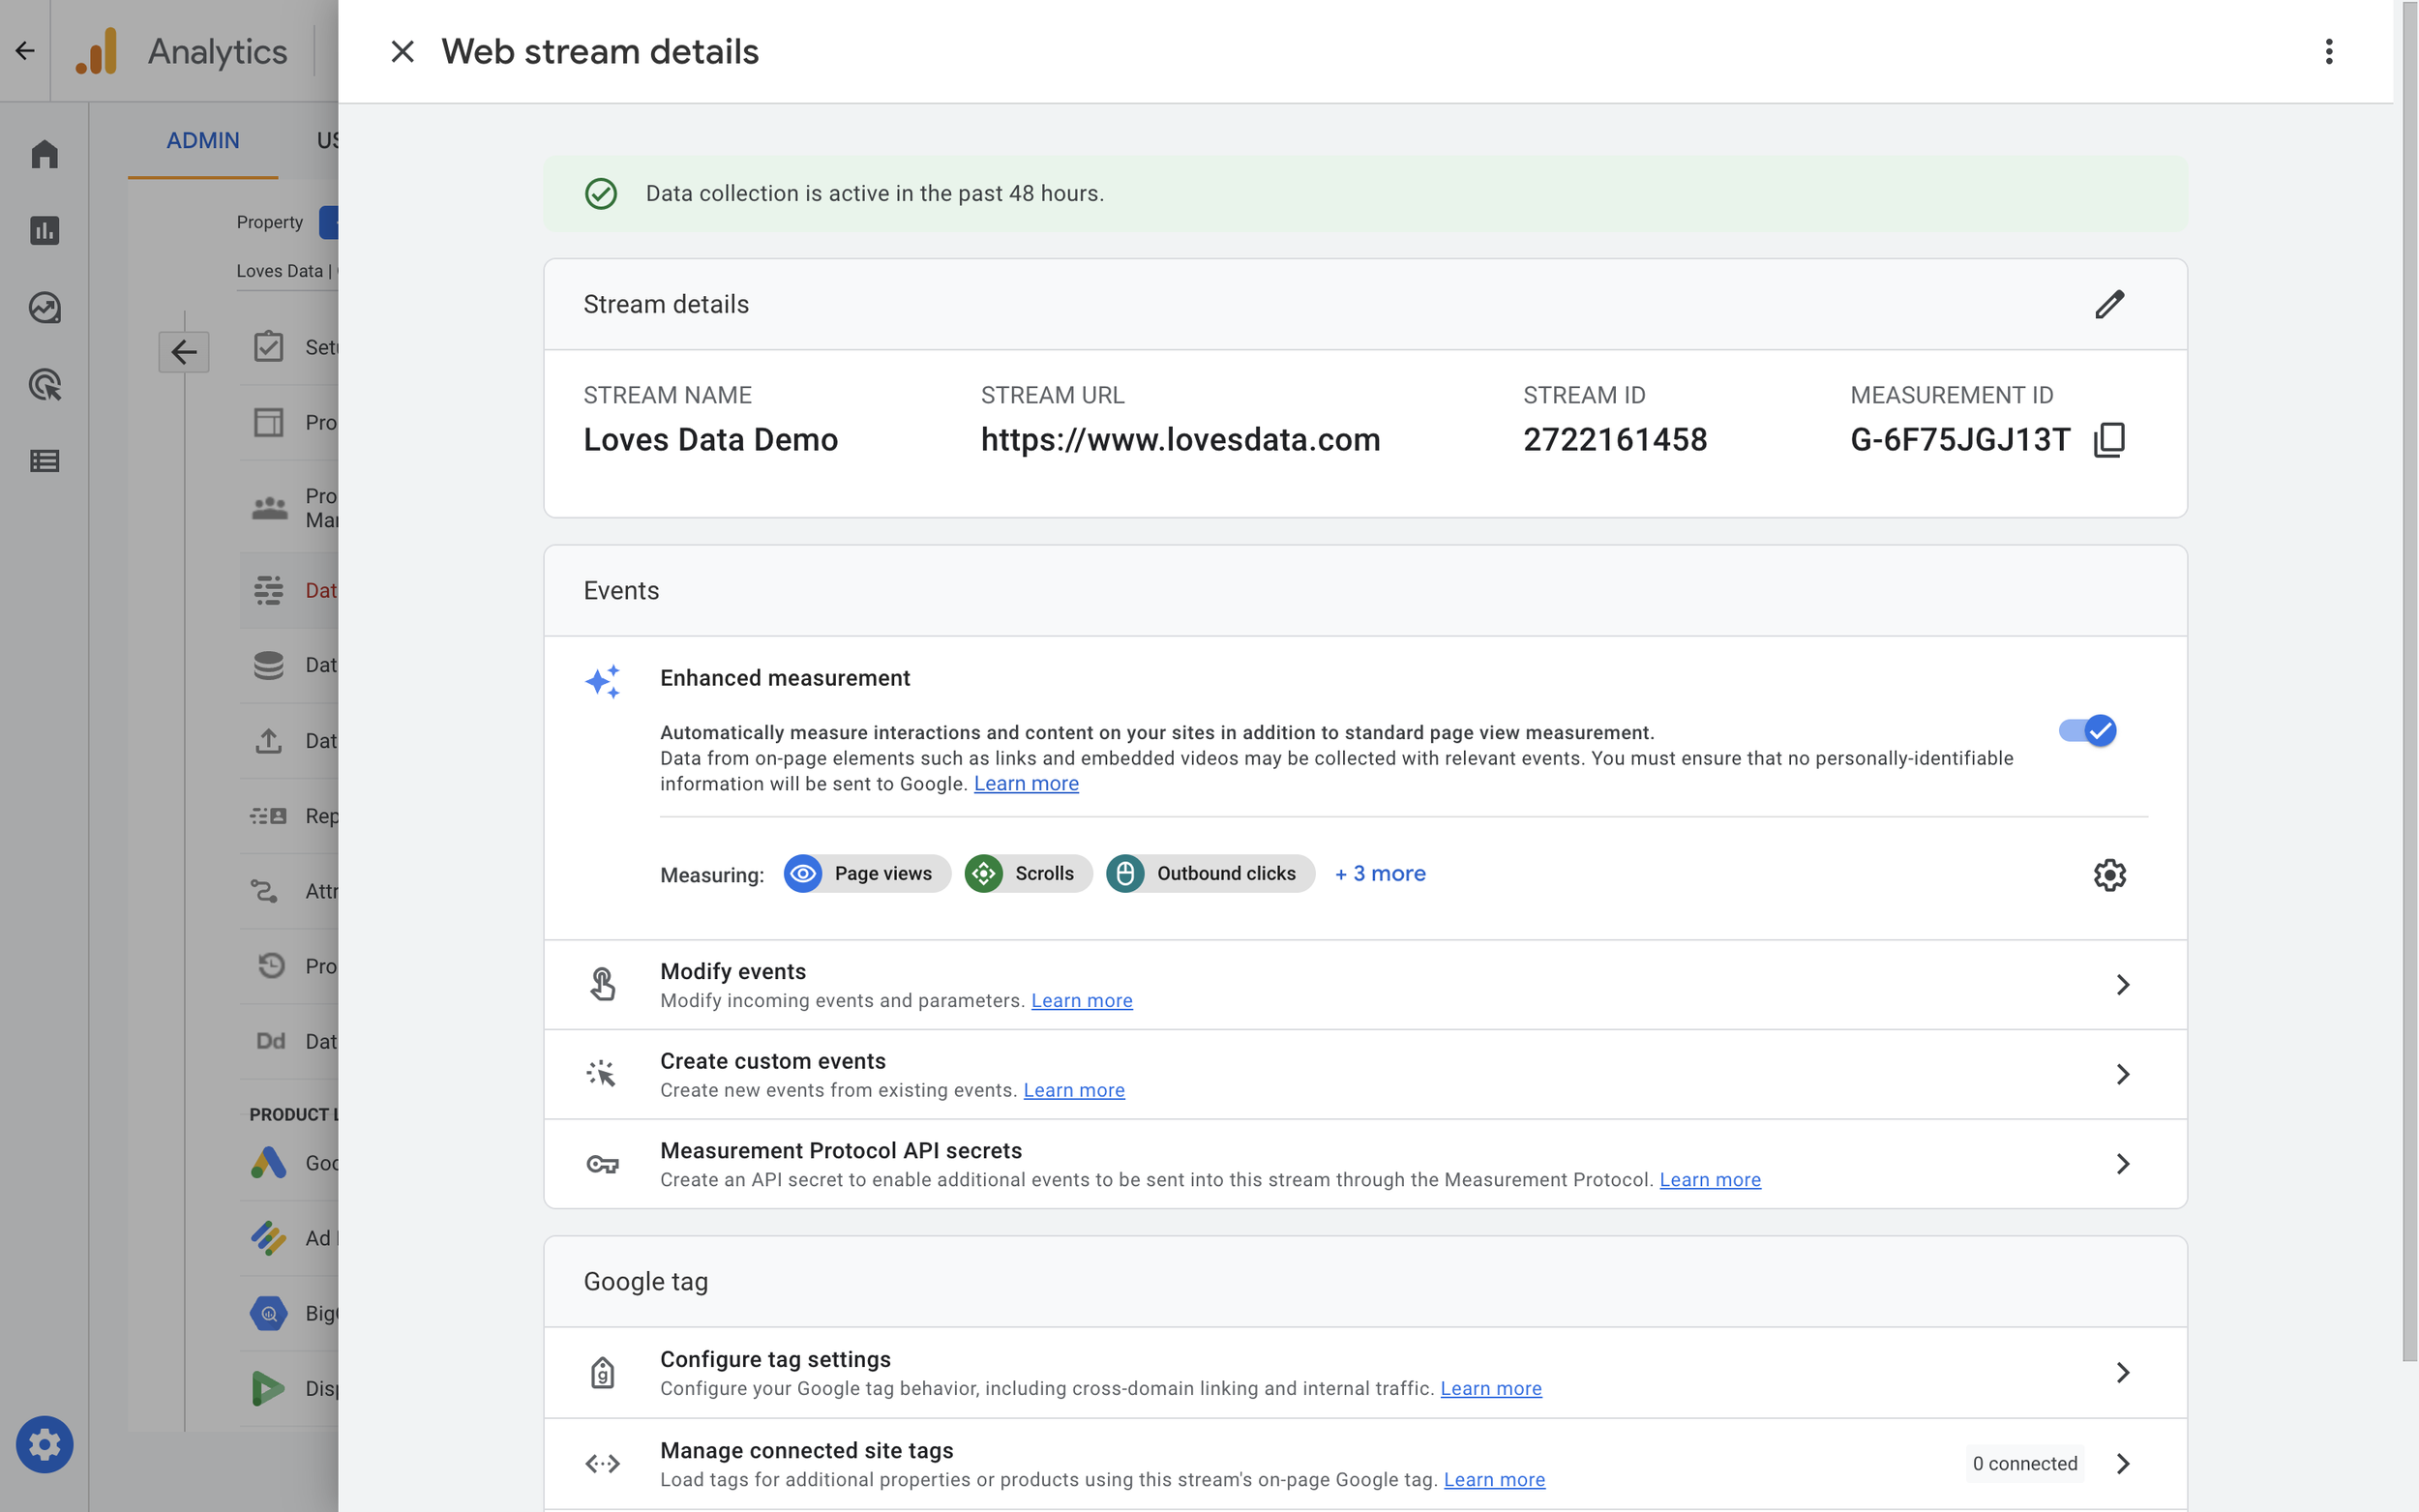
Under ‘Events’, you will find ‘Enhanced Measurement’. You can click the configuration icon on the right to view the events that will be automatically sent to Google Analytics. After clicking the icon, you will see the Enhanced Measurement settings:
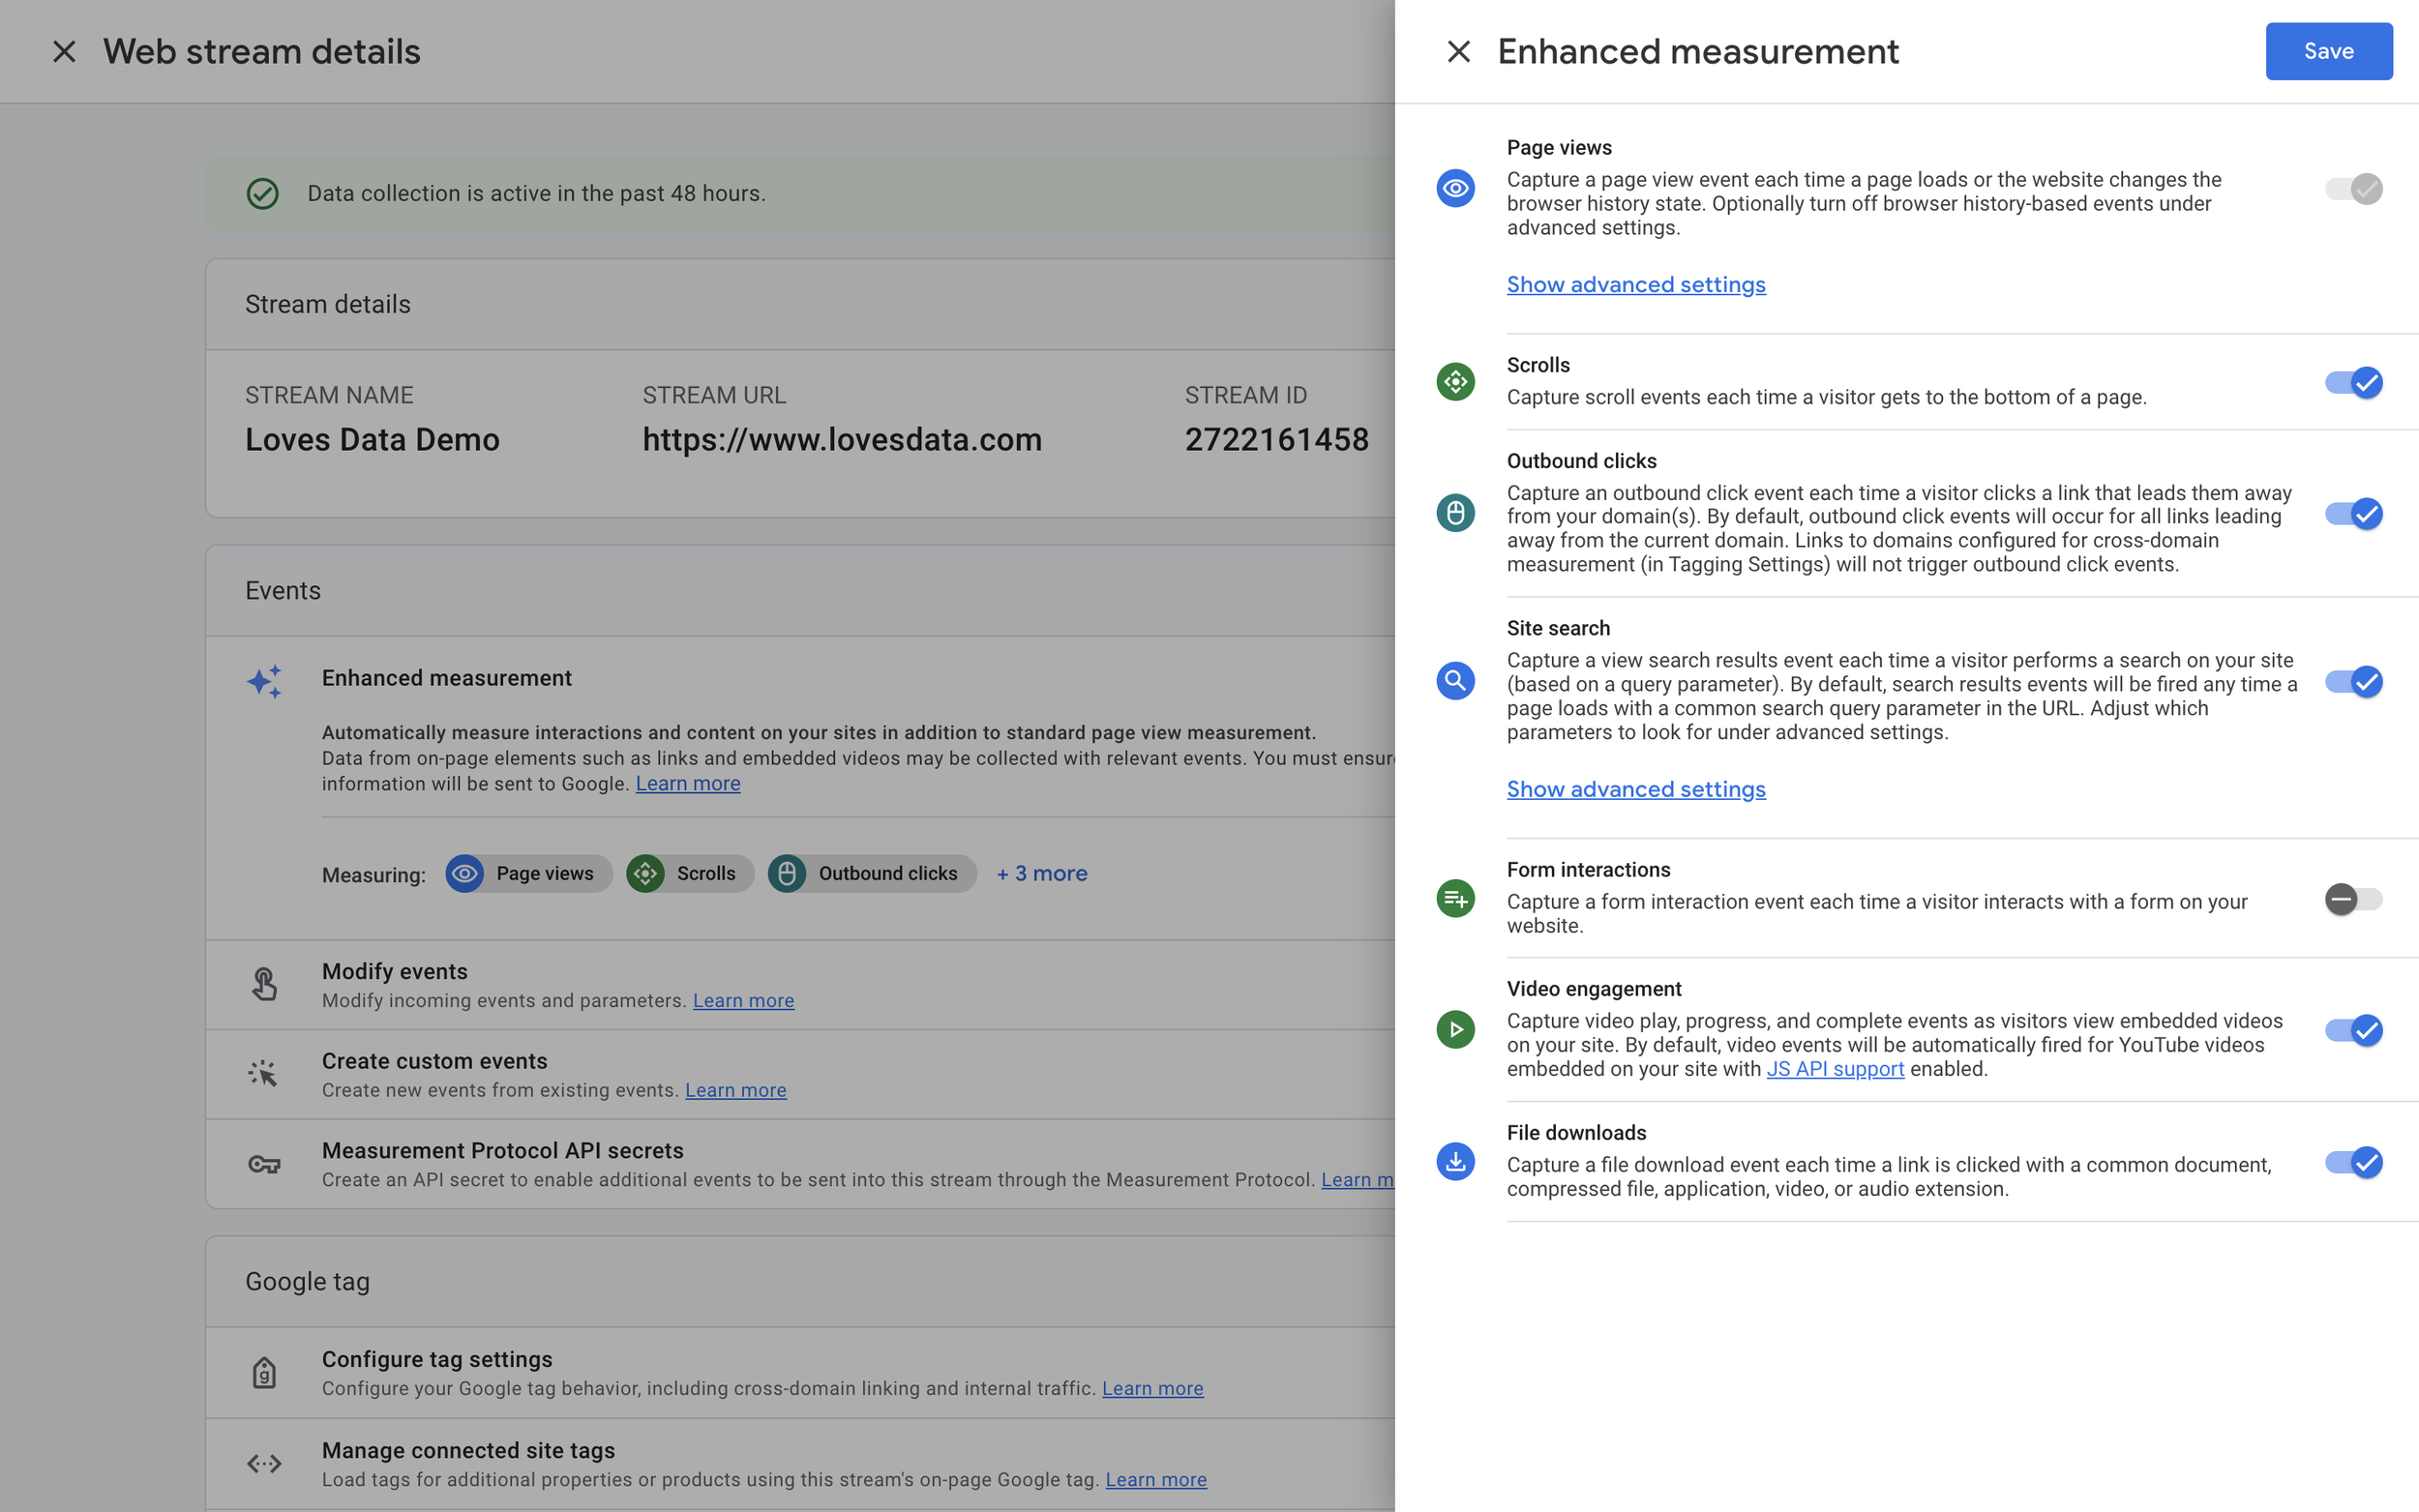
In the above example, we can see that ‘Scrolls’ is enabled (the blue tick on the right). This means we will automatically be tracking people scrolling in this GA4 property.
What does GA4 scroll tracking measure?
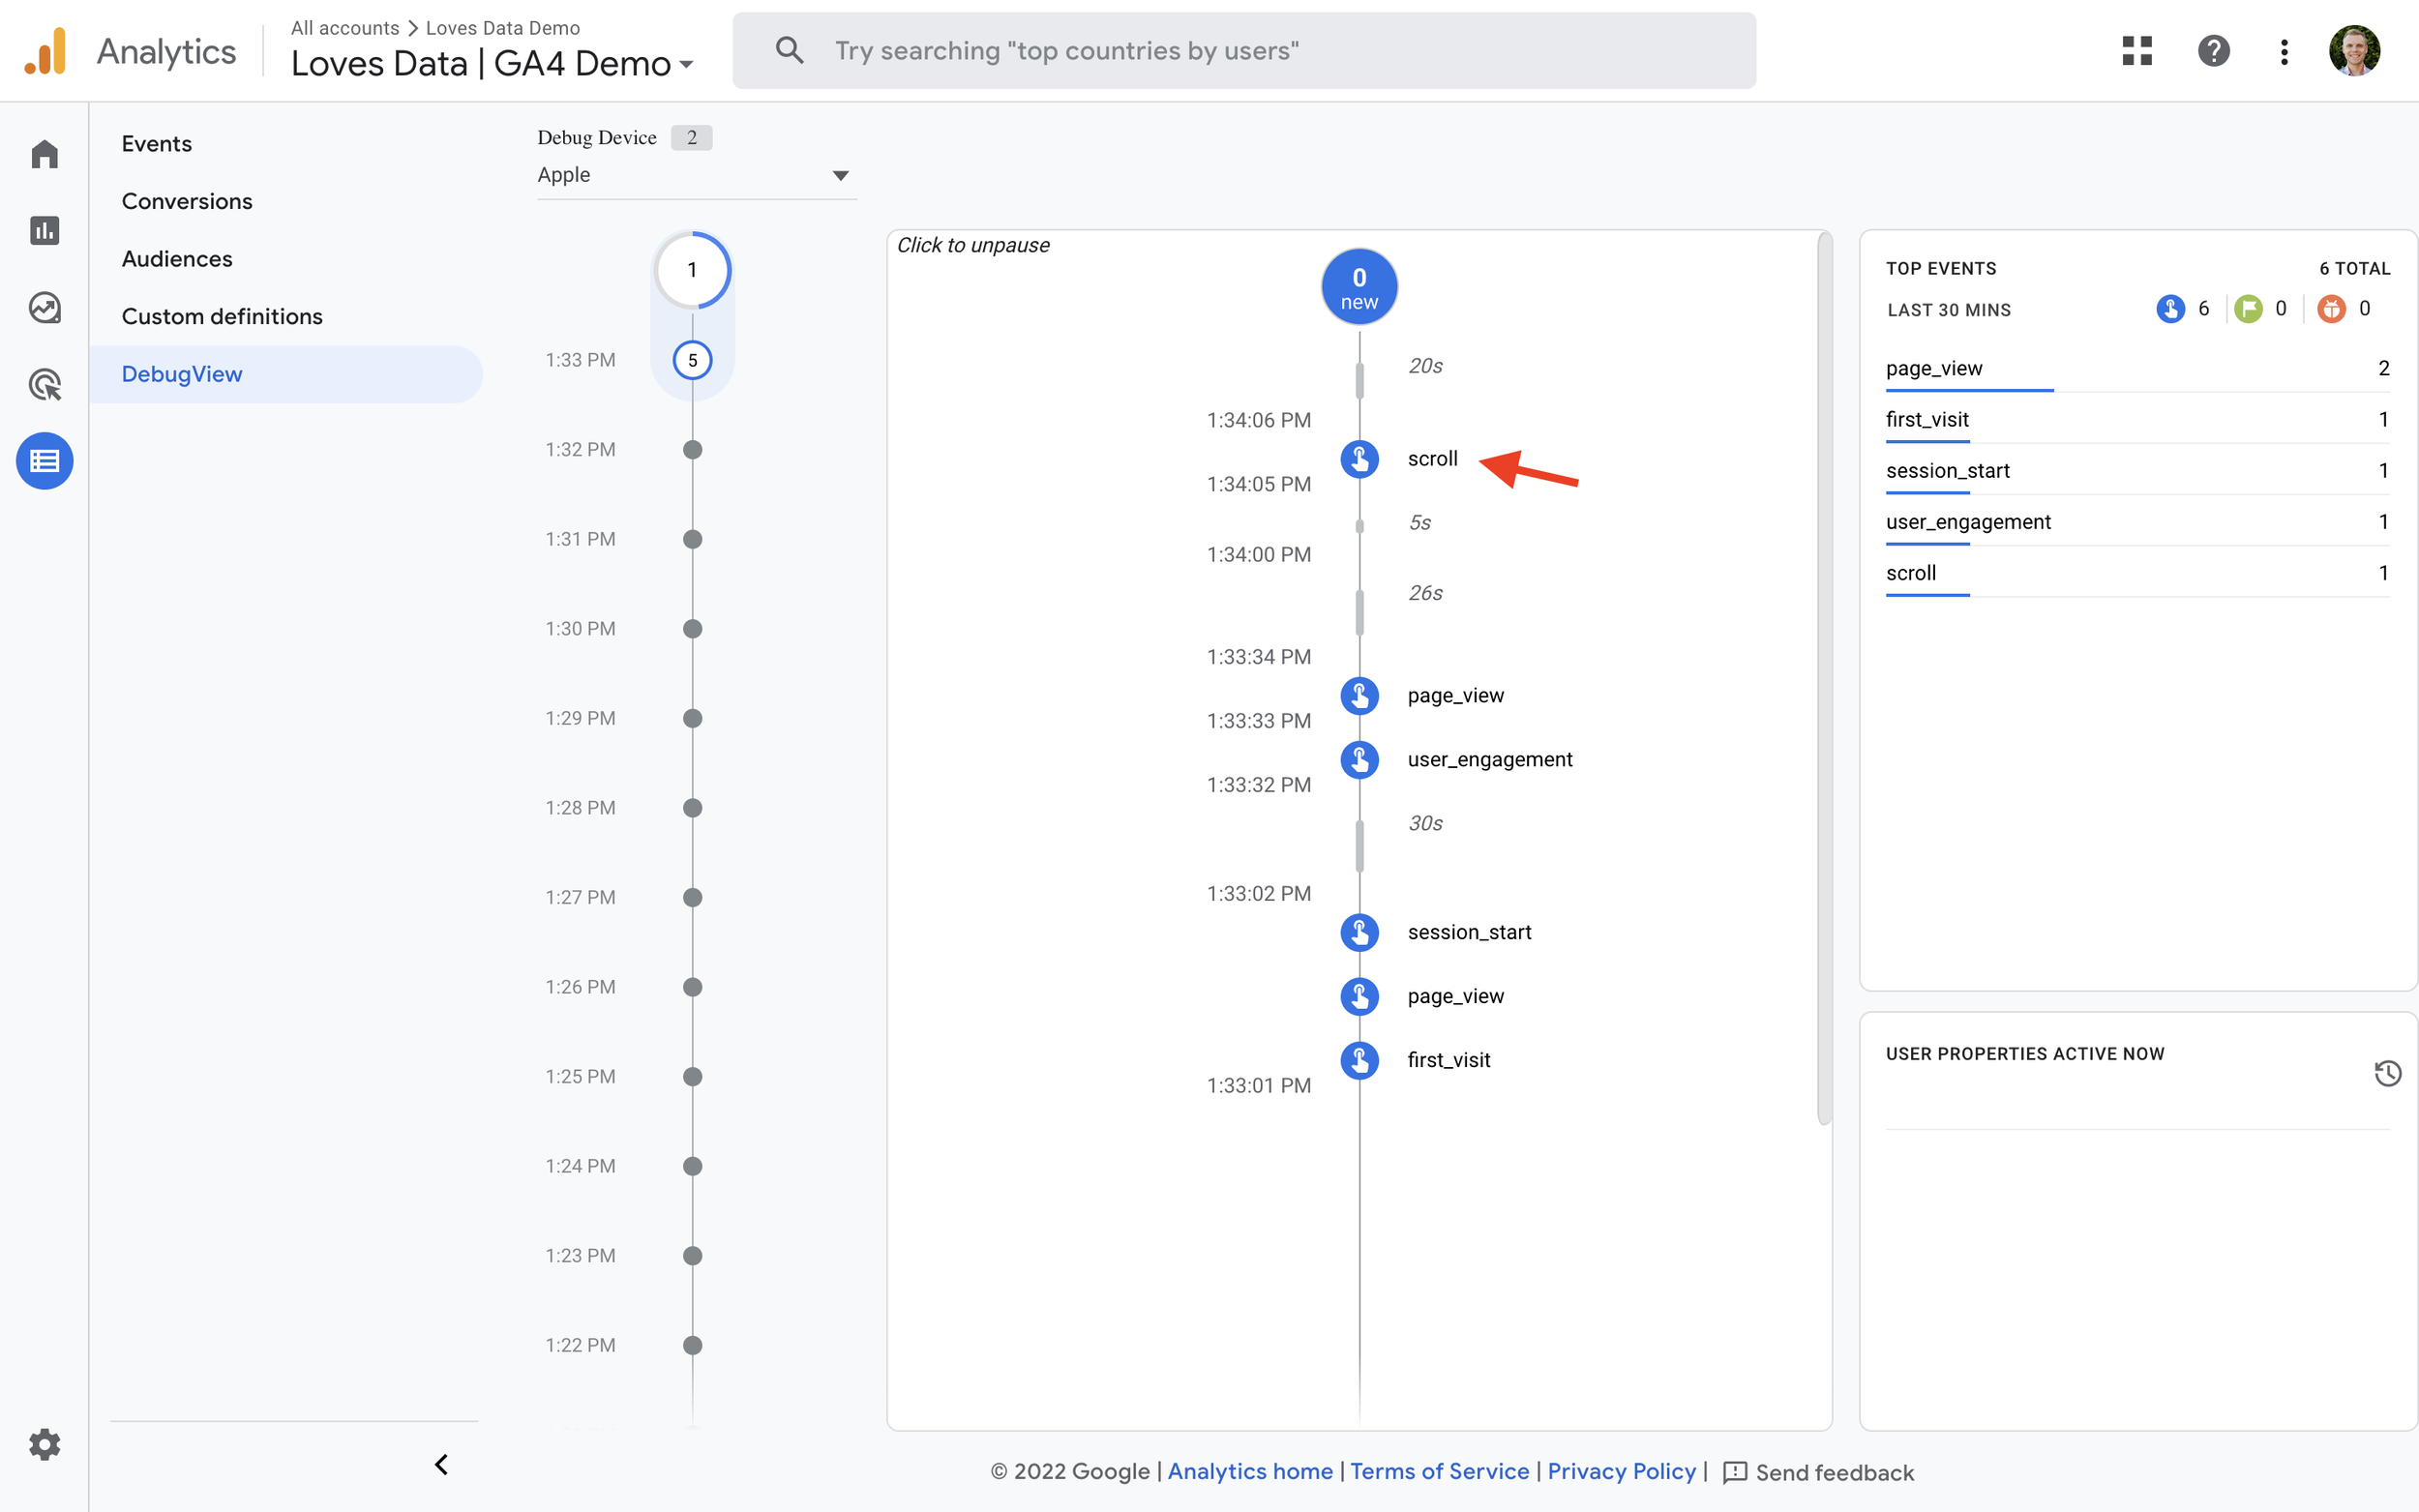
When the Enhanced Measurement feature is enabled, Google Anlaytics will automatically report when people scroll 90% of a page on your website. And you will see an event called scroll in your reports.
Here we can see the scroll event in the GA4 DebugView:
How do you report on scroll depth in GA4?
GA4 includes a default dimension called ‘Percent Scrolled’ and a ‘Unique User Scrolls’ metric. You can use this dimension and metric to report on the number of times people scrolled 90% of a page on your website.
By default, the ‘Unique User Scrolls’ dimension won’t be included in the standard pre-configured reports in GA4, but you can customize the standard reports to include the dimension. Here’s an example of what you would see in a standard report that’s been customized to include the ‘Unique User Scrolls’ metric:
| Page title and screen class | Views | Unique User Scrolls |
|---|---|---|
| Home | 71,760 | 43,382 |
| Men's | 35,915 | 15,940 |
| Sale | 21,361 | 16,013 |
| Apparel | 17,911 | 8,391 |
| New | 12,395 | 7,692 |
You can also create an ‘Exploration’ report that includes the dimension. Currently, the metric is not available, but I’m guessing this will be added. Here’s an example of what you would see if you created a exploration report when one user scrolled one page on your website:
| Page path and screen class | Percent scrolled | Event count |
|---|---|---|
| / | 90 | 1 |
Scroll Tracking With Google Tag Manager
If you would prefer to configure scroll tracking yourself, then the best option is to use Google Tag Manager. You can use this approach if you want to send events to GA4 for different scroll percentages. As we’ve covered, the automatic scroll tracking will only report when people scroll 90% of a page, but what if you want to track people scrolling 50% or 75% of a page? Well, this is where Google Tag Manager comes in – you can configure a GA4 event tag to track custom scroll percentages.
We cover how to track custom scroll depth in our Google Tag Manager Course and we’ve also covered how to setup scroll tracking for Universal Analytics on our YouTube channel. You’ll just need to use a GA4 event tag instead of a Universal Analytics tag.


Comments