How To Report On Landing Pages In Google Analytics 4 (GA4)
Loves Data
If you’ve opened the standard pages report in Google Analytics 4 (GA4), you will be able to see the top pages people have viewed, along with engagement, conversion and revenue metrics. Here’s an example from Google’s demo account:
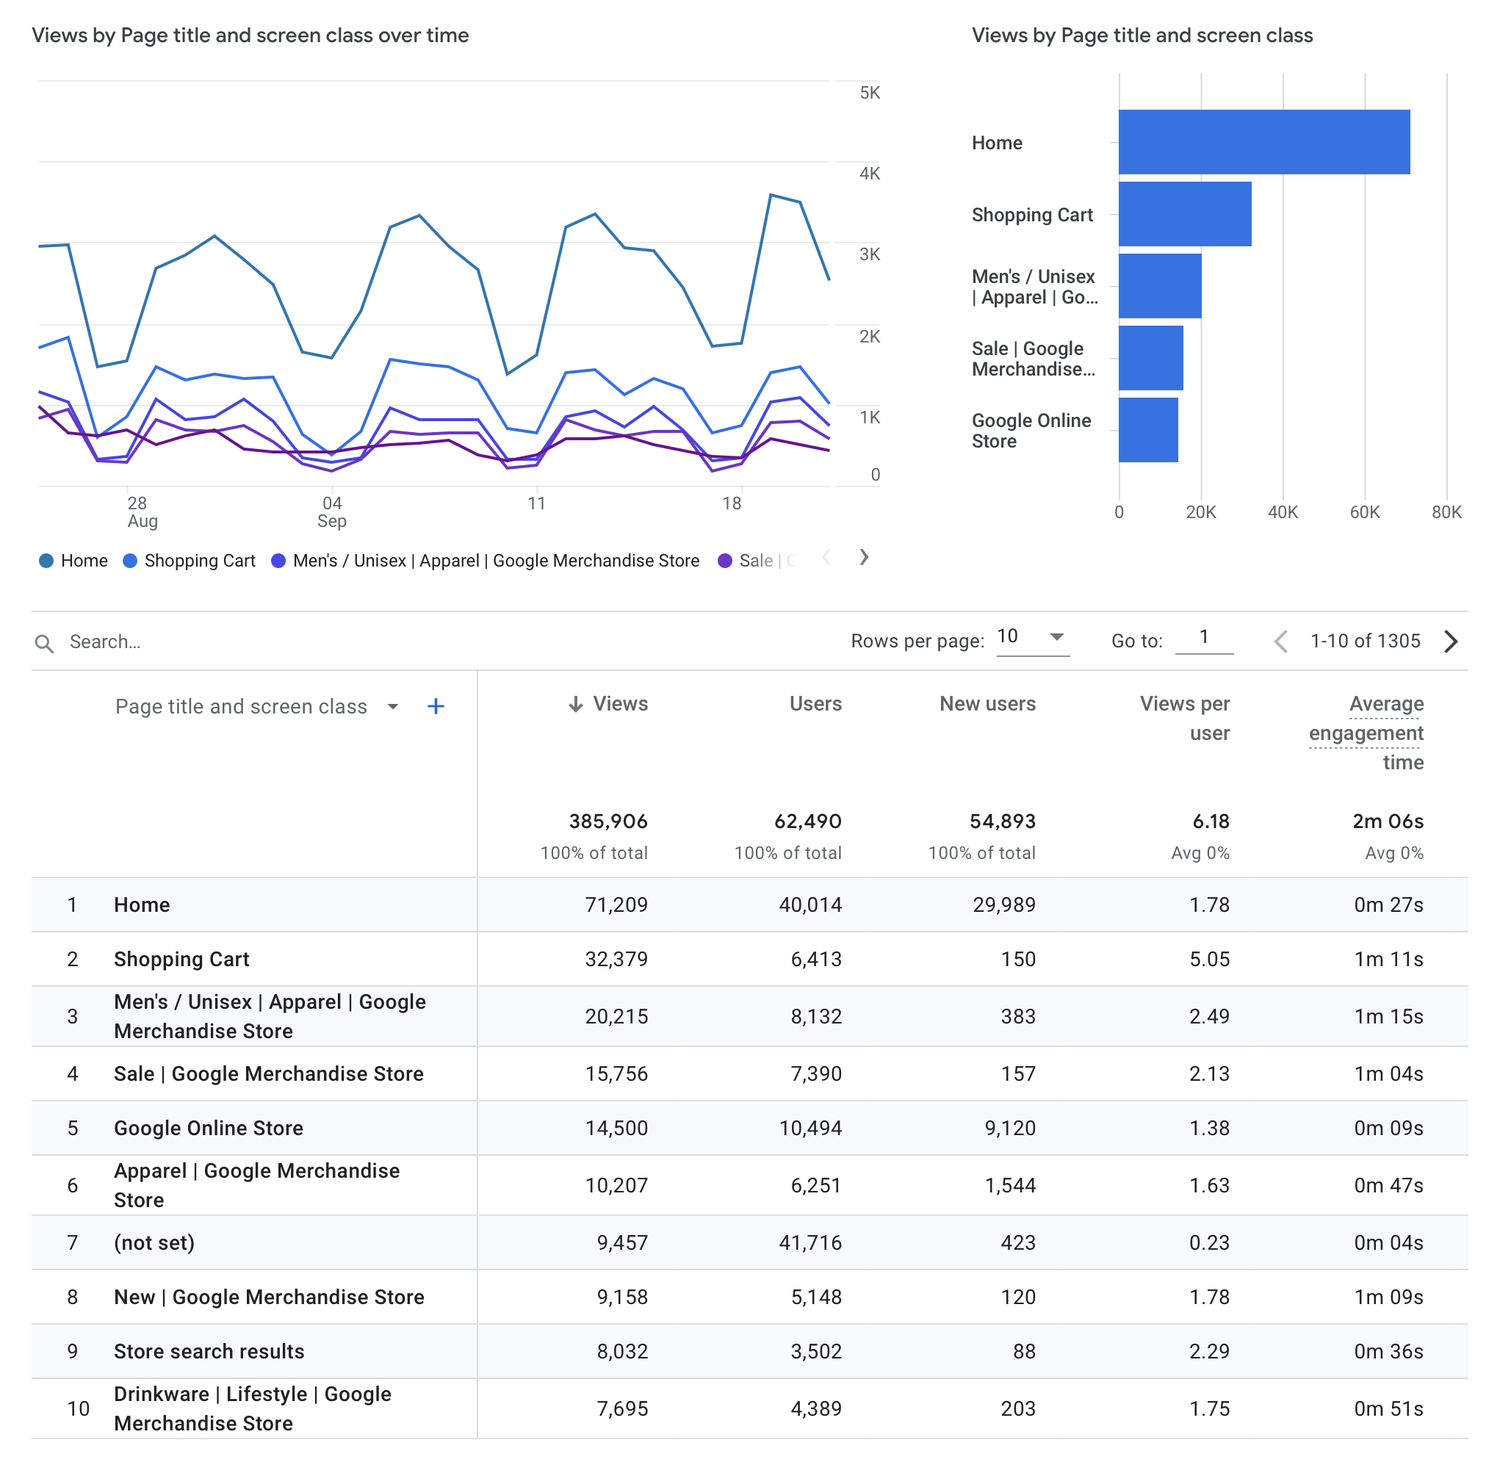
By default, the report presents pages by the number of views each page receives. This isn’t necessarily the same as the number of people landing on each page. So if you want to understand which pages are the first ones people see when they visit your website, you’ll need to either modify the report or create an exploration report.
We’re going to look at both of these options for reporting on landing pages in GA4. Let’s get started!
Standard Report For Landing Pages
We will create a new standard report to show landing pages. However, you can also apply similar steps to modify the default pages report we looked at previously, but we’re going to create a new, dedicated landing page report.
You will need analyst, editor, or administrator permission to modify or create a standard report. If you have viewer permission, then you won’t be able to complete these steps.
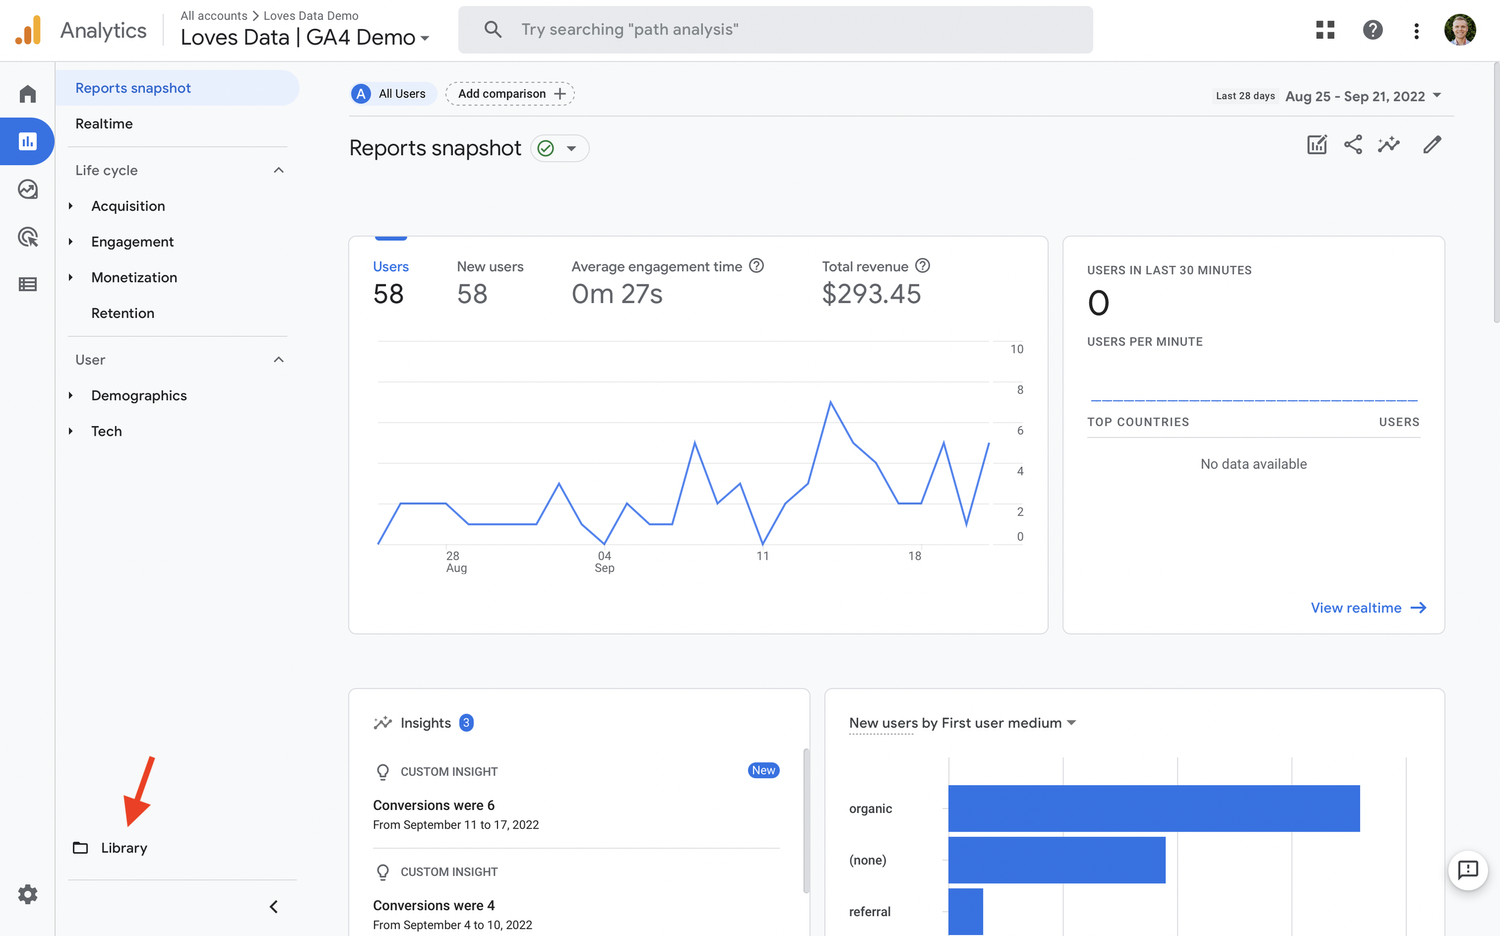
Navigate to ‘Reports’ and select ‘Library’ at the bottom of the reporting menu.
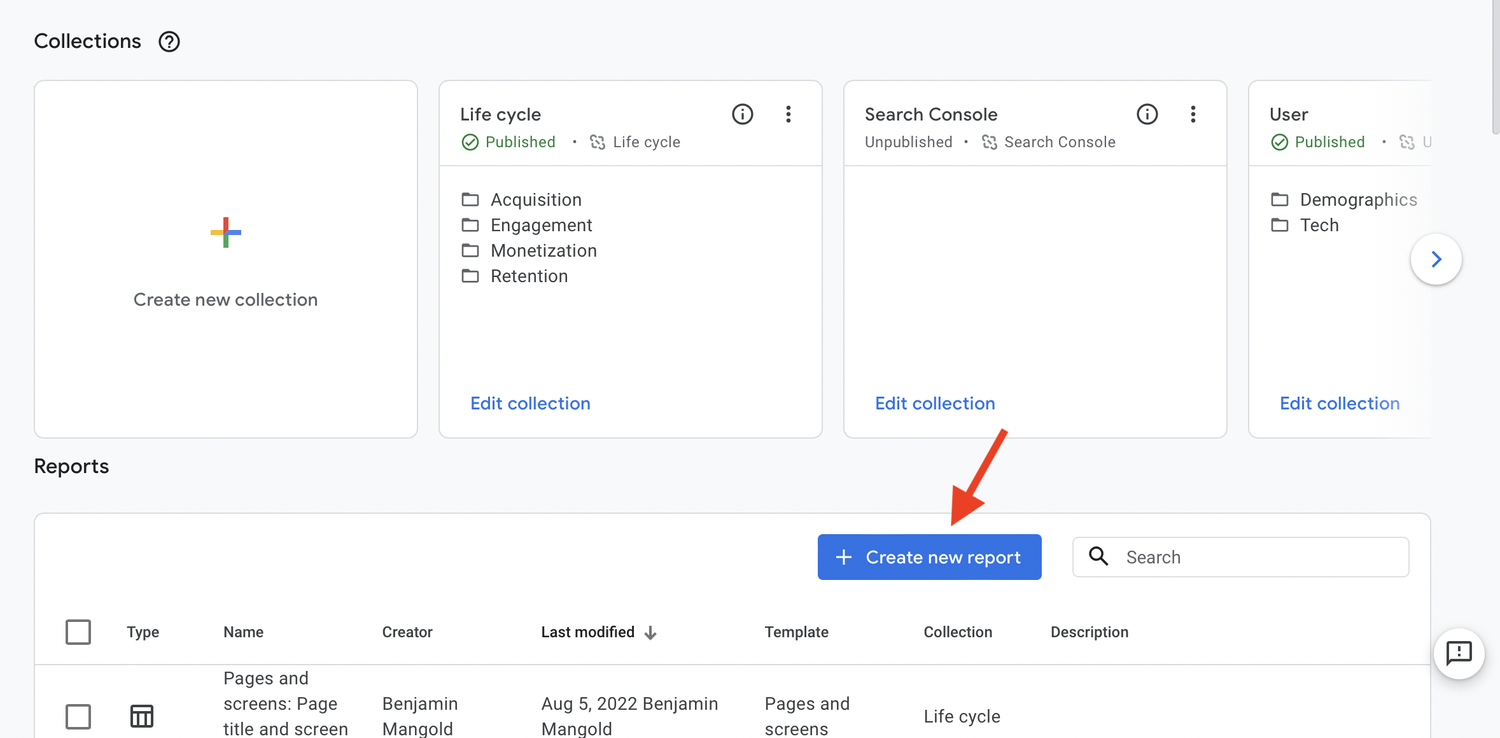
Click ‘Create New Report’, choose ‘Create Detail Report,’ and select the option to create a blank report. And let’s name the report ‘Landing Pages’.
Now it’s time to add the dimensions and metrics to the report. Let’s add the ‘Landing Page’ dimension, along with the metrics of ‘Users’, ‘Engagement Rate’, and ‘Average Engagement Time Per Session’.
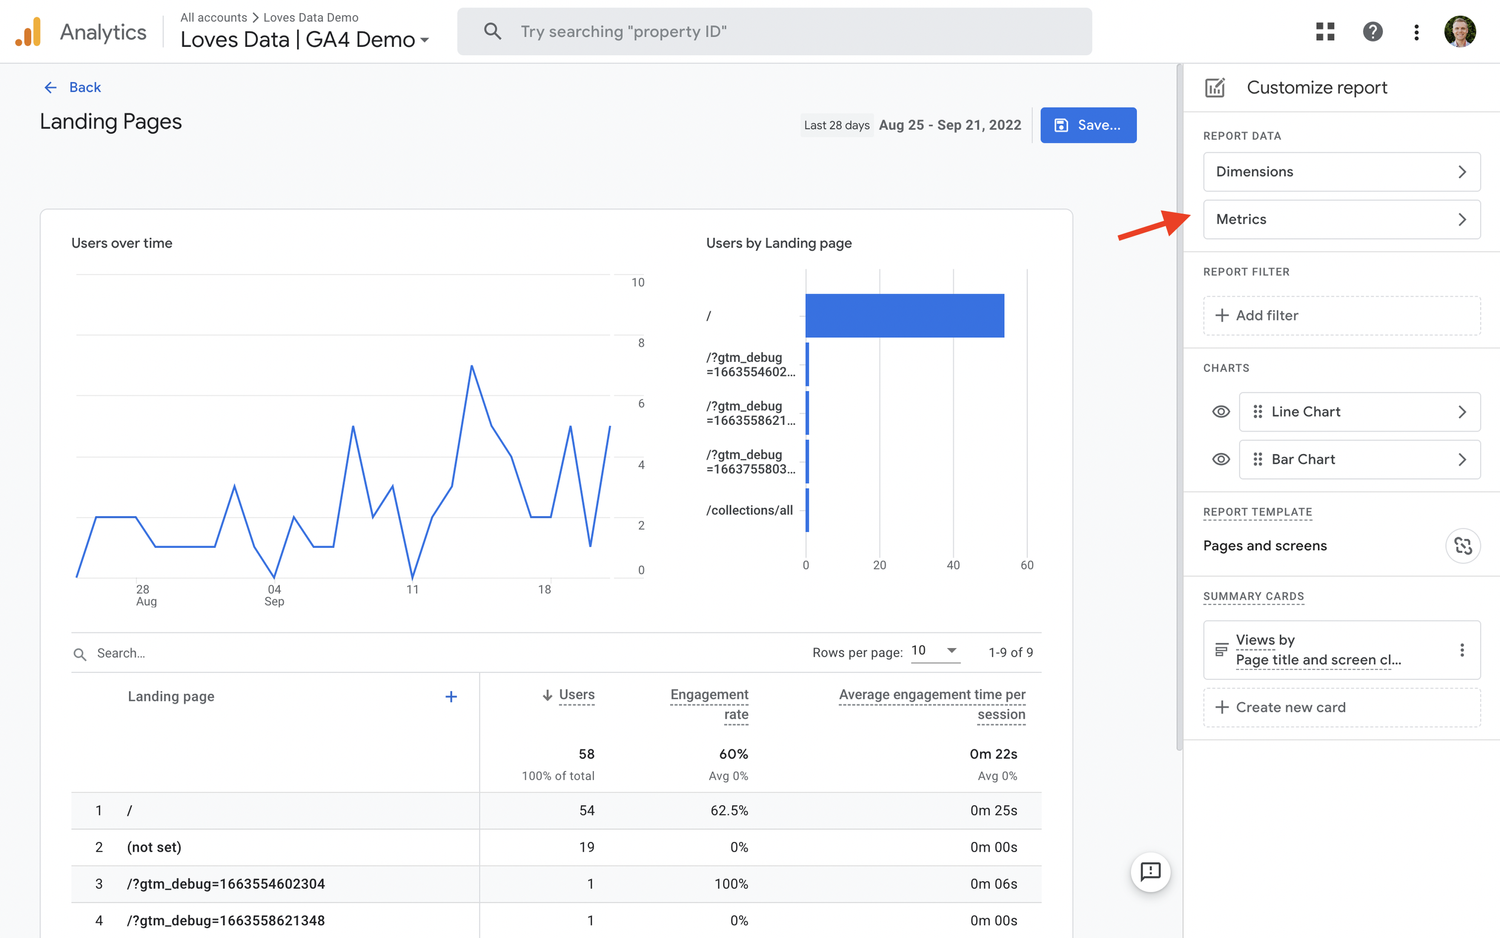
Feel free to add different dimensions and metrics to your report to make it your own. Then, when you’re happy, save the report. You can then add your new report to the menu by editing a collection. You will then be able to report on landing pages in the standard reports.
Exploration Report For Landing Pages
The next option for reporting on your landing pages is to create an exploration report. Let’s take a look at the steps.
First, navigate to ‘Explore’, select the option to create a new blank report, and let’s name the report ‘Landing Pages’.
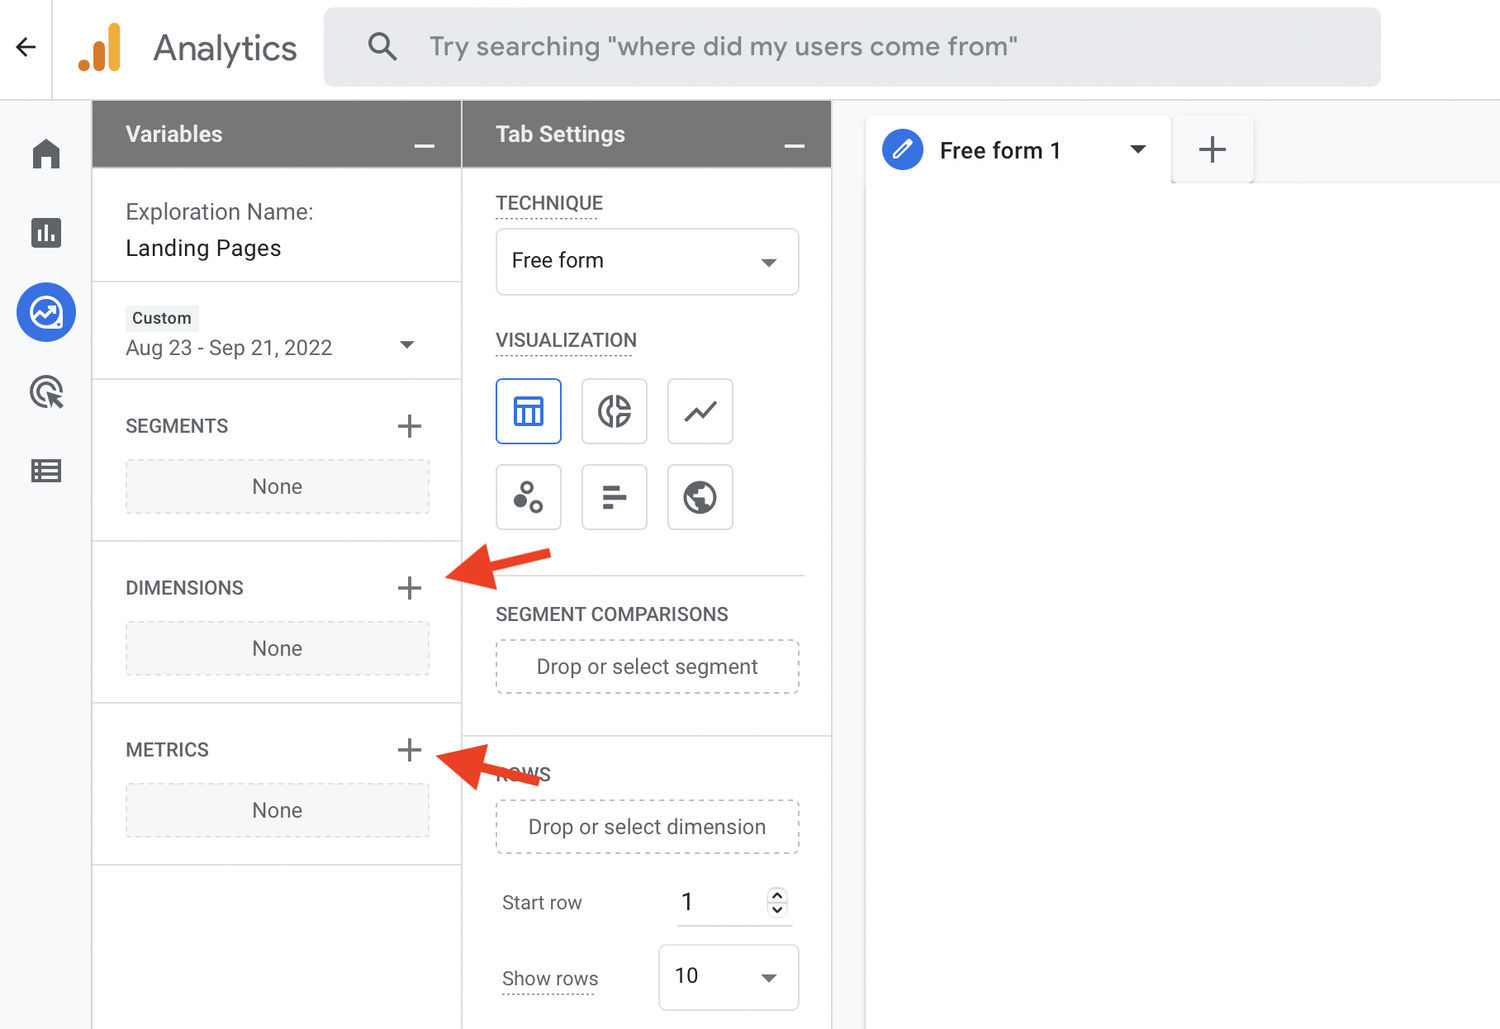
Now we need to enable the dimensions and metrics we want to use in the report. To do this, we need to click the plus sign next to ‘Dimensions’ and then the plus sign next to ‘Metrics’.
For the dimension, you can choose between the following:
- ‘Landing Page’ shows the path along with any query parameters for the first page someone views in a session.
- ‘Page Location’ shows the URL of the pages viewed by users, including the domain, page, and any query parameters.
- ‘Page Path and Query String’ shows the path along with any query parameters.
- ‘Page Path and Screen Class’ shows the path without any query parameters.
- ‘Page Title’ shows the title of the page.
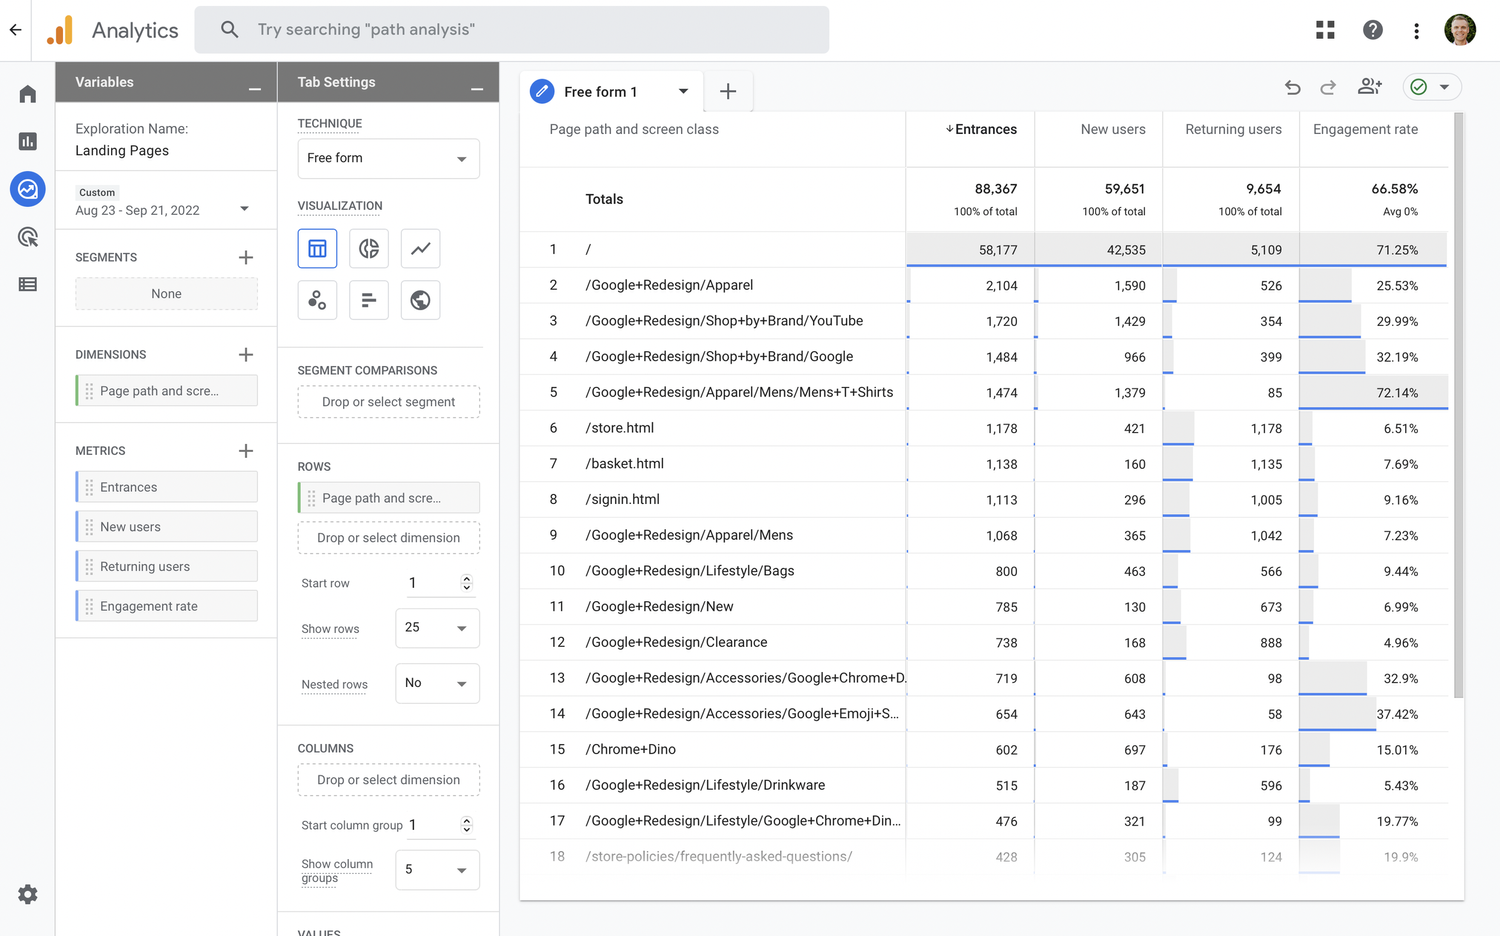
Then for the metric, let’s select ‘Entrances’. This will show you the number of times each page was viewed as the first page in someone’s session on the website.
You can also add any additional metrics you would like to include in your report. For example, you might include ‘Views’, ‘Engagement Rate’, ‘Views Per User’, and any other metrics you would like in the report.
Tip: The Landing Page dimension is useful if you want to combine multiple dimension in the same report or for filtering your exploration report to particular landing pages. However, you can use any of the other page-based dimensions with the ‘Entrances’ metric to report on landing pages.
Then you will need to drag the dimension so it’s presented as a ‘Row’ in the report. And drag the metrics under ‘Values’. You’re landing pages exploration report will now be ready to use!
You can also follow along to create the landing pages exploration report in this tutorial:
The tutorial also includes filtering your exploration report to only view landing pages for particular marketing campaigns.
Conclusion
Understanding where people land on your website will help you identify opportunities to cross-promote your offers and other content. And as we’ve seen, with a few tweaks you can adjust the standard Google Analytics 4 (GA4) reports or create an exploration report to analyze landing pages.
When you’re ready to learn more about GA4, including how to use and customize the reports, then you’re in the right place! Our Google Analytics 4 (GA4) Course will give you the skills to apply the latest version of Google’s digital analytics platform for your business or organization.


Comments