Google Analytics QR Code Tracking – Setup by Step Guide
Benjamin Mangold
QR codes have become an essential tool in bridging the gap between the physical world and our digital channels. They offer a quick way for people to access your online content, whether it's a special offer, a landing page, or a registration form. However, the real power of QR codes lies in your ability to track their performance using Google Analytics. Tracking QR codes can provide insights into user engagement, campaign effectiveness, and more.
Why Track QR Codes?
QR codes direct people to your digital channels, like your website, but without proper tracking, they're just a path with unknown destinations. Tracking QR codes allows you to understand the performance of your marketing strategies, providing insights into:
- Offline Campaign Effectiveness: Understand how offline touchpoints contribute to online traffic and conversions.
- User Engagement: Gain insights into what users do after scanning your QR codes, including the content they interact with and the actions they take on your website.
- Campaign Optimization: Understand which QR codes are being used for the different campaigns being run. You can then focus on what’s working to drive optimization.
Tracking QR codes in Google Analytics lets you understand how people engage once they’ve scanned the code and loaded your website, giving you a clear picture of performance.
How to Track QR Codes with Google Analytics
Before you get started, you will need to ensure that Google Analytics is installed on your website. I’m assuming you’ve already done this, but if you happen to be starting from scratch, I recommend watching my Google Analytics tutorial and joining my Google Analytics course.
Okay, so what do we need to do to track QR codes in Google Analytics?!?
1. Choose your Landing Page
The first step is to choose the page you are sending people to on your website. This is the landing page they will view after they’ve scanned your QR code.
For example, you might be creating a QR code to include in a printed brochure or on a poster. Let’s say my QR code is going to send people to the courses page on my website. The first step is to get this URL. For my example, this will be https://www.lovesdata.com/courses.
2. Add UTM Parameters for Google Analytics
Now that we have the landing page we are going to be sending people to from our QR code, the next step is to add UTM parameters (also called ‘Campaign Tags’) to our URL.
UTM parameters are extra pieces of information (query parameters) that are added to the end of a URL. Once someone opens the URL with UTM parameters, the value of those parameters (or tags) are tracked into Google Analytics. We can then surface these pieces of information in our reports.
At a minimum, you should use campaign tags to understand the source, medium, and overarching campaign for each of your QR codes. To track these pieces of information, we will use the following tags:
- utm_source identifies where someone sees your message.
- utm_medium tells you how the message was communicated.
- utm_campaign is used to understand the name of the campaign or promotion.
Since you can name the source, medium and campaign anything you like, there are different approaches you can use when tracking QR codes into Google Analytics. It really comes down to what you want to see in your reports. Here are the top two approaches you can use:
Option One: Focus on the QR Code
This option is where you focus on the QR code, so your reports will tell you who created the QR code and that people are using the QR code to find your website.
- For this option, you will set the utm_source as either your own company name (since you created the QR code that people are scanning) or as the name of the QR generator used to create the code. This allows you to identifies where someone sees your message (for example, if you’re using Bitly to create the QR code, you could use ‘bitly’ as the source).
- You would then set the utm_medium as ‘qr+code’ or something similar, so that you will be able to see that people scanned the QR code to access your website.
- The utm_campaign tag would then be set as the overarching name of the campaign or promotion you’re running.
Using this naming method is the simplest and easiest option when it comes to reporting. So if you’re not sure the best way to track your QR codes, we recommend starting with this option. Continuing our example, if we wanted so send people to https://www.lovesdata.com/courses then our tagged URL would look something like this:
https://www.lovesdata.com/courses?utm_source=loves+data&utm_medium=qr+code&utm_campaign=qr+code+post
Option Two: Focus on where the QR Code is Displayed
Instead of specifically reporting on the QR code, this option focuses on where the QR is printed or displayed. It means your reports will be more about the marketing initiative.
- You would set the utm_source based on where the QR code is being displayed. For example, if the QR code was included in an ad printed in a newspaper, you would set the source to something like ‘newspaper’ or even the name of the newspaper. Or if you were printing the QR code in a brochure or pamphlet, you would set the source as ‘brochure’ or publication.
- The utm_medium would then be set based on how the message was being communicated. If we were continuing the newspaper or brochure example, then we would likely set the medium as ‘offline’.
- And like the first option we looked at, the utm_campaign tag would also be set as the overarching name of the campaign or promotion.
Apart from these options, you can also use the utm_source_platform and utm_creative_format tags to track people using QR codes into Google Analytics. For example, you could combine the options we’ve looked at to create a hybrid that looks something like this:
- utm_source=my+company
- utm_medium=offline
- utm_campaign=my+campaign
- utm_source_platform=bitly
- utm_creative_format=qr+code
Continuing the example using our courses page, this would give you a URL like this:
https://www.lovesdata.com/courses?utm_source=loves+data&utm_medium=offline&utm_campaign=qr+code+post&utm_source_platform=bitly&utm_creative_format=qr+code
There are also additional campaign tags you could use if you feel they are relevant and will provide additional insights in your reports. These are the utm_content, utm_term, utm_marketing_tactic, and utm_id tags. The most important one to mention is the utm_id tag, as you would need to use this if you want to upload advertising cost data to Google Analytics. Otherwise, these are all optional.
There’s no one-size-fits-all when it comes to using campaign tags, so consider what you want to see in your reports and what will be the easiest for you to interpret when you jump into Google Analytics. We cover best practices and more examples of campaign tags in our Google Analytics course if you would like to explore more options.
3. Create Your QR Code
The next step is to create our QR code using the campaign tagged URL we created in the previous step. There are a whole range of ways you can create QR codes, so I suggest using your preferred method.
However, if you’re looking for suggestions, here are some free and freemium QR code generators you can consider using:
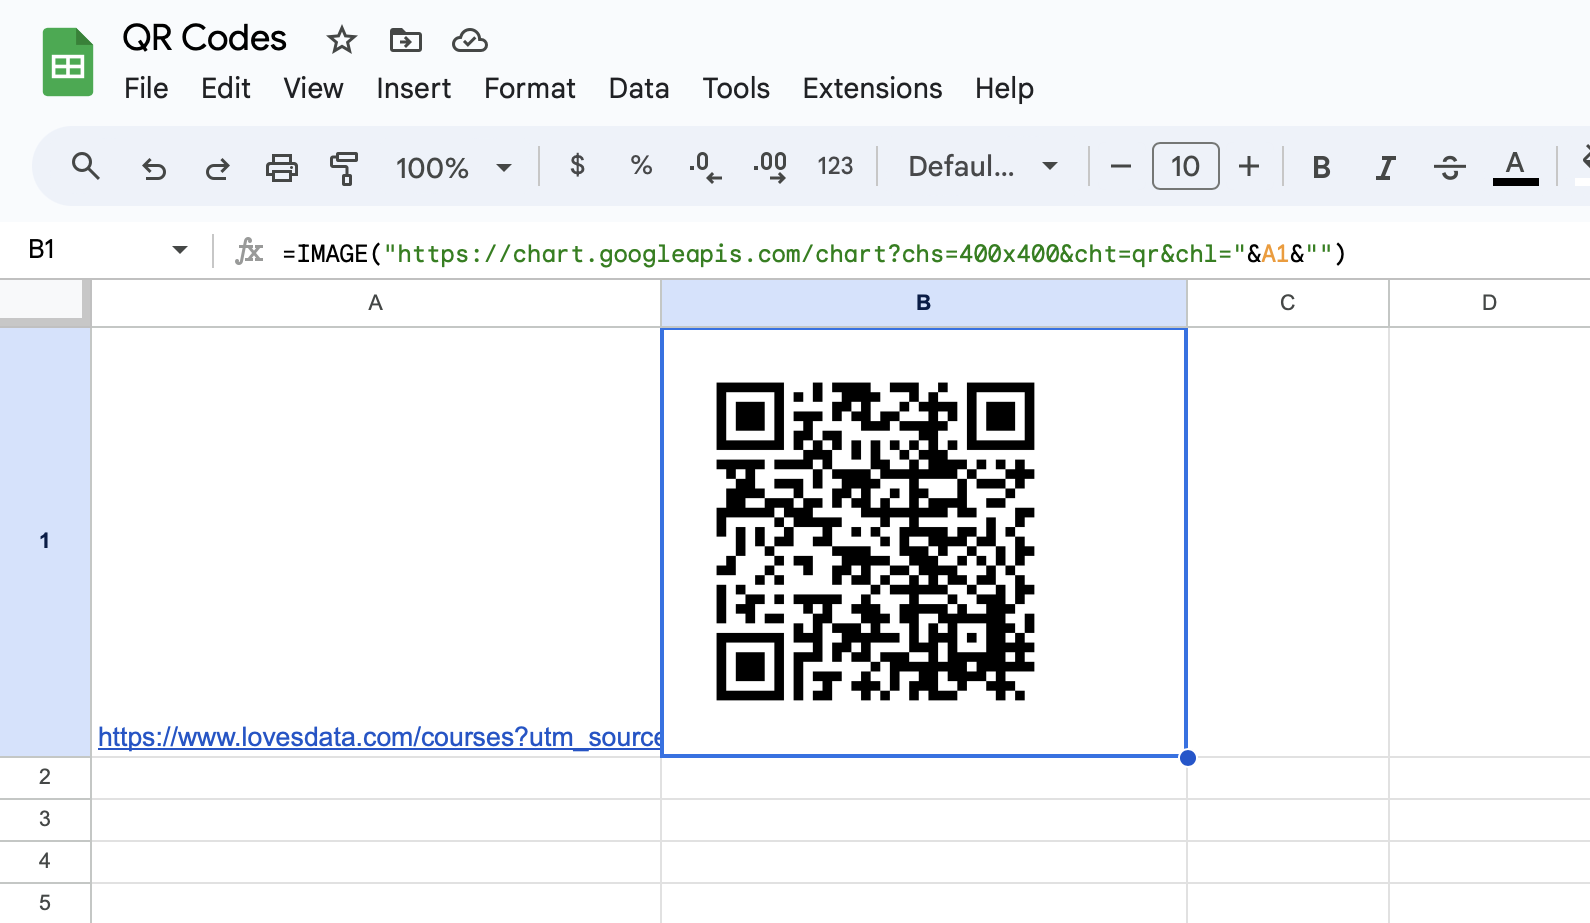
Apart from using a QR code generator, you can also use Google Sheets. Yes, Google Sheets, to create a QR code by following these steps:
1. Create a new spreadsheet and add your campaign tagged URL into the first cell on the top left corner (cell ‘A1’).
2. In the cell to the right (cell ‘B1) enter the following formula:
=IMAGE("https://chart.googleapis.com/chart?chs=200x200&cht=qr&chl="&A1&"")
3. Click ‘Allow Access’ for the warning that pops up (this allows Google Sheets to access the Google Chart API in order to create an image of your QR code).
4. Copy the image of your QR code. If needed, you can also adjust the formula used to create the QR code if you need a larger image. For example, changing chs=200x200 to chs=400x400 will create a larger QR code image.

4. Test Your QR Code
Once you’ve created the QR code using your preferred method. You should then check that the QR code loads the correct campaign tagged URL on your website before you start publishing it.
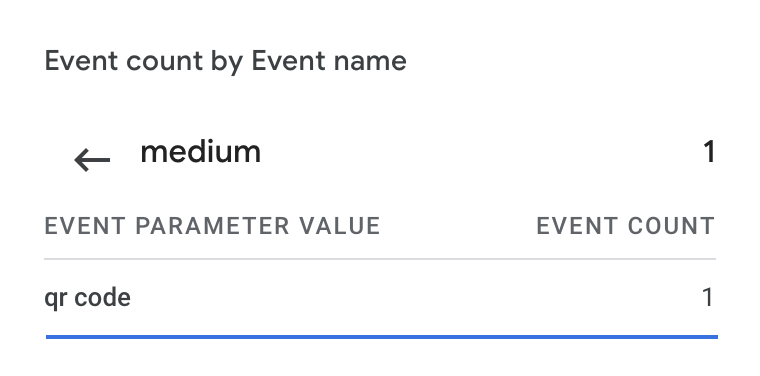
Once you’ve scanned your QR code and your landing page has loaded, open your Google Analytics property and navigate to ‘Reports’ and then open the ‘Realtime’ report.
You can then drill down using the ‘Event Count by Event Name’ card in the Realtime report. To do this, click on the ‘page_view’ event, then click ‘medium’. You should then see ‘qr code’ included in the list of sources. Here’s an example:

You’ve now confirmed your QR code is working and that traffic is being correctly reported in Google Analytics. You can now go ahead and start using your QR code.
5. Analyzing QR Code Performance in GA4
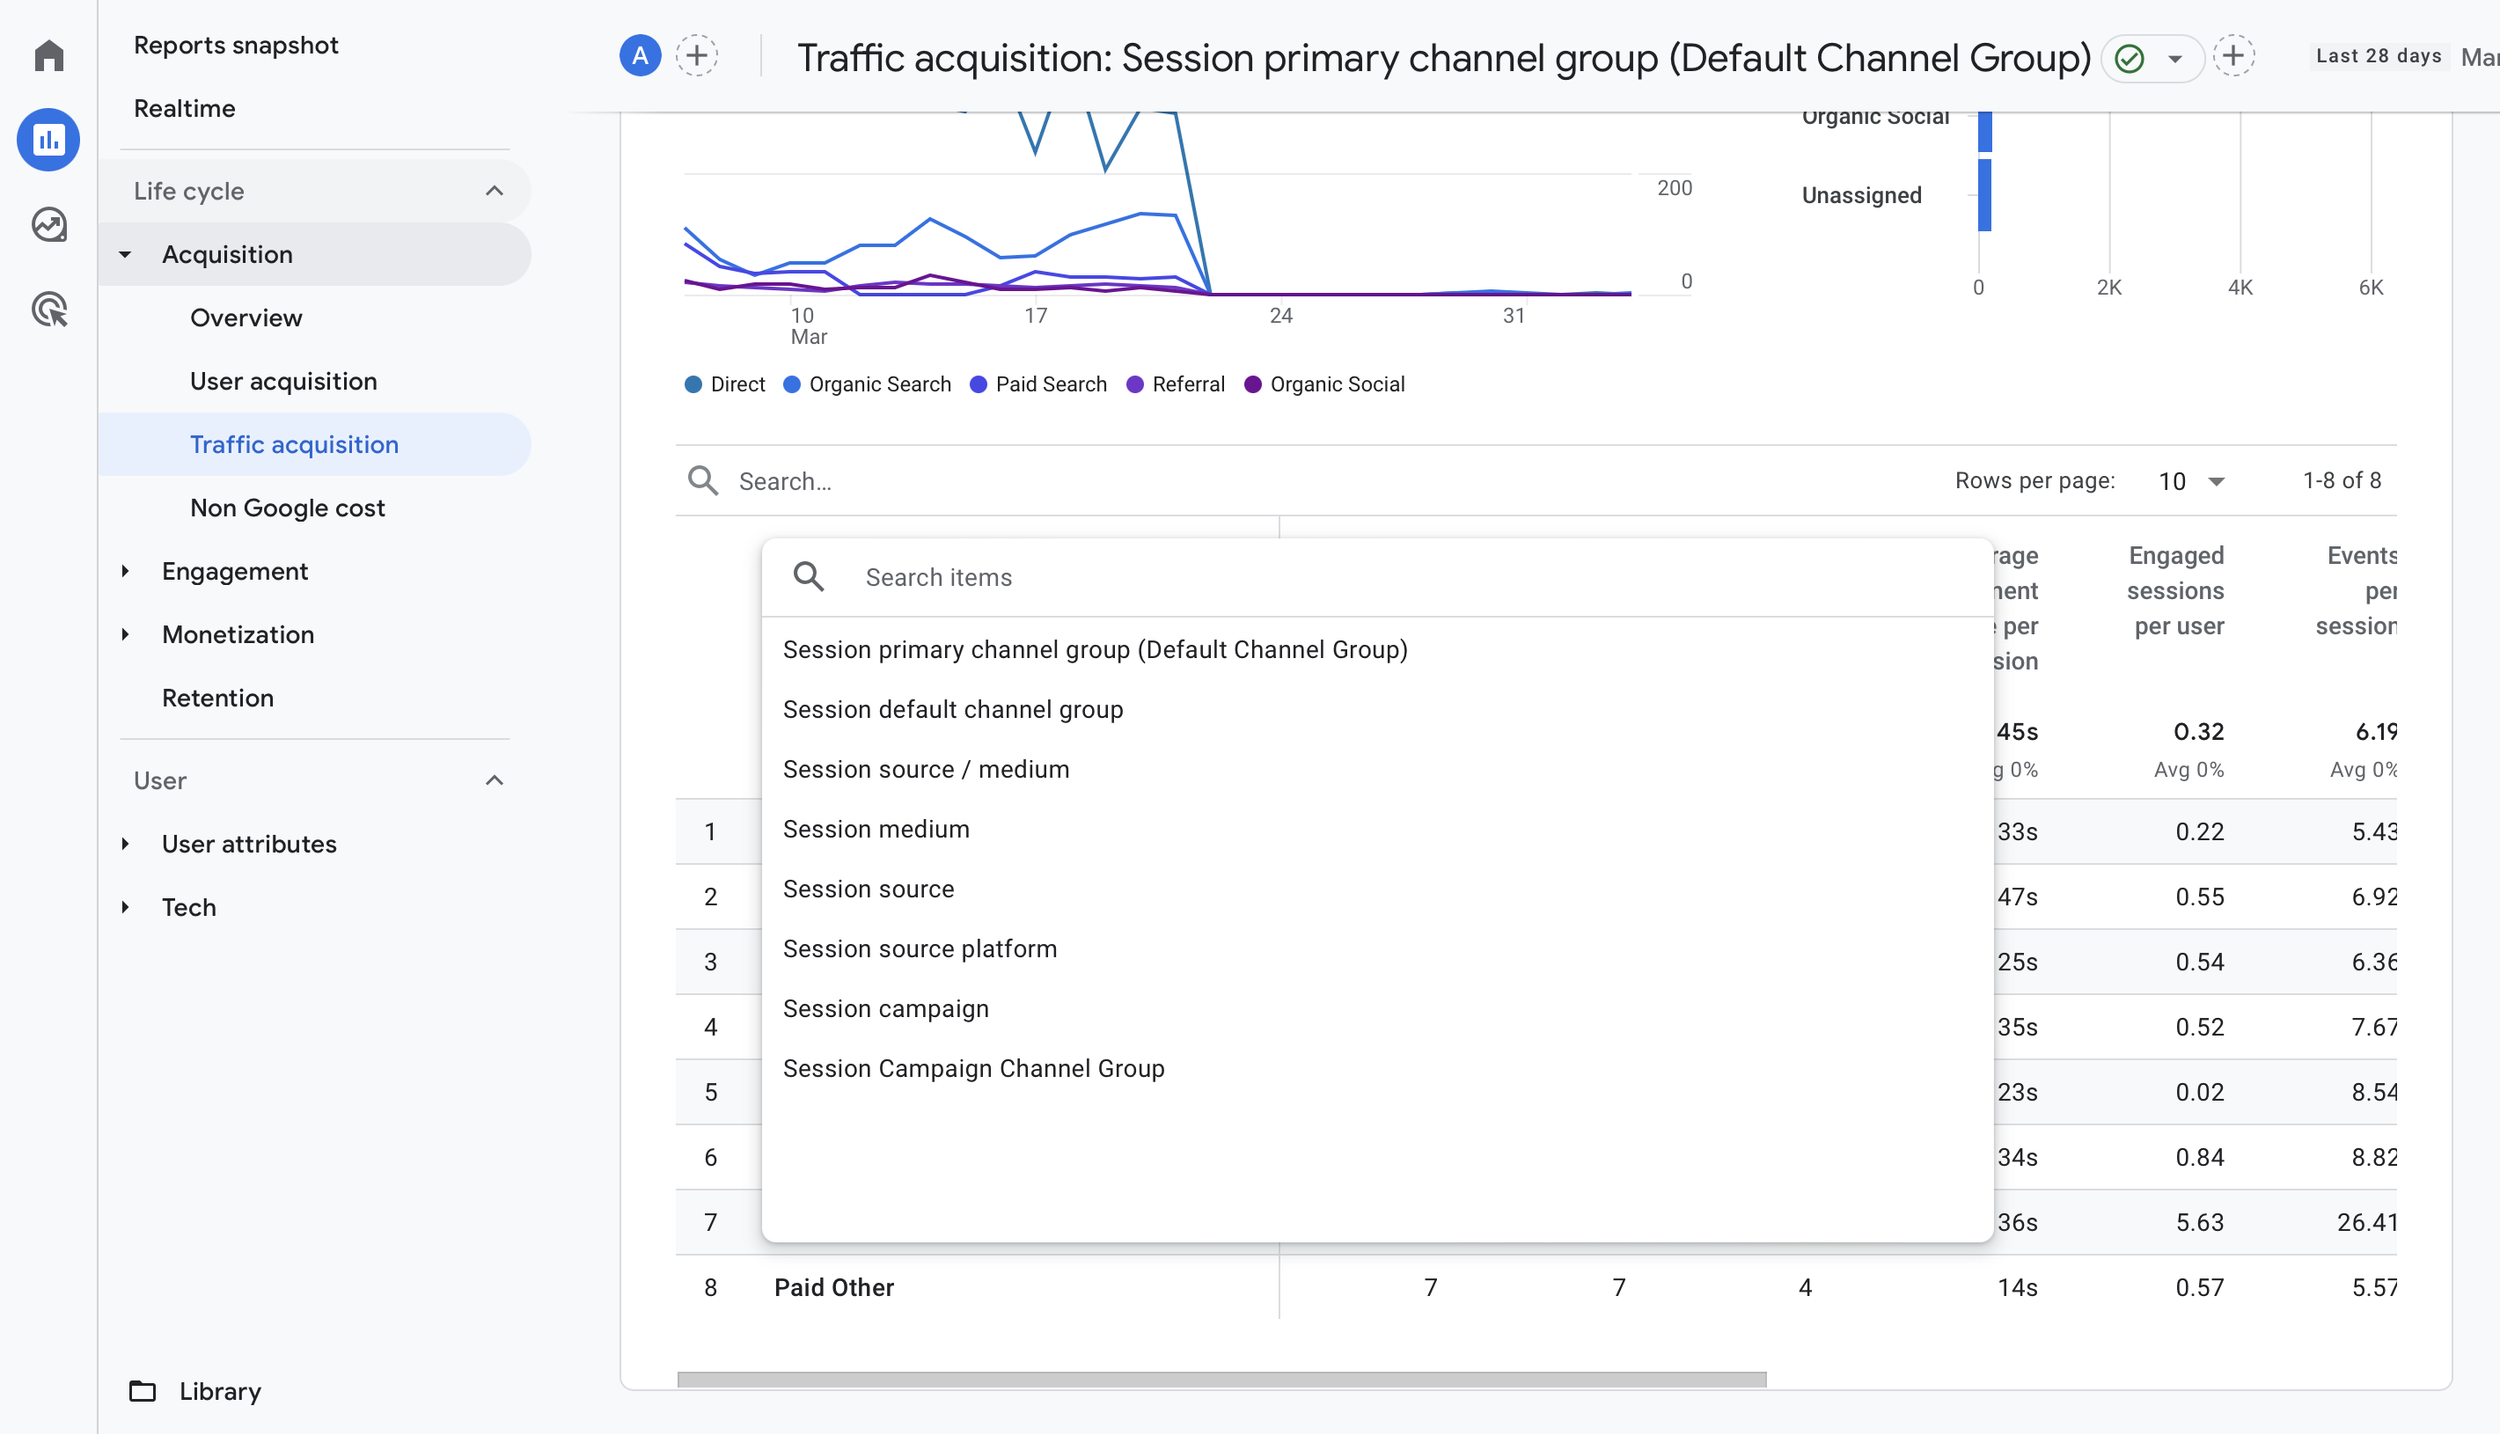
Traffic from your QR codes will be automatically available in the ‘Acquisition’ reports. This includes the ‘Traffic Acquisition’ report which includes session-based campaign tagged dimensions. By default, the report will group your marketing channels, but you can change the default dimension and add additional dimensions to the report.
Here we can see the available dimensions we can use after selecting the default dimension in the report:

For more granular reporting and analysis, you can create custom Exploration reports. To create a custom report, navigate to ‘Explore’ and create a new Exploration report. You can then use any of the campaign tags you’ve used with your QR code for reporting. This can include:
- Campaign Name
- Source
- Medium
- Source Platform
- Creative Format
This lets you dig deeper into the data collected using the UTM tags you’ve used, allowing you to analyze specific campaign performance, compare different campaigns, and evaluate user behavior and conversion metrics.
Frequently Asked Questions:
- How to link QR codes to Google Analytics? While you don’t need to link anything to start tracking QR codes into Google Analytics, you will need to follow the steps we’ve outlined in this article to understand when people use QR codes to find your website.
- Can I track the number of scans of a QR code? You can use Google Analytics to report on the number of times people scan a QR code by looking at the views, sessions, or users metrics. However, Google Analytics won’t include the times people scan a QR code but fail to connect to your website. For example, if their device isn’t connected to the internet.
- What insights can QR Code tracking provide? Tracking QR codes in Google Analytics offers valuable insights into user behavior, demographics, and the devices used to scan the QR codes. Marketers can analyze metrics such as engagement rate, key events (previously ‘conversions’), and other metrics to evaluate the effectiveness of different QR code campaigns and optimize landing pages.
- How to generate UTM URLs for QR Codes in Google Analytics? As we’ve covered in this article, you can use Google’s Campaign URL Builder or manually create your own campaign tagged URLs. Once you’ve added UTM campaign tags to the URL, you can use this with your preferred QR code generator.
Conclusion
Tracking QR codes with Google Analytics will provide you with additional insights when people land on your website. By understanding how users interact with your content after scanning a QR code, you can make data-driven decisions to enhance your marketing strategies, improve user engagement, and drive better outcomes. Implementing the steps outlined in this guide will mean you’re using QR codes and Google Analytics to ensure your marketing efforts are effective and measurable.

Comments