What can you do with Google Analytics?
Loves Data
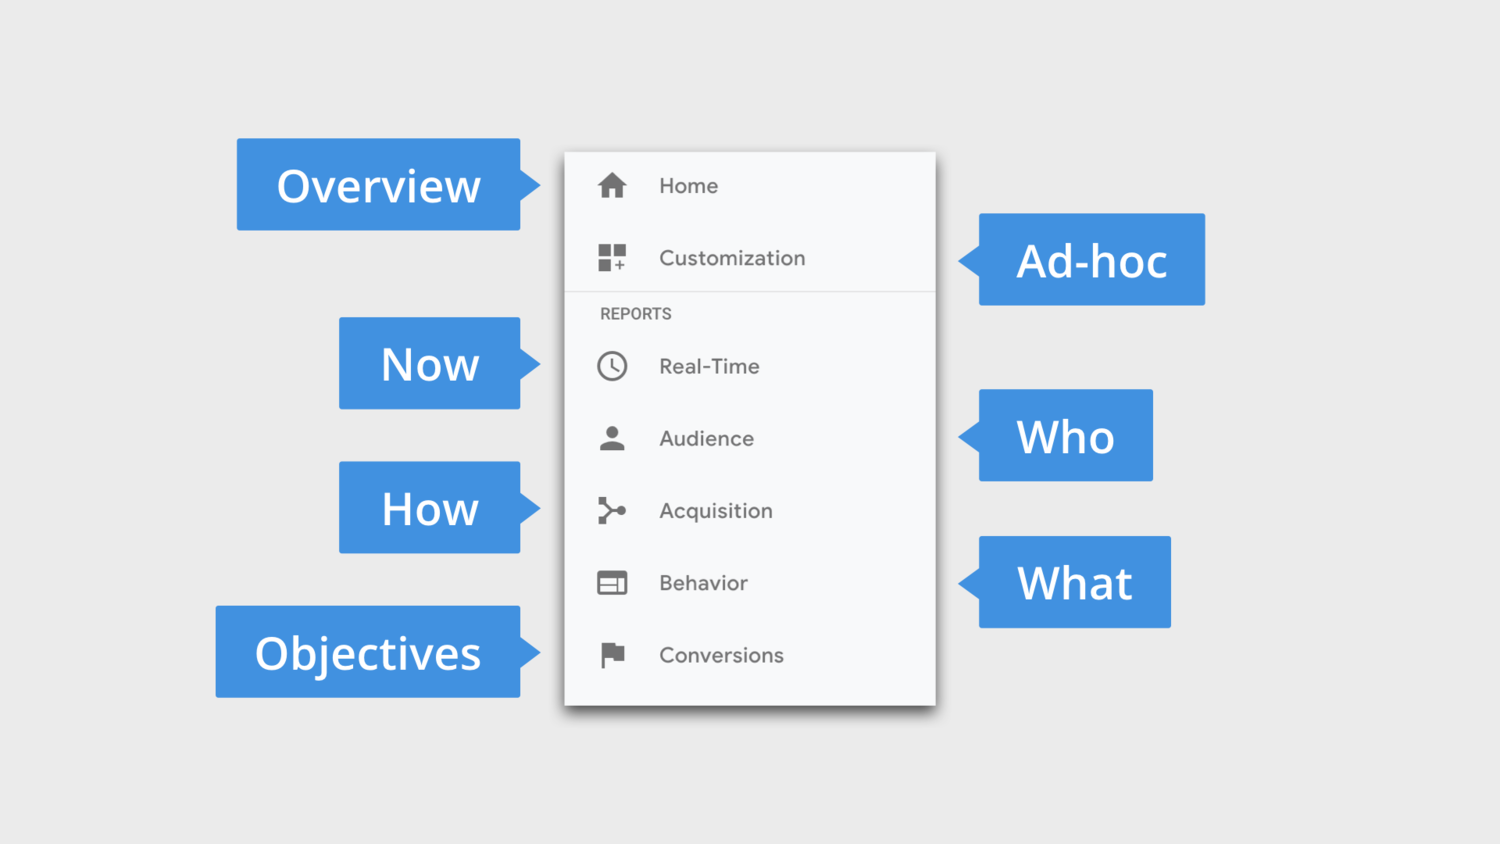
The Who, What, When, Where, Why and How of visitors interacting with your website, and campaigns directed to it, are all there in Google Analytics. We’re going to explore seven things you can do with Google Analytics by asking questions about your website, your website’s audience and your marketing campaigns.
You can use your Google Analytics reports to identify opportunities to boost conversions and improve engagement on your website. You can use it to understand how people experience your website, including the devices and browsers they use to load your content. You can see the content people view and how they navigate through your pages. You can see trends, monitor the performance of your marketing campaigns and more.
The way you use and apply Google Analytics will depend on two things. It will depend on the type of website you’re tracking and your role. For example, if you’re the marketing manager for an ecommerce site, then the way you use Google Analytics will be different to a content coordinator in a government department.
You need to start by establishing what success looks like for your organization and then identify the Google Analytics reports that will help you measure and interpret success. If your website lets people purchase online (this includes physical products, digital items, services and even donations), then success will be tied to revenue. If your website is about capturing contact details and generating leads, then success might still be based on direct revenue (like leads that are converted offline or products purchased in-store) or success might be based on other revenue streams (like sponsorship or affiliates). If your website is about providing information to your audience, then success might be about engagement and how people are finding answers to their questions (for example, a support site that reduces calls to your call center).
Apart from establishing the objectives for your website, you will also need to ensure you’re collecting data into your Google Analytics reports, tracking conversions into Google Analytics (these will reflect your objectives) and tracking your marketing campaigns. If you need help with any of these steps, you can download my getting started guide.
Now it’s time to explore seven things you can do with your reports!
1. Are people converting on your website?
Once you are tracking your website objectives into Google Analytics (with goals and ecommerce tracking), you will be able to see if people are converting. This means you can report on the total number of conversions and your conversion rate. However, the real insights come when you begin to layer your conversion data with other information, like your marketing channels and your website content.
You can identify your top-performing campaigns and use these insights to do more of what works (and less of what doesn’t). This allows you to optimize where you’re spending your time and budget.
You can apply a segment to your reports to focus on people who have converted. This allows you to identify the content, navigation paths, behavior and traits of your most valuable audience members. You can then aim to optimize your website and content to attract more people like those who have already converted.
Apart from reviewing your campaigns and applying segments for your converted users, you can also identify seasonality and trends for your conversions and conversion rate. This will help inform when to launch new initiatives and when you’re likely to achieve the best return from your advertising campaigns and budgets.
You can learn more in my post covering goal setup and configuration.
2. Which pages are slow to load on your website?
Since the loading time of your website has a direct impact on your conversion rate, you can boost results by optimizing the loading time of your pages. Google Analytics lets you view the loading time of your pages based on real people loading your content.
You can find this report by navigating to ‘Behavior’, then ‘Site Speed’ and ‘Page Timings’. Then select ‘Technical’ above the graph and click the ‘Data’ icon below the graph on the right (it looks like a small grid). Following these steps allows you to view the Average Page Load Time and the Page Load Sample. Being able to see the sample size is important since Google Analytics calculates the time based on a portion of pageviews.
You can also view recommendations to improve the loading time of your pages by heading to ‘Speed Suggestions’ (which is also under the ‘Behavior’ and ‘Site Speed’).
This report will open Google’s PageSpeed Insights tool, which includes a range of recommendations to improve the loading time and performance of your pages.
3. What pages on your website generate the most value?
You can use Google Analytics to pinpoint the most valuable content on your website. This allows you to create more content based on what’s already connecting with your audience. Plus you can apply the same approach to other content on your website.
So how do you identify your most valuable content?
The answer is Page Value.
The Page Value metric looks at the value from goal conversions and ecommerce transactions and applies the value to the pages people viewed before converting. This means you can quickly identify the most valuable content on your website.
You can learn more about Page Value in my post on how to set goal values in Google Analytics.
4. Are people purchasing? What do they buy?
If you’re selling online, then it’s vital to see transactions and the products people are purchasing reported in Google Analytics. This allows you to understand factors contributing to sales and allows you to promote relevant products on your website.
Ecommerce tracking also lets you understand how people travel through your shopping cart. This allows you to identify where people drop off and create remarketing lists to bring people back to your website.
You should aim to optimize the step with the most significant drop off first, but remember, even Amazon can’t convert 100% of their users, so aim for small, incremental improvements. Look for opportunities to make the checkout experience as frictionless as possible.
5. What are your top landing pages?
The landing pages report lets you understand the first pages people view when they visit your website. You can find the report by navigating to ‘Behavior’, then ‘Site Content’ and ‘Landing Pages’.
Your top landing pages are the perfect place to cross-promote your most important website content and navigation. Let’s say a blog post is one of your top 10 landing pages, you could include links to other related posts in the content and even link through to relevant products on your website.
Tip: Open your website in another browser tab or window so you can view the pages while using the report.
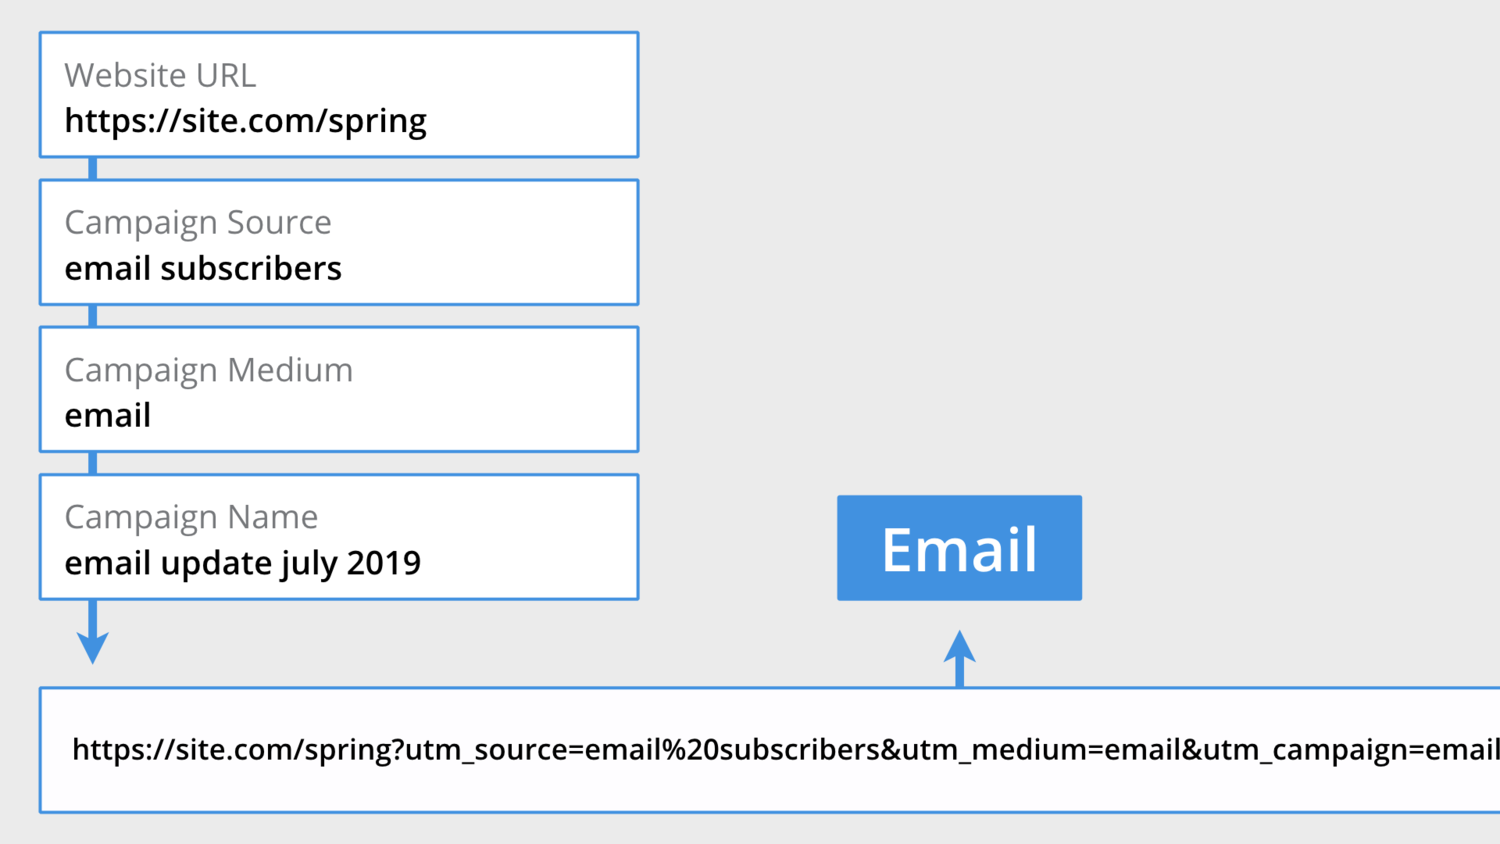
6. How are your email campaigns performing?
Although email campaigns aren’t automatically tracked by Google Analytics, most email marketing platforms let you quickly add campaign tags to your inbound links. This allows you to see exactly how people are finding your website and understand if your email campaigns are driving engagement and conversions.
Once you’ve identified the email campaigns that are meeting your objectives, you can then review the content and call-to-actions included in the emails. This allows you to inform your future email campaigns and repeat what works for your audience.
You can learn more in my post covering Google Analytics campaign tracking.
7. How old are your audience members? Are they male or female?
Once you’ve enabled the ‘Advertising Features’ option in Google Analytics, you will find insights about the demographics of your audience. You can see age brackets, gender and even their areas of interest. You can find the reports under ‘Audience’ and then ‘Demographics’.
These reports use data from Google’s advertising cookies, which means if you find particular demographics that are converting well, you have the option of targeting them in your Google Ads campaigns.
Tip: Apart from targeting ads, try using the demographics and interests reports when creating and validating personas for your organization and website.
What else can you ask?
Here are some more questions you can ask about your audience. Google Analytics will help you answer these questions and if you’re not sure which report to use, then try copying and pasting these questions into the search bar at the top of the interface.
More questions you can answer using Google Analytics:
- What cities are people located in when they visit my website?
- What are my users interested in?
- What are the age brackets of my audience?
- Is my audience male or female?
- Do they use multiple devices to convert?
- Are they using a mobile, tablet or desktop device?
- How does my website compare to other websites?
- What pages do people view on my website?
- What are my top landing pages?
- Which pages are fast to load?
- Which pages are slow to load?
- What do people search for within my website?
- What actions do people take within the pages of my website?
- How do people navigate between pages on my website?
- What are people viewing on my website right now?
- When do people first find my website?
- How often do people return to my website?
- Do people engage with multiple marketing channels before converting?
- What marketing channels do people use to find my website?
- Are people coming from organic or paid initiatives?
- How are my Google Ads campaigns performing?
- Where is my website appearing in Google organic search results?
- Are people coming from social networks converting?
- How are my custom campaigns performing?
Conclusion
The reports in Google Analytics can help you answer questions about who is visiting your website, what they are looking for and when, and where and how they navigate on different devices. Answering these questions has the potential to help you target, engage and convert more visitors.
If you’re feeling stuck and you’re not sure what you can do with Google Analytics, then try asking a question in the search bar at the top of the interface or head to the ‘Home’ report where you will find additional insights.
Comments