Understand Your Audience: Leverage Google Analytics Data
Loves Data
Google Analytics is a powerful tool that helps you understand your website's performance. With it, you can track user behavior, measure effectiveness, and uncover hidden opportunities. Whether you're looking to improve engagement or boost conversions, Google Analytics provides the data you need to make informed decisions.
One of the key benefits of using Google Analytics is its ability to track specific actions on your website. You can set up recommended and custom events to measure important interactions like form submissions, purchases, or content downloads. This valuable data lets you see what's working and needs improvement.
Additionally, comparisons and segments helps you dive deeper into your data. By segmenting your audience, you can uncover patterns and trends that might not be apparent at first glance. This feature enables you to compare different groups of users, providing a clearer picture of who your audience is and how they behave on your site.
Custom exploration reports offer another way to make the most of your data. These tools allow you to create tailored views to highlight the metrics that matter most to you. By focusing on specific data points, you can quickly identify opportunities to optimize your website and marketing strategies.
By fully utilizing Google Analytics, you can gain a competitive edge and drive more success for your business. This article will guide you through setting up goals and events, using segmentation for deeper insights, and leveraging custom reports and dashboards. Get ready to unlock the full potential of your website data!
Overview of Google Analytics
Google Analytics is a tool that helps you track and analyze your website's performance. It provides detailed reports on user behavior, traffic sources, and conversion rates. With this data, you can make informed decisions to improve your site's effectiveness.
One of the main features of Google Analytics is the ability to track user sessions. A session is a period where a user interacts with your site. Google Analytics records each session, showing you how visitors navigate through your site, which pages they visit, and how long they stay.
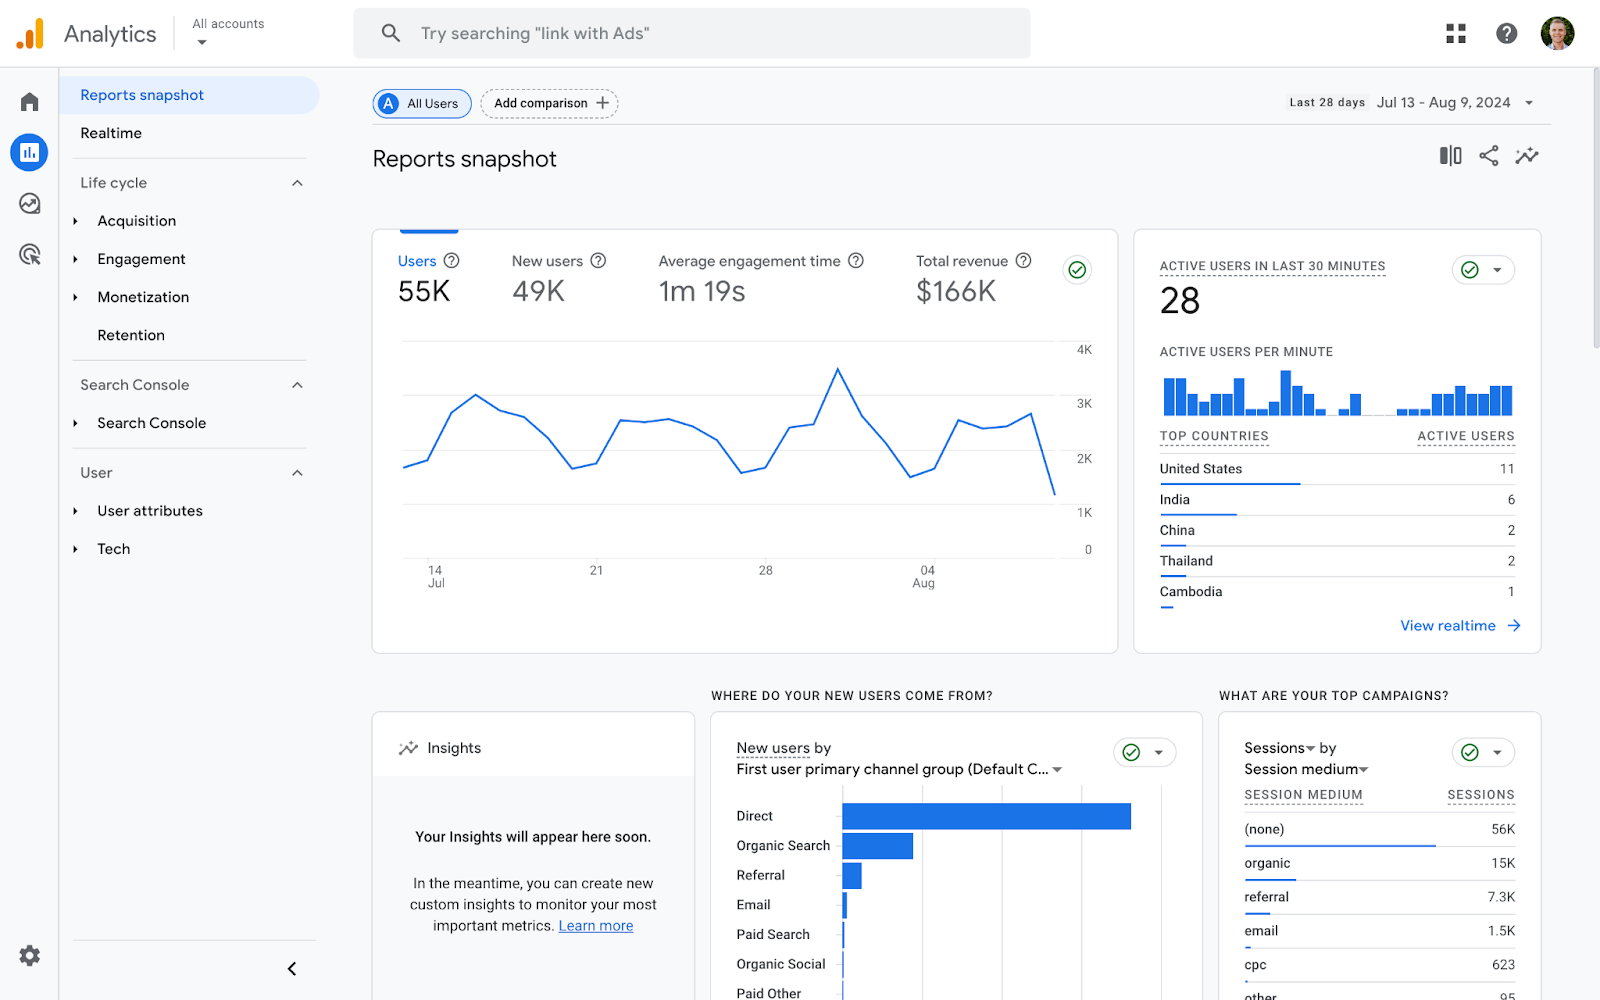
Another feature is the traffic sources report. This report tells you where your visitors are coming from, such as search engines, social media, or direct visits. Understanding your traffic sources helps you optimize your marketing efforts to drive more targeted traffic to your site.
Google Analytics also offers insights into user demographics. You can see information like age, gender, and location of your visitors. This helps you tailor your content and marketing strategies to better meet the needs of your audience.
Watch our Google Analytics tutorial series to learn how to get started with Google Analytics and walkthrough some of the most important reports and configuration options:
Setting up Events and Key Events
Setting up events and key events in Google Analytics allows you to track specific actions on your website. Google Analytics automatically tracks the pages people view on your website, along with other actions like when people play embedded YouTube videos and click outbound links. However, you can also implement additional recommended and custom events to track additional actions taking place on your website.
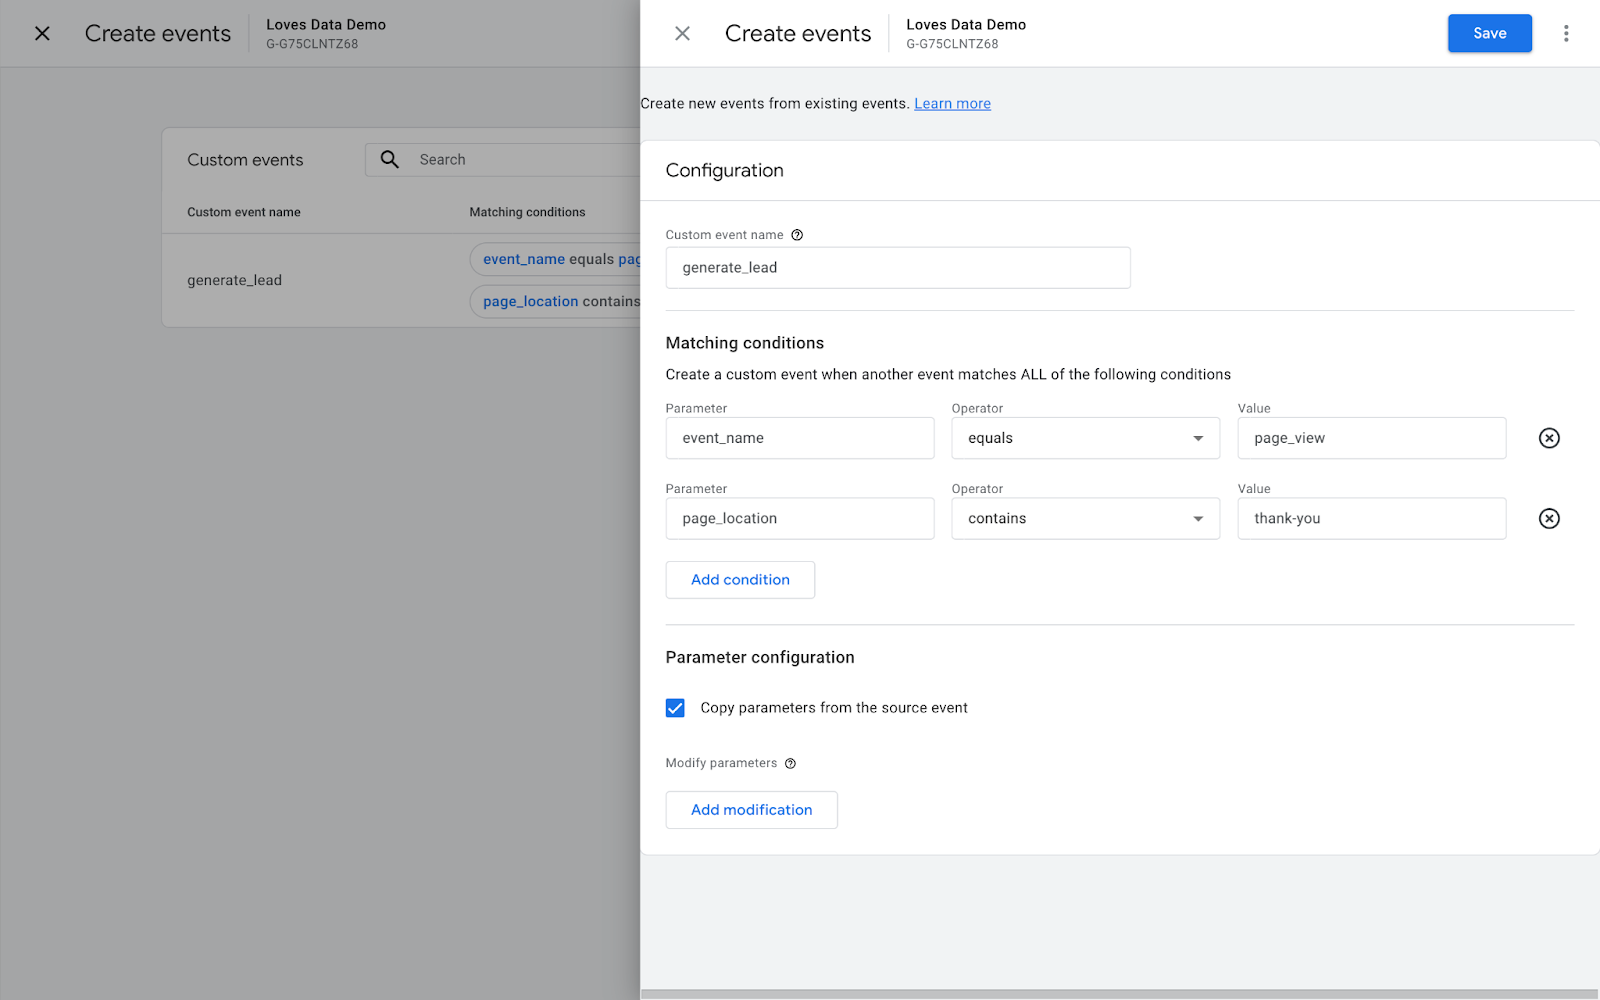
To set up new events based on existing events inside the Google Analytics interface, follow these steps:
- Go to the Admin Section: In your Google Analytics account, navigate to the "Admin" section.
- Set Up Event Tracking: Under "Data Display", select "Events", then click the "Create Event" button.
- Configure the Event: Define the name of the new event you want to trigger, matching conditions, and parameters. Once you’re happy, click "Create."
Watch our Google Analytics events tutorial to learn more about events:
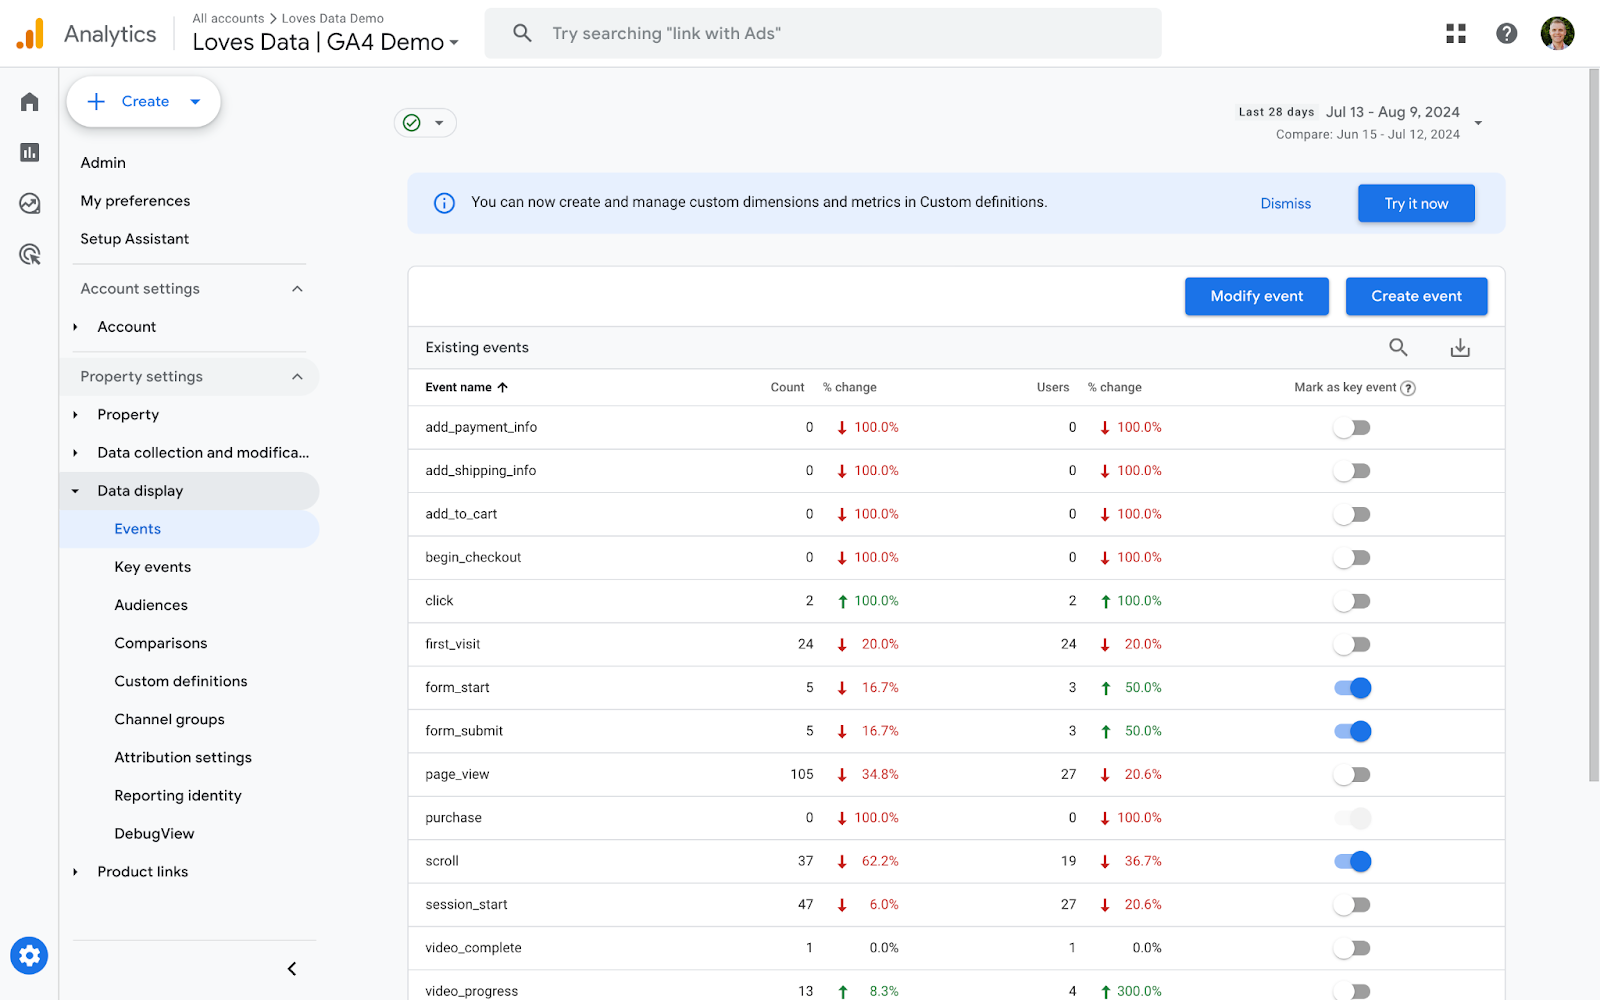
Once you’re tracking all of the events that are relevant for your business, you can then configure your most important events to report conversion actions. This is achieved using key events. You can use key events to measure important actions, including form submissions, purchases, or account sign-ups.
Here's how you can set up key events:
- Navigate to Admin Settings: In your Google Analytics account, go to the "Admin" section. Under "Data Display", select "Events."
- Enable Key Event: For any events you want to report as a conversion, click the switch in the "Mark As Key Event" colum on the right.
Watch our walkthrough to see how to configure key events in Google Analytics to track conversions:
By setting up events and key events, you can better understand how users interact with your site and measure the success of specific actions. This data provides valuable insights that help you optimize your website and achieve your business goals.
Using Comparisions and Segments for Deeper Insights
Segmentation is a powerful feature in Google Analytics that allows you to break down your data into smaller, more manageable pieces. By using comparisions and segments, you can uncover hidden patterns and trends that might be missed in your overall data.
- Create Comparisons: You can create comparisons based on various criteria like user behavior, demographics, or traffic sources. For example, you can create segments for mobile users, new visitors, or users who completed a purchase.
- Compare Performance: Once you've created your comparisons, you can add multiple comparisons to a report to see them side by side. This allows you to see how different groups of users interact with your site.
- Behavior Analysis: Use segmentation to analyze how different users navigate your site. This can reveal important insights, such as which pages are most popular among particular segments.
Watch our Google Analytics comparisons tutorial for the complete steps to segment your reports:
By understanding these different segments, you can tailor your marketing strategies to target specific audiences more effectively. This will improve user engagement and drive better results for your business.
Leveraging Custom Exploration Reports
Custom reports and dashboards in Google Analytics allow you to focus on the metrics that matter most to your business. By creating tailored views, you can easily monitor key performance indicators (KPIs) and gain deeper insights into your website's performance.
- Create Custom Exploration Reports: To create a custom report, navigate to "Explore" in Google Analytics. Click on "Blank" to create a new report from scratch, or select on of the templates to start creating a report.
- Define the segments, metrics, dimensions, and other elements you want to include in your report.
- Filters (Optional): Use filters to refine the data and focus on the most relevant information.

Custom exploration reports help you quickly identify trends and monitor important metrics. This enables you to make data-driven decisions and continuously optimize your website and marketing strategies.
Beyond the Surface: Deep Dive into Google Analytics
Google Analytics is a valuable tool for uncovering hidden opportunities in your data. By using features like goals, events, segmentation, and custom reports, you can gain a deep understanding of user behavior and website performance. These insights help you make informed decisions to optimize your site and achieve your business goals.
Investing time in setting up and analyzing your data with Google Analytics will provide long-term benefits. You'll be better equipped to identify areas for improvement, tailor your marketing efforts, and ultimately, drive more successful outcomes.
Ready to take your Google Analytics skills to the next level? Explore the expert Google Analytics training courses offered by Loves Data. Our courses will guide you through advanced features and best practices, helping you unlock the full potential of your data. Sign up today with Loves Data and elevate your online marketing success!
Comments