Setting Targets in Google Data Studio
Loves Data
If you’re tracking your performance against targets or KPIs, then Google Data Studio can be a great way to see how you’re progressing. In this tutorial, you will learn how to set (and display) targets in Google Data Studio. You will learn how to add reference lines to time series charts, set targets for bullet charts, and report progress for a metric.
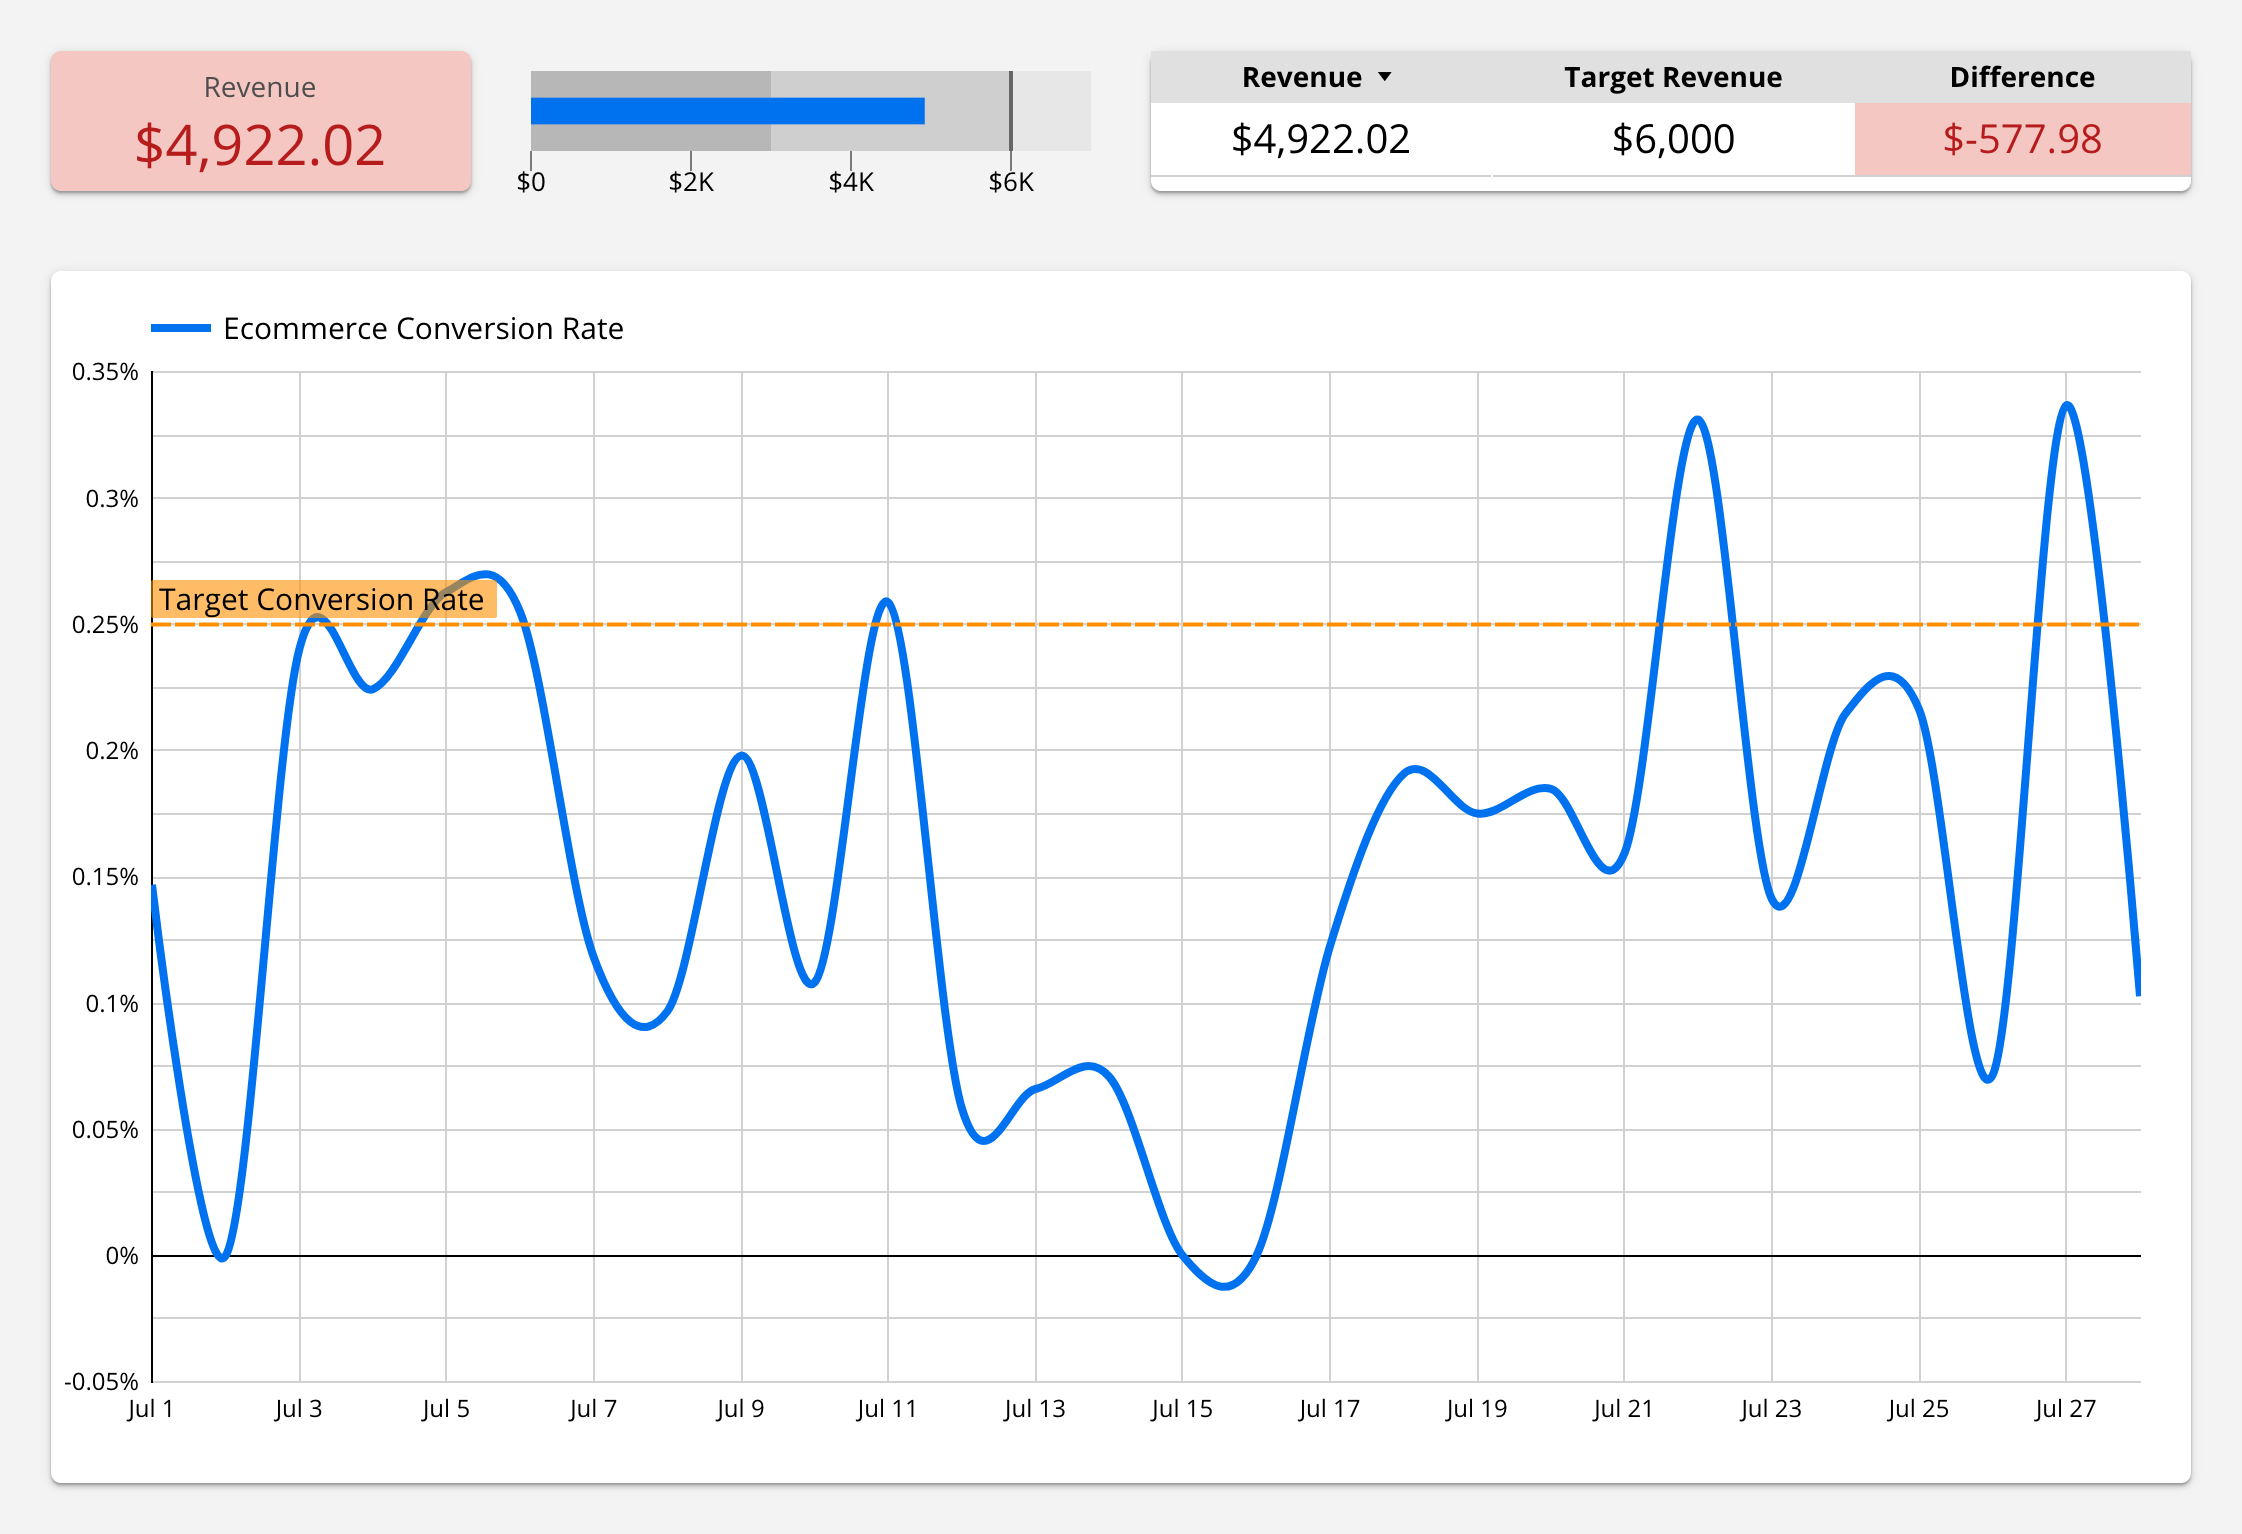
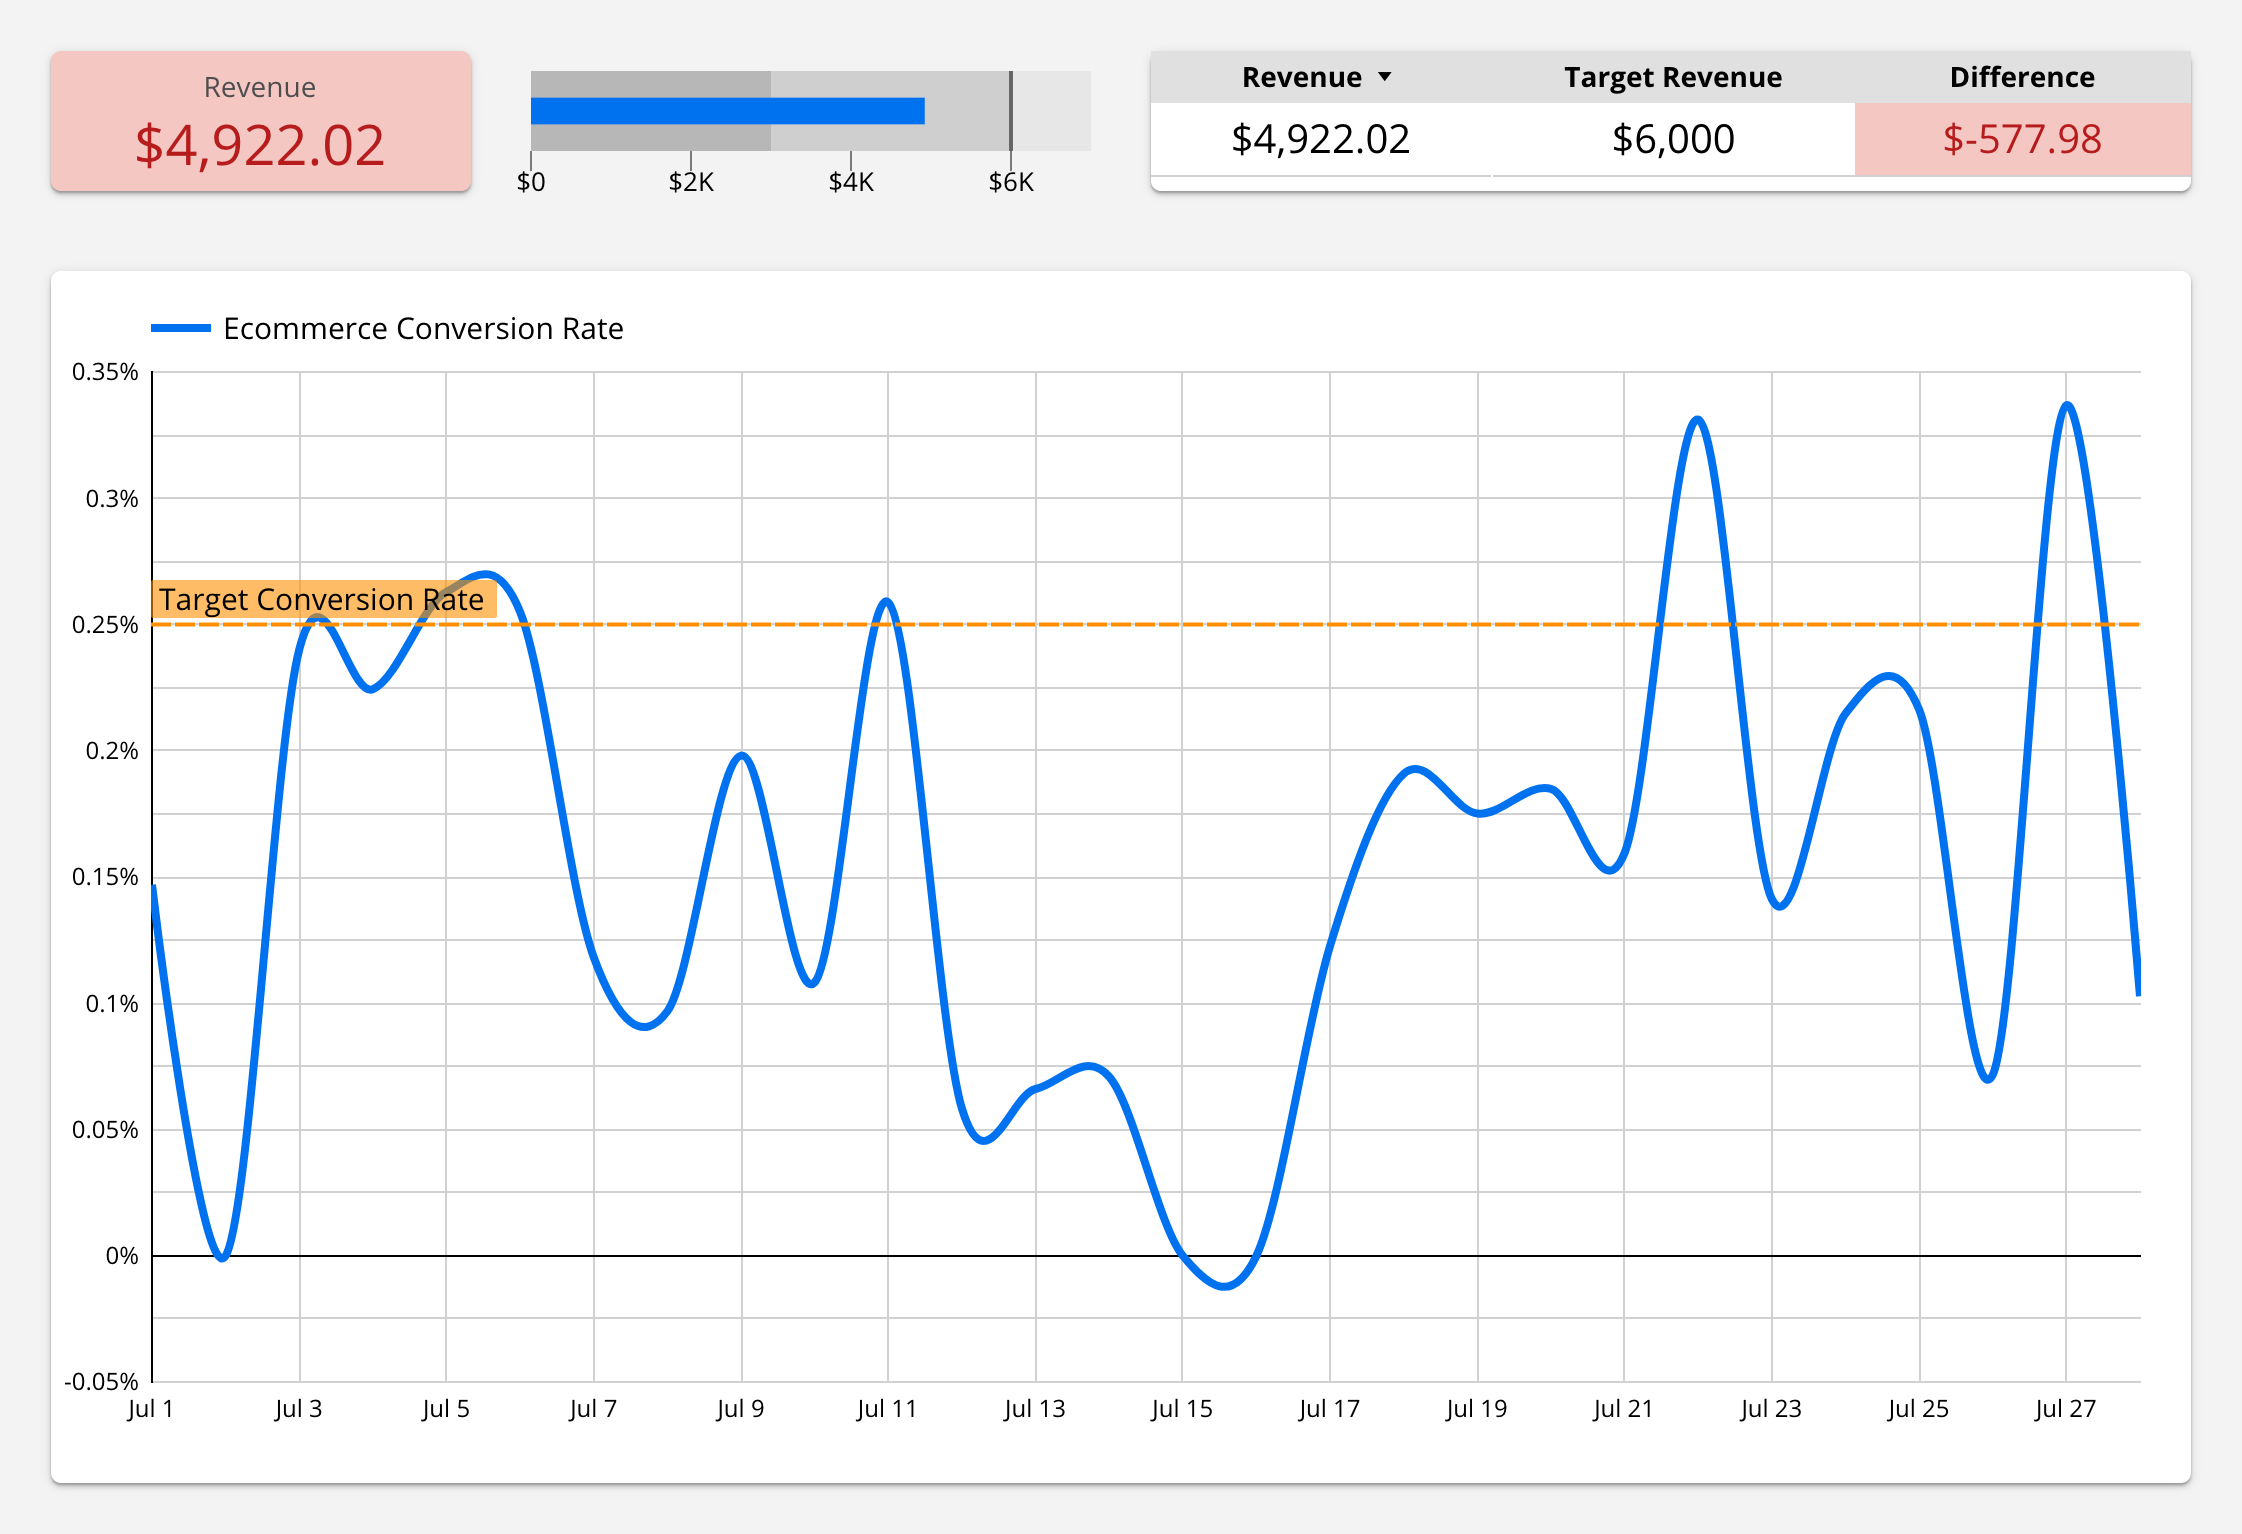
Here’s the report we will create:

The report uses the sample data provided by Google and uses two ecommerce metrics – revenue and ecommerce conversion rate. However, you can customize this report to use goal metrics or engagement metrics. For example, if you’re focused on generating leads, you could swap the revenue metric for goal completions or goal value.
Okay, let’s get started!
In a hurry? Here’s a copy of my report that you can customize in Google Data Studio account.


Comments