Multi-Channel Funnels Part 2: Reports
Loves DataWhat is a Channel?
A Channel is a particular Source and Medium combination in Google Analytics. You need to understand this before you can use Multi-Channel Funnels correctly.
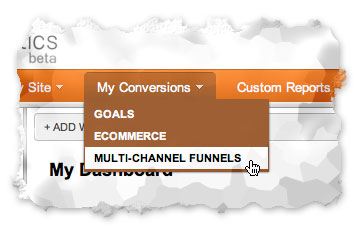
multi-channel-funnels-menu
Examples of Channels include:
- Google / CPC: your traffic coming from paid searches on Google
- Bing / Organic: your traffic coming from free searches on Bing
- Newsletter / Email: your traffic coming from your email newsletter campaign
- Advertising / Offline: your traffic coming from your print ads
- Website / Referral: your traffic coming from links on other websites
You can navigate to your All Traffic Sources report (under 'Traffic Sources'). Each row will represent a channel that will potentially be displayed in your Multi-Channel Funnels reports.
Think of a Channel as a defined marketing initiative that you can use to drive leads, sales or brand awareness.
Types of Attribution
Attribution = Who or What Gets Credit for a Conversion
There are different ways to attribute conversions to your individual marketing initiatives. There are three forms of attribution:
- The most common form of attribution is last click attribution where the last method of accessing your website is attributed the credit for the conversion.
- First click attribution where the first method of accessing your site is attributed the credit for the conversion.
- Multi-touch (or multi-attribution) where we look at the different ways people access your site before converting.
A scale or attribution model can also be applied in order to give more credit to the last method and sometimes first method of accessing your site.
Multi-Channel Funnels: The Reports
Overview Report
This report provides a summary of total conversions for each Channel and the number of Assisted Conversions. Assisted Conversions are conversions where a visitor did not convert the first time they accessed your site but came back to your site via another source/medium and then converted.
By default you will be viewing all your goal conversions but you can also select individual goals.
Multi-Channel Mix
Multi-Channel Mix in the overview report allows you to select different Channels to see which Channels work in combination with one another. You can select particular Channels to see the overlap to see which combinations achieve the most conversions.
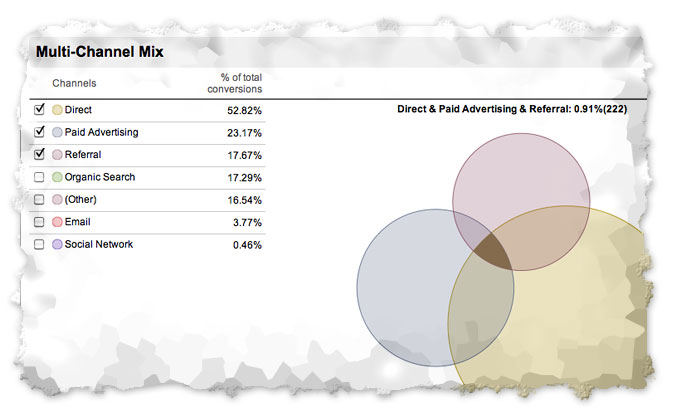
multi-channel-mix
Assisted Conversions
By default the Assisted Conversions report shows you the number of Assisted Conversions compared to last interaction conversions. By comparing Assisted to Last Interaction you can see if a particular Channel performed better by influencing or closing conversions.
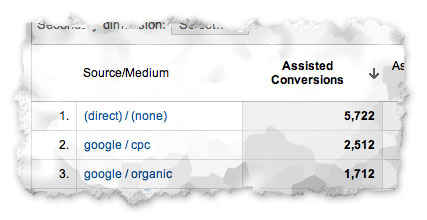
assisted-conversions
Google has also introduced a new metric called Assisted / Last Interaction Conversions (the last column on the right) which is a ratio comparing Assisted to Last Interaction conversions. A figure above 1.5 indicates the channel is better at Assisting and a figure approaching 0 indicates the Channel is better at closing conversions.
You can also use the same report to compare First Interaction Conversions to Last Interaction Conversions. Just click 'First Interaction Analysis' at the top of the report. You will now see which Channels are converting the first time somebody visits your site – the number of visitors converting immediately after accessing your site via a particular Channel.
You will notice the ratio is now called First / Last Interaction Conversions. A figure above 1.5 indicates the Channel is better at converting on the first visit to your site. A figure approaching 0 indicates the Channel will require visitors to come back again before they are likely to convert.
Ways to View Channels
So far we have looked at Source/Medium as a Channel, but you also have the option of just viewing the Source or the Medium. So rather than seeing different rows for organic traffic from Google, Bing and Yahoo, you can select ‘Medium’ and they will be aggregated together as one row called organic.
Another option is to view Channels by keywords, campaign names and AdWords metrics, including matched search query, campaign, ad group and placement URL.
There is also the option to group Channels. This allows you to combine Channels to simplify your reports. Selecting ‘Default Traffic Groups’ will give you aggregated groups such as: organic search, email, paid advertising, direct, referral, social network, etc.
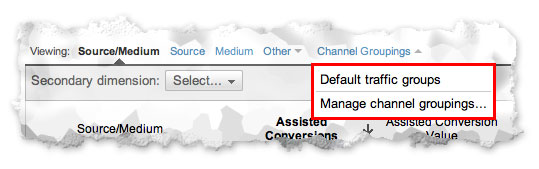
default-channel-groups
Default Traffic Groups allows you to quickly see and assess methods of accessing your site overall. You can also define your own Custom Channel Groups for example if you wanted to compare your offline and online campaigns or compare your search advertising to your display advertising.
Define your own Custom Channel Groups:
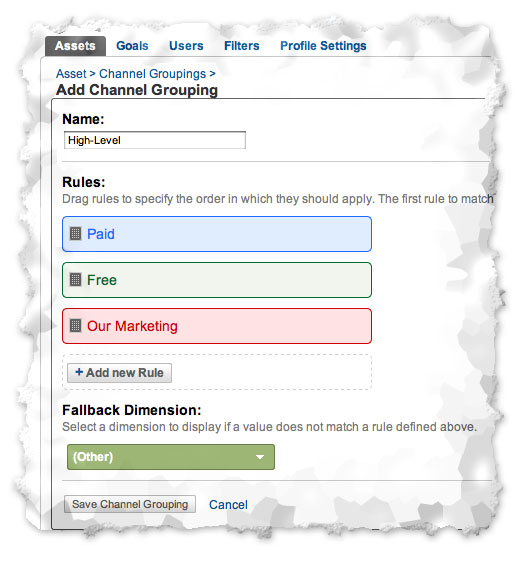
custom-channel-grouping
View your Custom Channel Groups in reports:
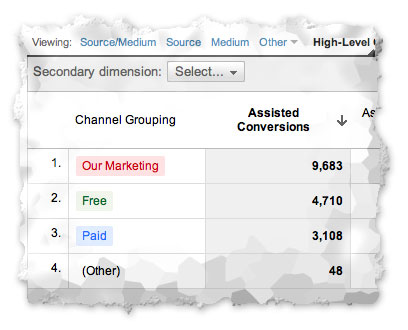
custom-channel-grouping-2
Top Conversion Paths
This report shows you the different ways people access your site that lead to conversions and provides insights into the Channel Paths (sequence of interactions) visitors use prior to converting. You can see the total conversions for each path and the dollar value associated with the conversion.
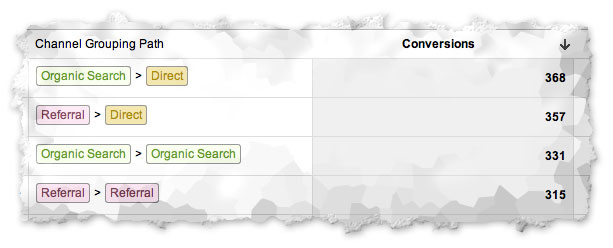
top-conversion-paths
There are also other ways to view the Channels, you can for example select ‘Source Path’ and 'Medium Path' or you can use your own Channel Groups as noted previously.
Time Lag
This report shows you how long it took people to convert, for example;
- 0 Days = they came to your site and converted on the same day
- 1 Day = they came to your site and the next day they converted
- 2 Days = they came to your site and converted 2 days later
- etc.
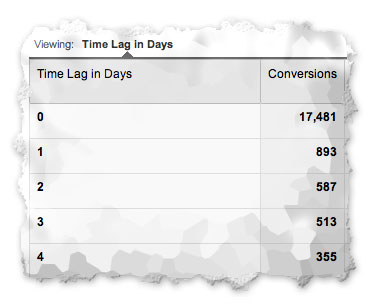
time-lag
The Time Lag report also provides a comparison of conversions to Conversion Value. You might for example see some Time Frames where more visitors convert but for a lower value or vice versa.
Multi-Channel Funnels including the Time Lag report work on data for the last 30 days leading to a visitor’s conversion. This means if someone visits your site in January, then comes back in March and converts, the original channel from January will not be shown in the report. In this case only the Channel for March will be counted.
Path Length
This report allows you to quickly see how many conversions resulted from one or more Channel Interactions. So you can see whether visitors require Multiple Channels to convert or if they convert after accessing your site via a single Channel.
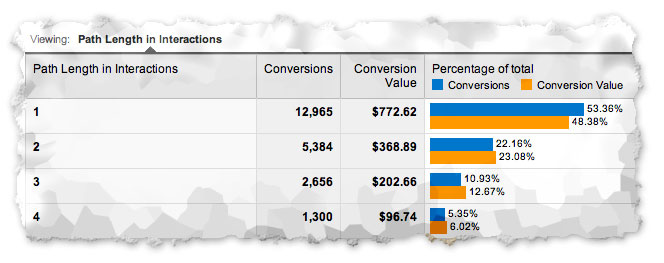
path-length
You can also see the conversion value and the difference between the two, just like in the Time Lag report.
In Conclusion
Multi-Channel Funnels are a major advance in understanding the effect and interactions of your different marketing initiatives.
It is important to be aware that these reports only provide insights for conversions. You must have goals or e-commerce tracking set up in order to take advantage of the reports. You will not be able to use Multi-Channel Funnels for interactions when people do not convert.
The reports do not include View-Through Conversions that is available within AdWords. If a someone sees your Ad but does not click on it they will not be included in these reports.
It is also important to remember that the data you see is only for the last 30 days prior to the conversion. Hopefully this will increase in the future.
Watch our video on Multi-Channel Funnels:
Enjoyed the video? Checkout more Google Analytics videos on our YouTube channel.
Comments