Mapping Customer Journeys in Google Analytics
Benjamin Mangold
Understanding how people engage with your website – from their first interaction to becoming a loyal customer – is essential for improving your marketing strategy and delivering a better user experience. In this guide, we’ll look at how you can use Google Analytics 4 (GA4) to map customer journeys, uncover insights, and drive better results for your business or organization.
GA4’s event-based tracking model and cross-device capabilities provide a detailed view of how people interact with your website or app over time. We’ll walk through the tools and reports you can use to explore user journeys and highlight ways to segment and act on these insights.
Table of Contents
- Why Mapping Customer Journeys Matters
- How GA4 Tracks Customer Journeys
- Exploration Tools for Visualizing Journeys
- Using Segments and Audiences
- Cross-Device and Cross-Platform Tracking
- Final Thoughts
Why Mapping Customer Journeys Matters
Before we explore the features inside GA4, it’s important to understand why mapping journeys matters. In this section, we’ll look at how journey mapping reveals opportunities to refine the user experience and improve the performance of your marketing initiatives.
When you understand how people move through your website, you can spot where they drop off and what encourages them to convert. This lets you improve navigation, refine your messaging, and deliver a better experience.
How GA4 Tracks Customer Journeys
This section outlines how GA4 structures your data to help you understand user journeys. We’ll cover the event-based model, explain users, sessions, and events, and walk through how cross-device tracking works.
Event-Based Tracking in GA4
GA4 uses an event-based model, which means that everything a user does – from viewing a page to completing a form – is tracked as an event. This model gives you more flexibility than the old session-based approach and lets you collect detailed interaction data over time.
Sessions, Users, and Events – What's the Difference?
It’s important to understand the building blocks of GA4 data:
- User: A person who visits your website.
- Session: A group of interactions that happen within a specific time frame.
- Event: An individual interaction, like a page view or click.
GA4 automatically calculates and presents these metrics, giving you a clearer picture of user behavior across sessions and devices. You will also find some of the standard preconfigured reports focus on one of these building blocks. For example, the Traffic Acquisition report focuses on users-based metrics, so you can understand which marketing channels are driving new users to your website.
Cross-Platform and Cross-Device Tracking
One of GA4’s strengths is its ability to track users across platforms and devices. If someone logs in on your app and later visits your website on desktop, GA4 can stitch that journey together – as long as you've implemented user_id for your identified users. This is particularly helpful for ecommerce, memberships, and apps where users interact across different devices.
Exploration Tools for Visualizing Journeys
Exploration reports let you create custom reports so you can dive deeper into user behavior. In this section, we’ll look at Path Exploration, Funnel Exploration, User Explorer, and Engagement Reports to help you analyze how users move through your site.
Path Exploration
Path Exploration in the Explore section lets you see how users move from one event or page to the next. You can start from a particular event (like a page view or add-to-cart) and map out where users go next.
In the following example, the starting point has been set to the '/shop/apparel' page. Then the '/' page has been selected, so you can see how people move from the apparel page, to the homepage, and then view additional pages on the website.
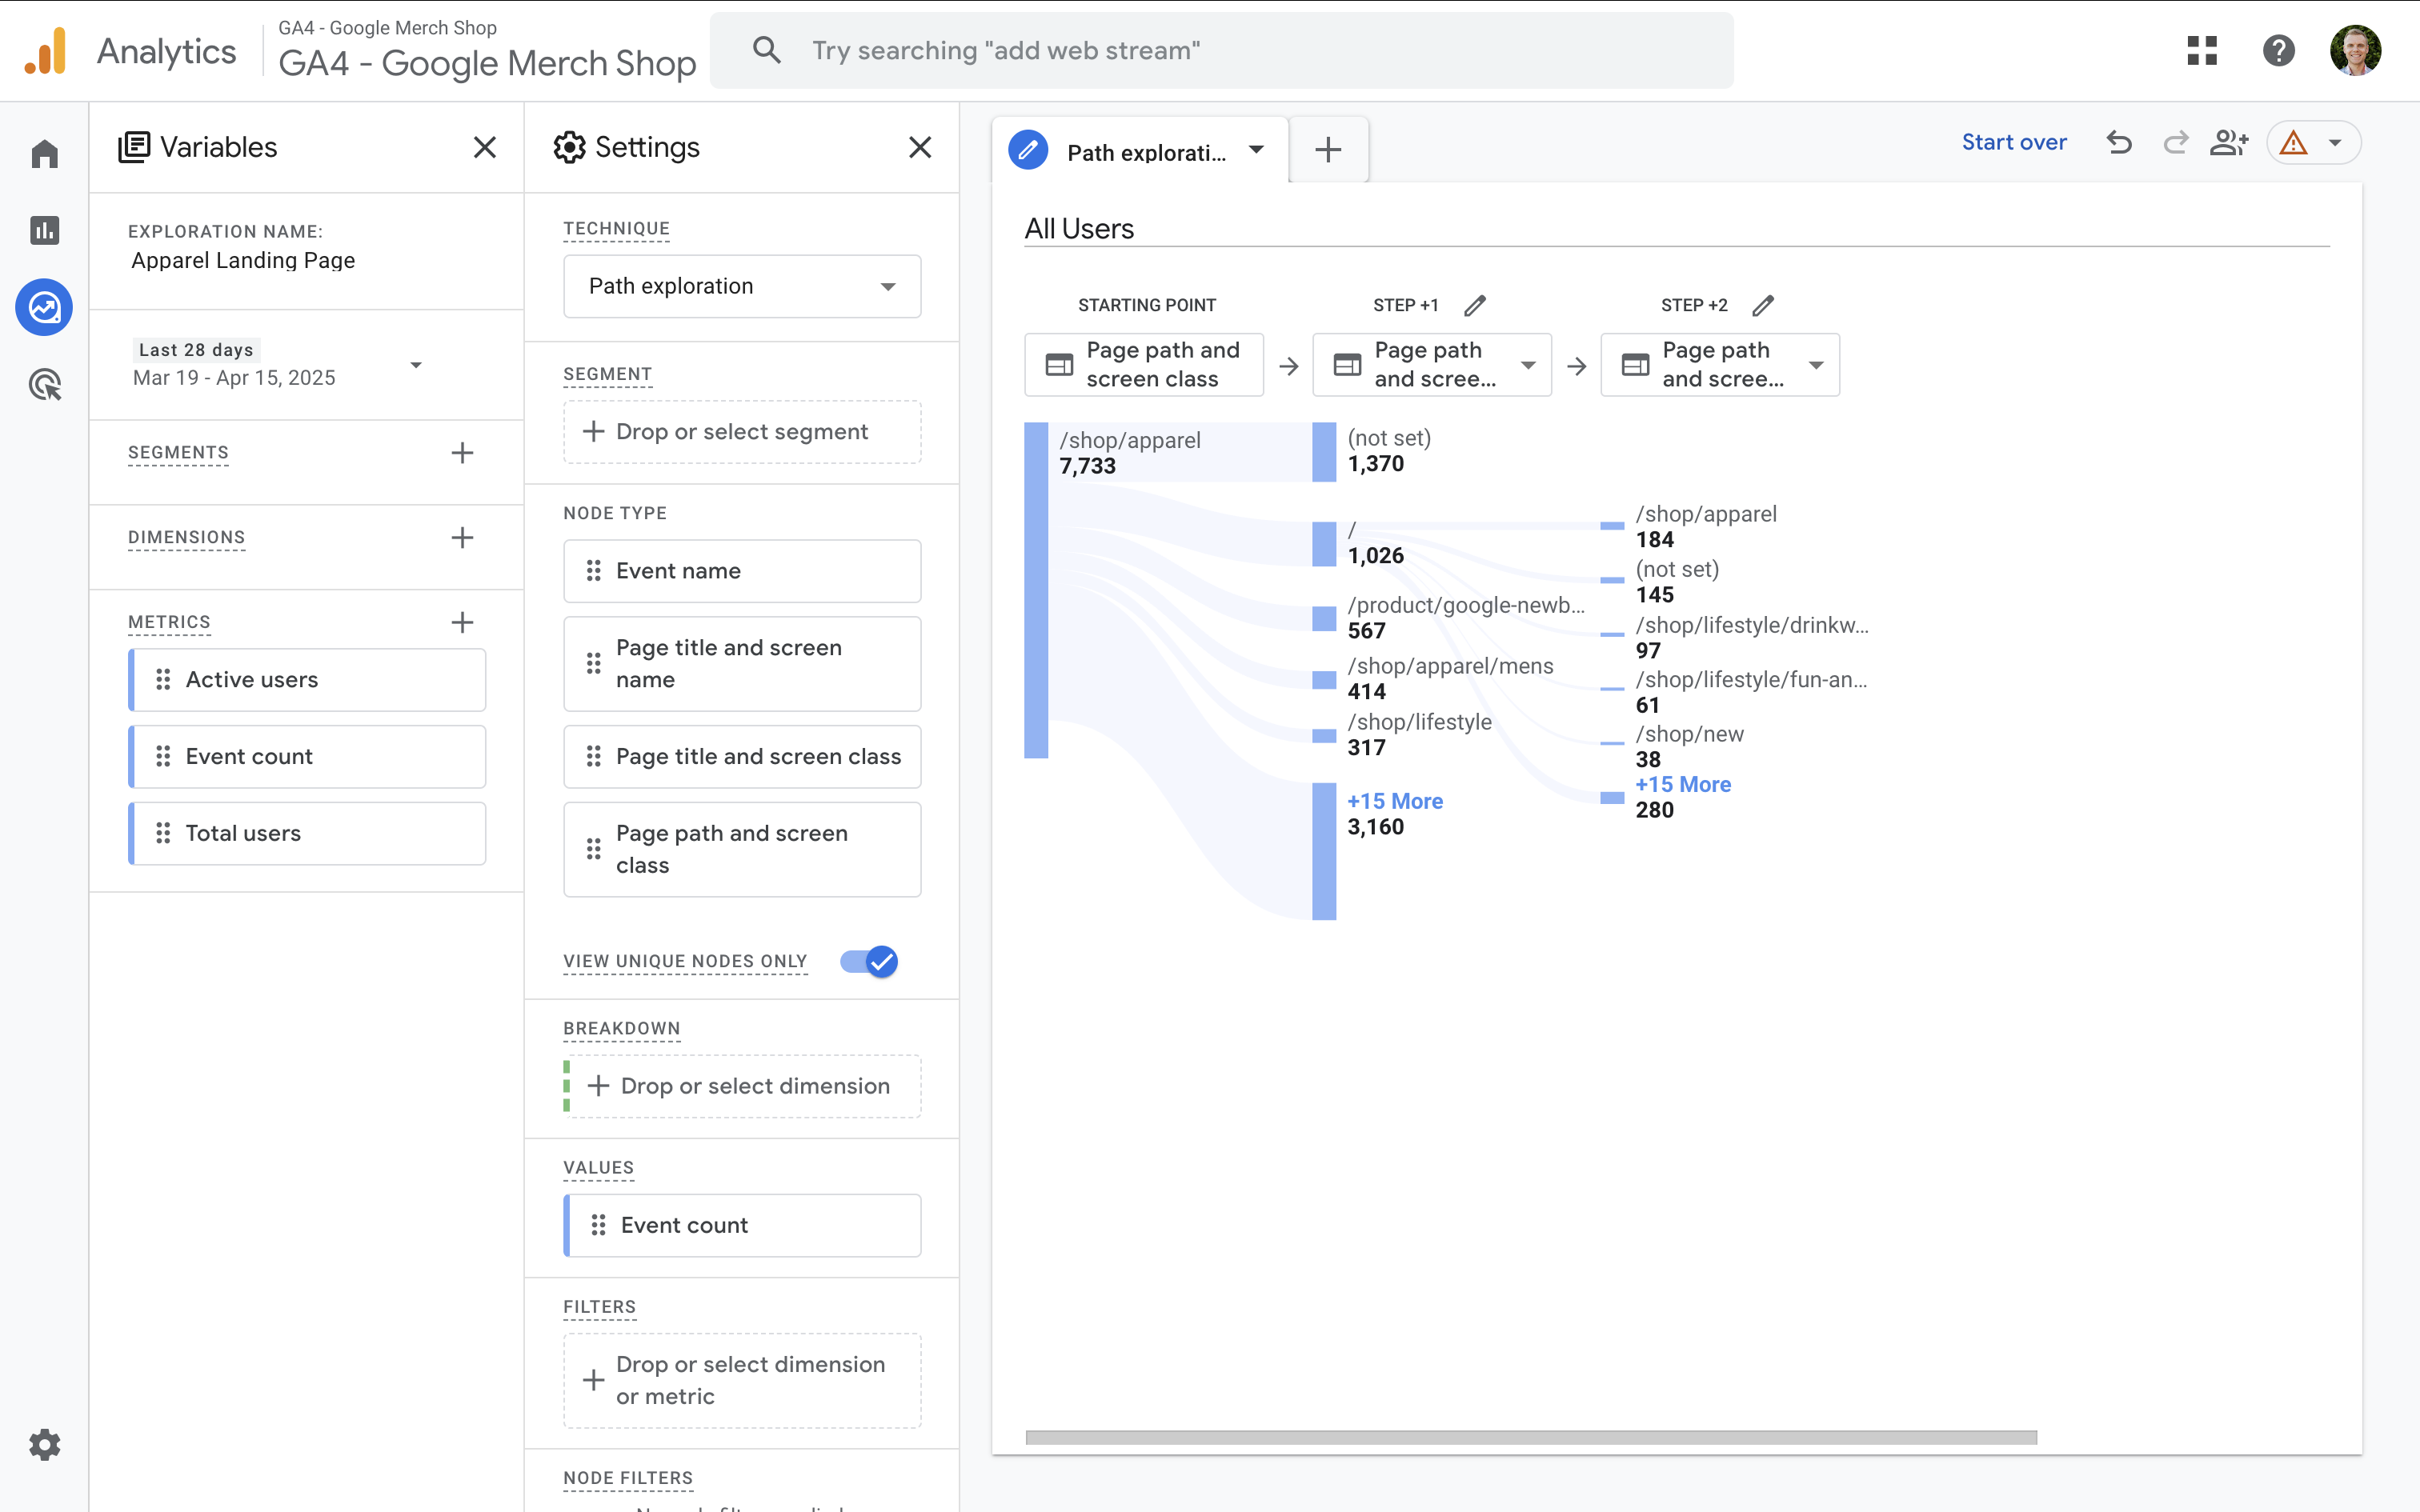
The Path Exploration report is useful for spotting unexpected behavior, identifying high-exit pages, and improving your user flow.
Funnel Exploration
Use Funnel Exploration to build goal-based funnels and measure how many users complete each step. For example, you might track:
- Product page view
- Add to cart
- Begin checkout
- Purchase
But funnels aren’t just for ecommerce. For example, if you're offering a downloadable resource, your funnel might include:
- Landing page view
- Form view
- Form submission
- Download event
The following Funnel Exploration report has been configured to show how many people move from viewing a page, to scrolling a page, to selecting a promotion on the website:
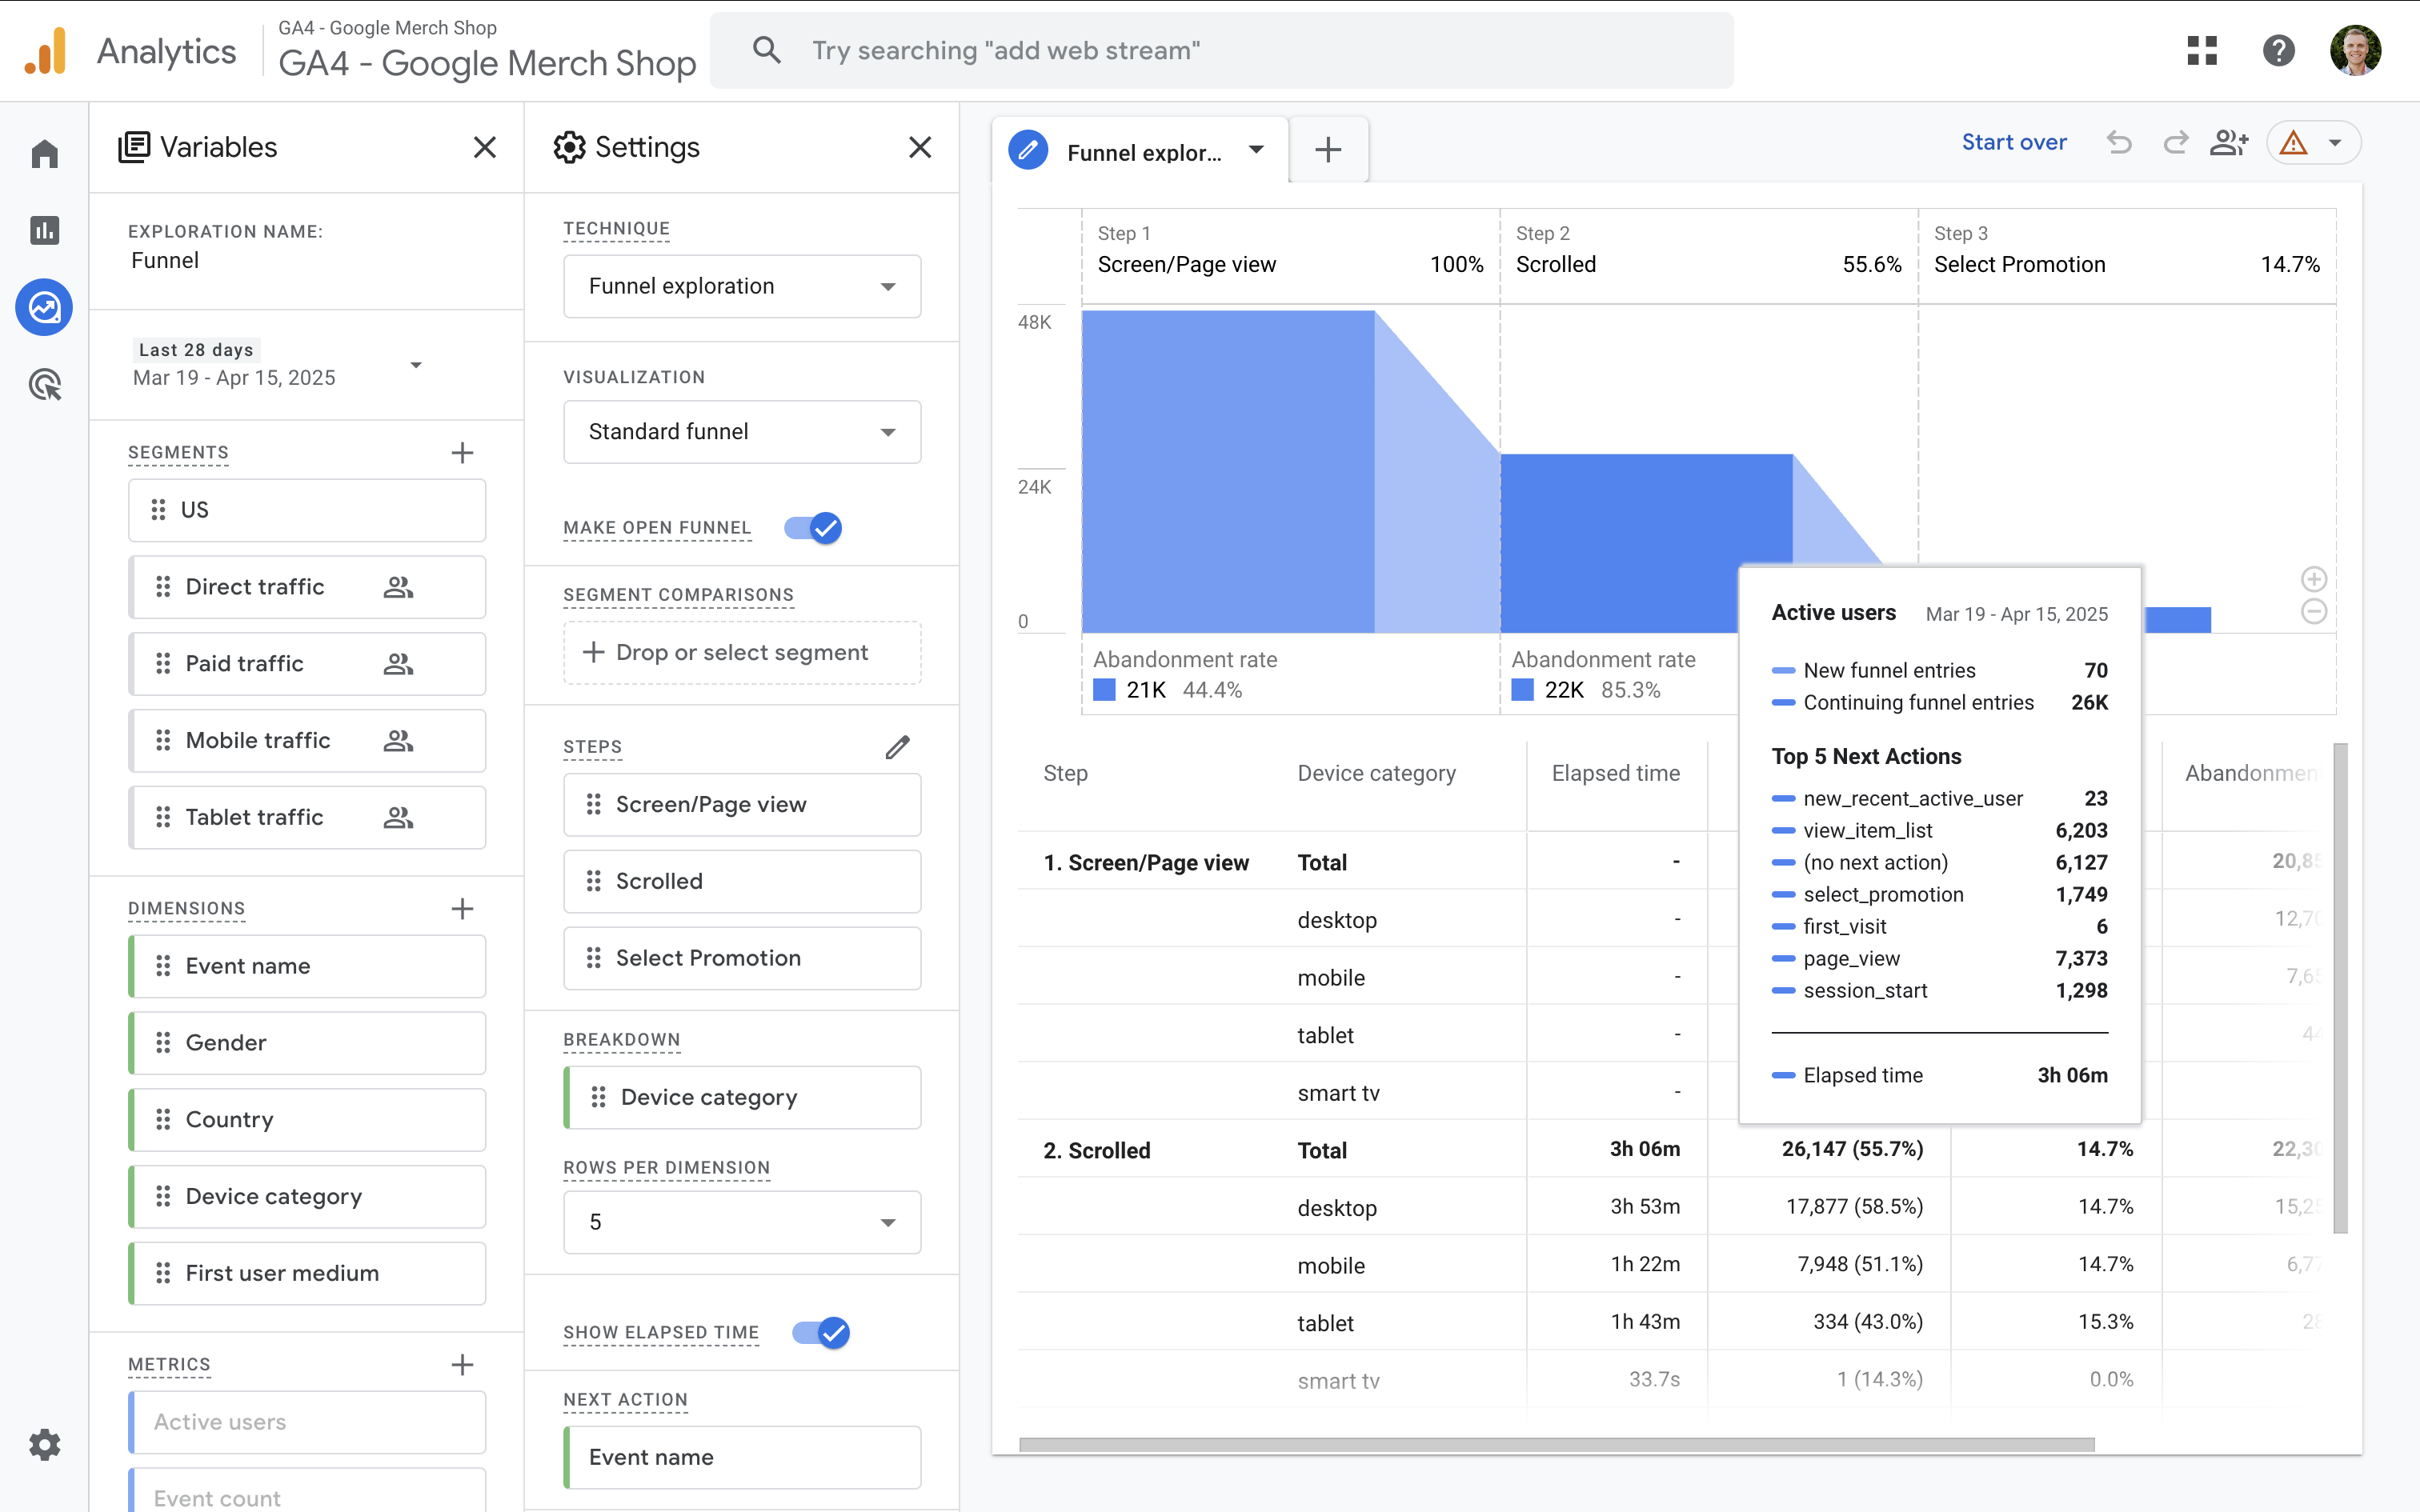
GA4 shows drop-off rates between each step so you can identify where users are exiting and make improvements.
Tips for Analyzing Drop-Offs
If you're seeing a high drop-off at checkout, it might indicate issues with your payment process or trust signals. Try testing different call-to-actions, improving load times, or simplifying forms to increase completions.
User Explorer
The User Explorer report allows you to look at individual user journeys. You can see how a single user interacted with your website over time, including events like purchases, video views, and clicks. It’s especially useful when paired with the User ID feature which we will cover in a moment.
Engagement Reports
To find the standard preconfigured engagement reports, navigate to 'Reports' and select 'Engagement'. In these reports you will see metrics like:
- Engaged sessions: sessions that lasted at least 10 seconds, included a key event (to report on a conversion), or included two or more page views.
- Engagement rate: shows the percentage of engaged sessions. For example, a page with a higher engagement rate shows that people are more interested in that content compared to pages with a lower engagement rate.
- Average engagement time per session: shows the average amount of time people are engaged during their session. Whether you aim for a lower or higher average engagement time will depend on the particular page you're analyzing. For example, if you want people to convert quickly you might aim for a lower average engagement time, but if you want people to read a long piece of content you would aim for a longer engagement time.
The engagement reports and engagement metrics help you understand what content keeps people interested and what might be underperforming. This can provide useful insights to inform what content your create next and which pieces of existing content should be reviewed and tweaked.
Traffic and Acquisition Reports
Navigate to 'Reports' and then 'Acquisition' to view reports that tell you how people find your website. The reports allow you to understand how your marketing channels perform, whether it's organic search, paid ads, social media, or other channels. These reports also show metrics like engaged sessions, key events (for conversions), and revenue per source.
Tip: Try adding comparisons by device, campaign, or source to uncover patterns in user behavior.
Purchase Journey and Checkout Journey Reports
GA4 includes preconfigured reports specifically designed to help you analyze ecommerce performance. The Purchase Journey report provides insights into the steps users take before completing a purchase. Similarly, the Checkout Journey report focuses on the different stages of your checkout process.
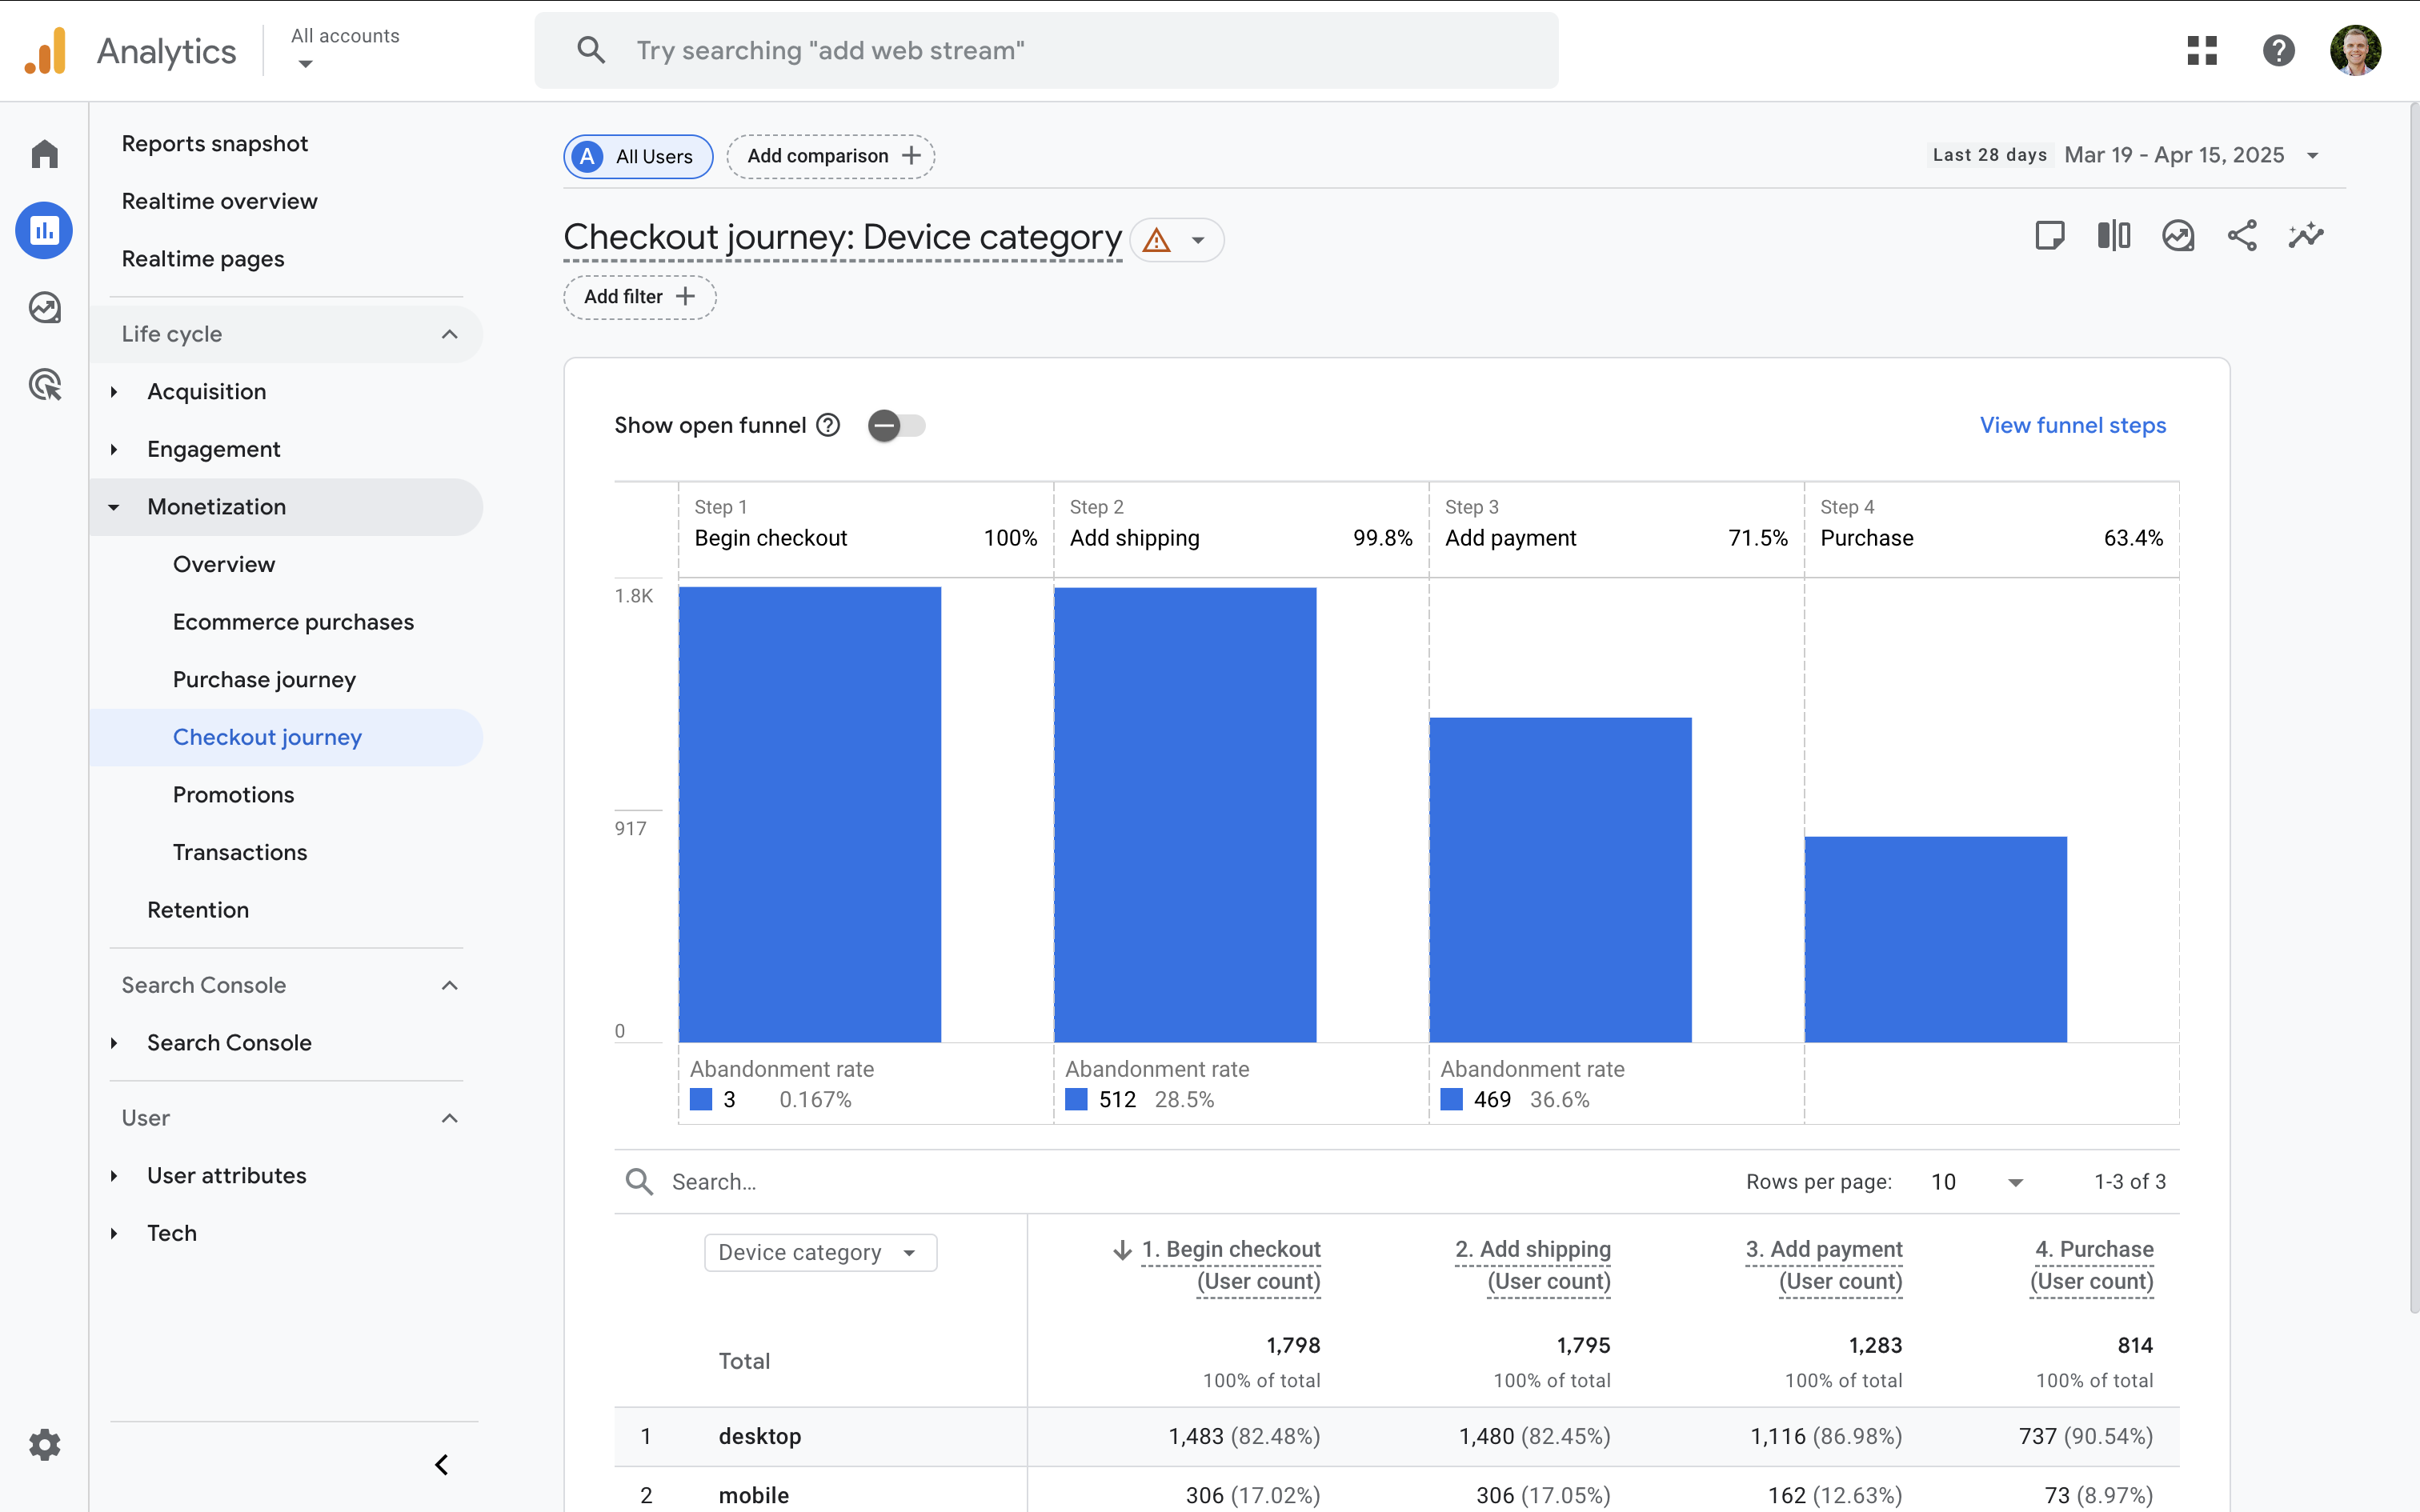
Both reports can help you pinpoint drop-offs and identify opportunities to improve the user experience and increase conversions. These reports are found in the 'Monetization' section under 'Reports'.
Using Segments and Audiences
In this section, we’ll explore how to create behavior-based audiences and use comparisons to uncover different journey patterns for different types of users. These tools help you tailor marketing efforts and personalize experiences for your most valuable segments.
Behavior-Based Audiences
You can create audiences based on behavior, such as users who:
- Viewed a product but didn’t purchase
- Visited your pricing page multiple times
- Completed a specific event (like signing up)
Audiences like these can be used for remarketing campaigns, building custom funnels, or creating comparisons inside reports. You can define conditions using dimensions, events, or predictive metrics like purchase probability. For example, you could create an audience of users with high engagement but no conversions and experiment with messaging that encourages action.
Using Comparisons to Explore Paths
Use the Compare feature in standard reports to analyze how different groups of users behave. For example, compare:
- New vs returning users
- Mobile vs desktop users
- Users from different campaigns or traffic sources
Comparisons help you understand how different audience segments interact with your content and where their journeys differ. This can highlight opportunities to tailor content, optimize the experience, or segment conversion goals. You can apply comparisons in standard reports.
Cross-Device and Cross-Platform Tracking
GA4 makes it easier to understand how users interact with your website or app across different devices. In this section, we’ll look at how to enable User ID, unify sessions, and compare device-based with user-based tracking.
Enabling User ID
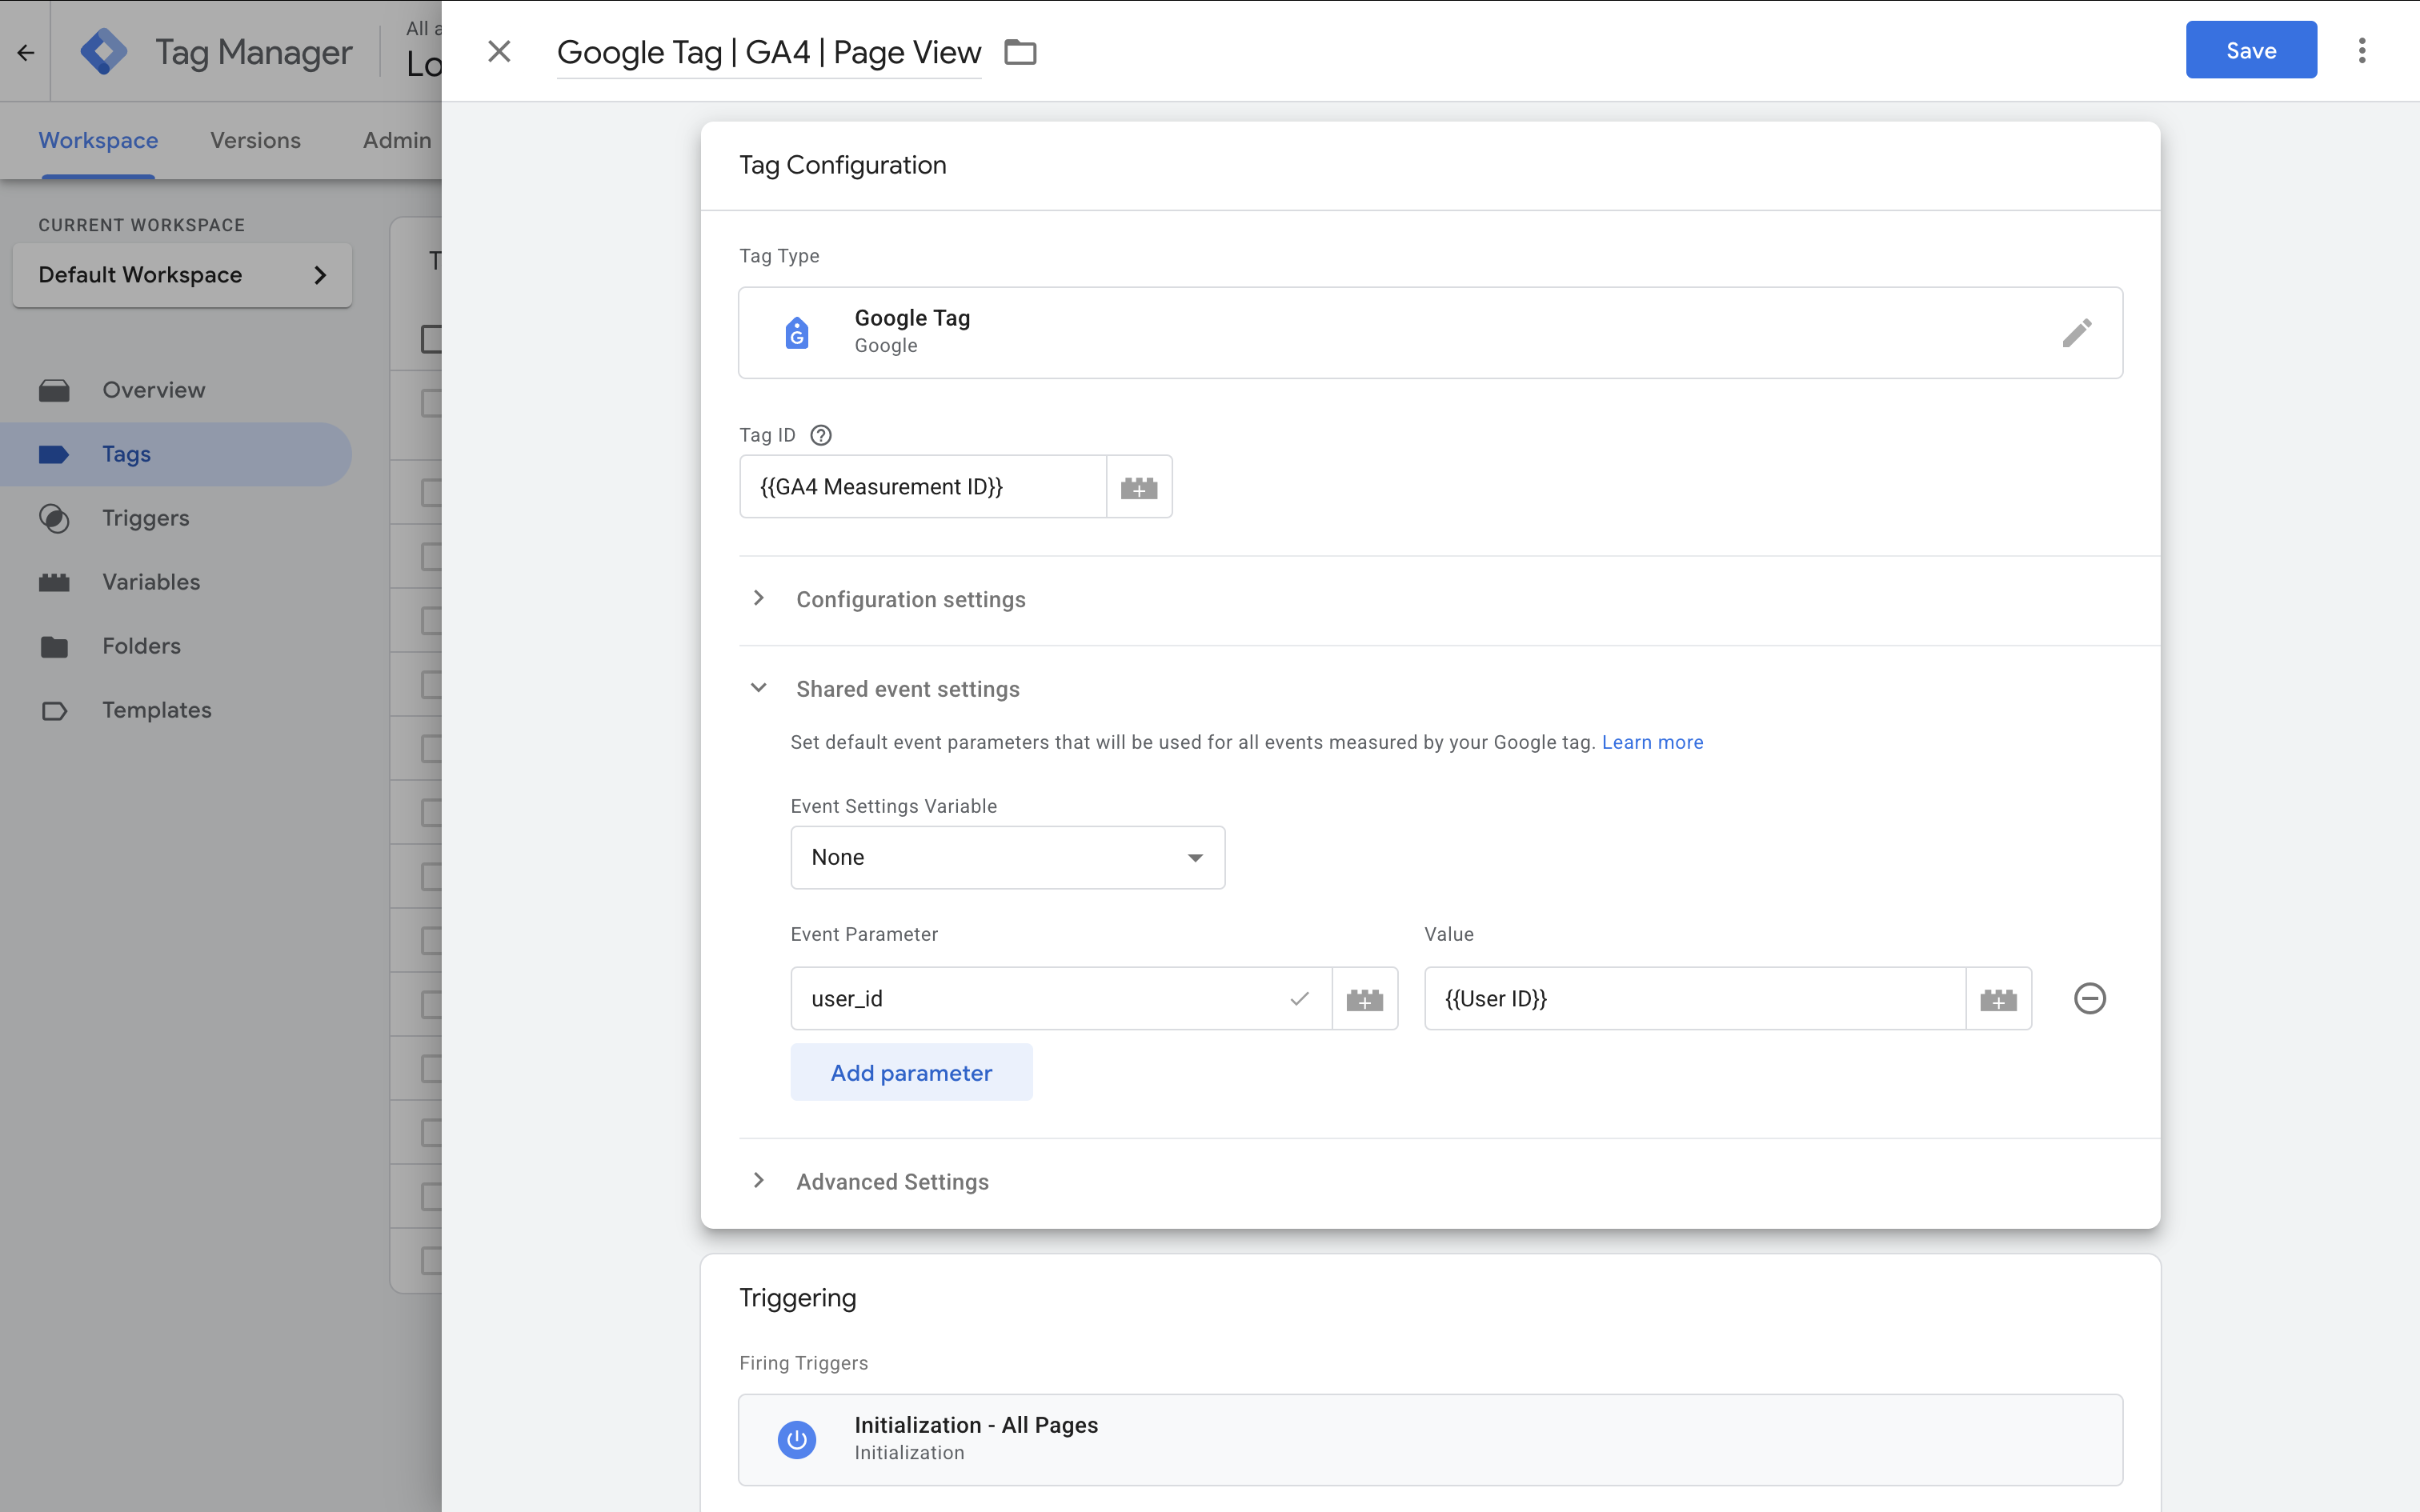
If you have a way to identify individuals when they access your website or app, then you should consider implementing User ID. To do this, you will need a way to identify people, for example, if people sign in to access a members section on your website. You can then connect your back-end system with your tracking code to pass IDs to Google Analytics.
To track users across devices, you need to implement the user_id parameter. Once IDs for your users are being collected, Google Analytics can use these to unify sessions from different devices under a single user. Here is an example of a Google Tag in Google Tag Manager that has been configured to send User IDs to GA4:
Device-Based vs User-Based Analysis
Device-based analysis can be helpful for UX improvements, but user-based analysis provides the full picture. For example, someone might browse your website on mobile but complete a purchase on desktop. With User ID enabled, GA4 can link those actions together.
Final Thoughts
GA4 gives you powerful tools to track and analyze how people engage with your website or app. From funnel and path exploration to detailed engagement reports and cross-device tracking – everything is designed to help you understand your customer journey more clearly.
By applying these insights, you can improve your user experience, increase conversions, and make more informed marketing decisions.
Want to get the most out of GA4? When you're ready to learn even more about configuration options, using your reports, and making your data actionable, you can join our courses. Our Google Analytics course will take you from fundamentals to advanced features and help you get the most out of your data.
Comments