Identify your most valuable audience members with Google Analytics
Loves Data
This simple guide is part of our Analytics Challenge.
The ‘User’ and exploration reports in Google Analytics can tell you all about who is visiting your website. You can then focus on different metrics depending on your objectives and priorities to understand relative performance. For example, you might want to use ecommerce metrics, conversion metrics, engagement metrics, or a combination to identify your most valuable audience members.
Tip: To use the reports we’re about to look at, you will need to ensure Google Signals is enabled in your Google Analytics property. To do this, navigate to ‘Admin’ and select ‘Data Collection and Modification’ in the sub-menu. Then select ‘Data Collection’. You can then check the Google Signals configuration.
Are there any age ranges that are more likely to convert?
You can view the age ranges of your users by navigating to ‘Reports’, then ‘User Attributes’, and changing the default dimension to ‘Age’. Apart from the pre-configured report, you can also create an exploration report that includes the ‘Age’ dimension.
The following example is a custom exploration report that combines the ‘Age’ dimension with ‘Active Users’, ‘Sessions’, and ‘User Conversion Rate’ metrics:
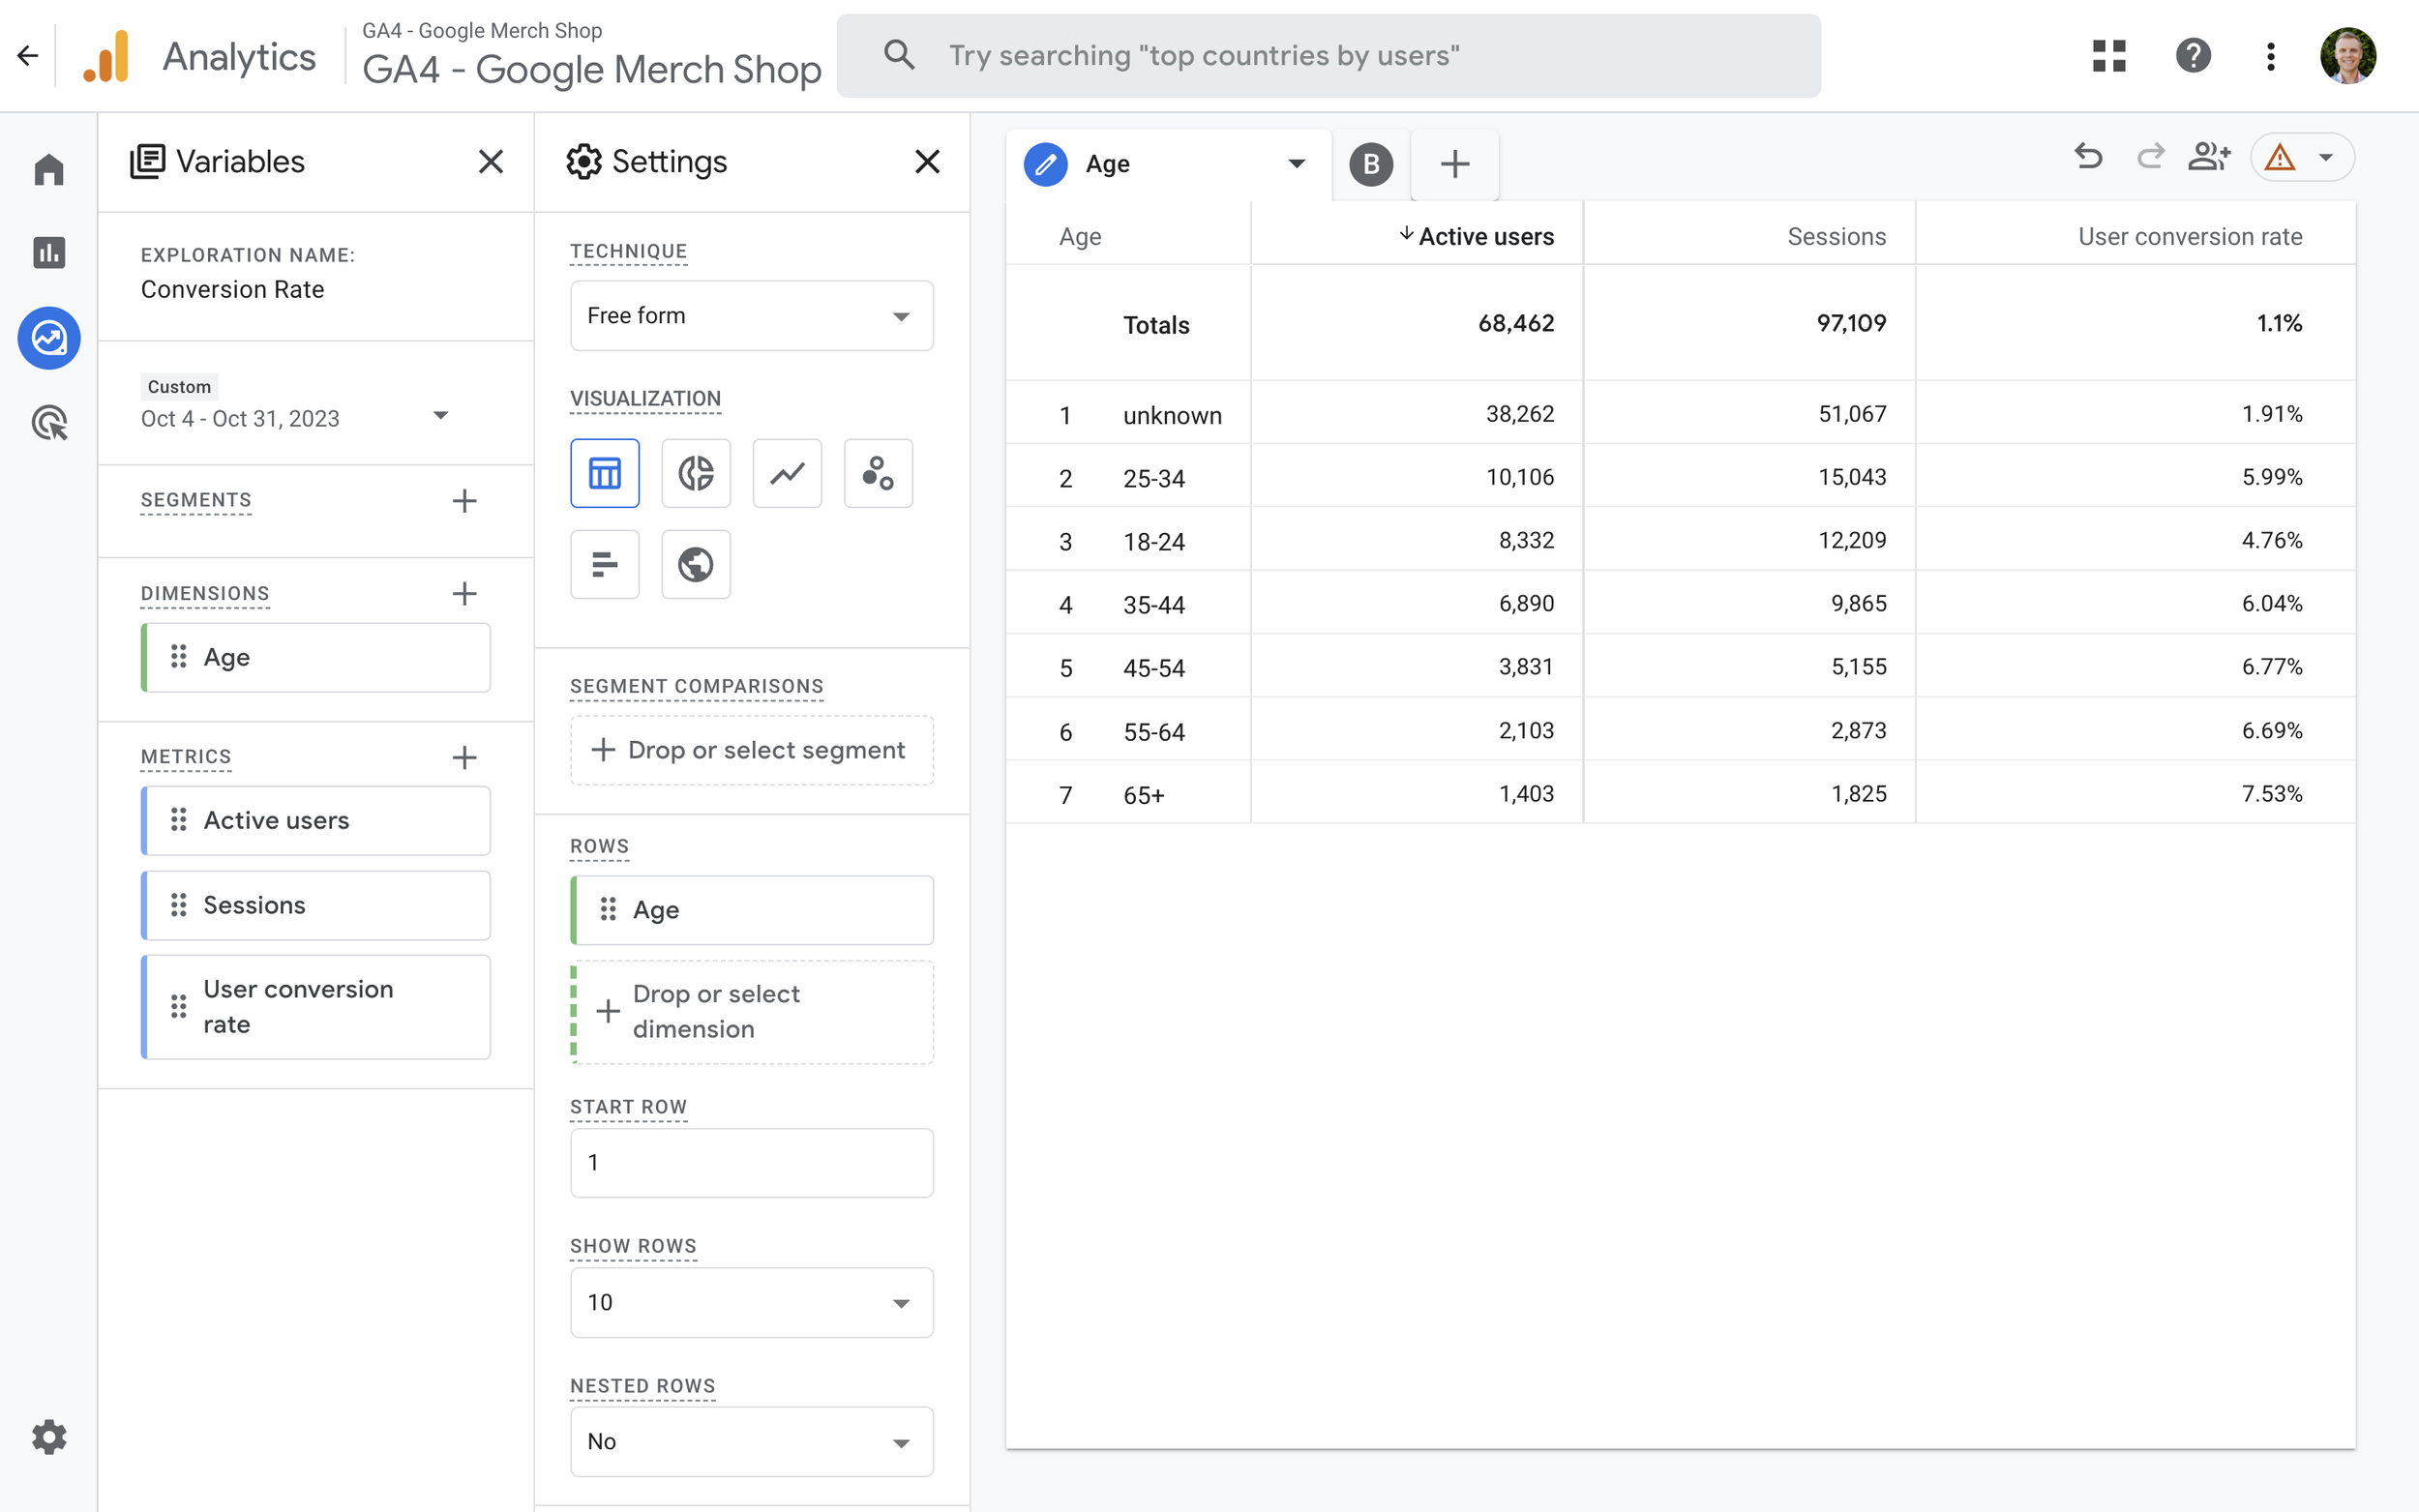
Since we’ve included a conversion rate metric in the exploration report, we can look for age ranges that have a higher-than-expected conversion rate. In the example above, the average user conversion rate is 1.10%, but we can identify age ranges that have higher-than-expected conversion rates.
Are people With Specific Interests more likely to convert?
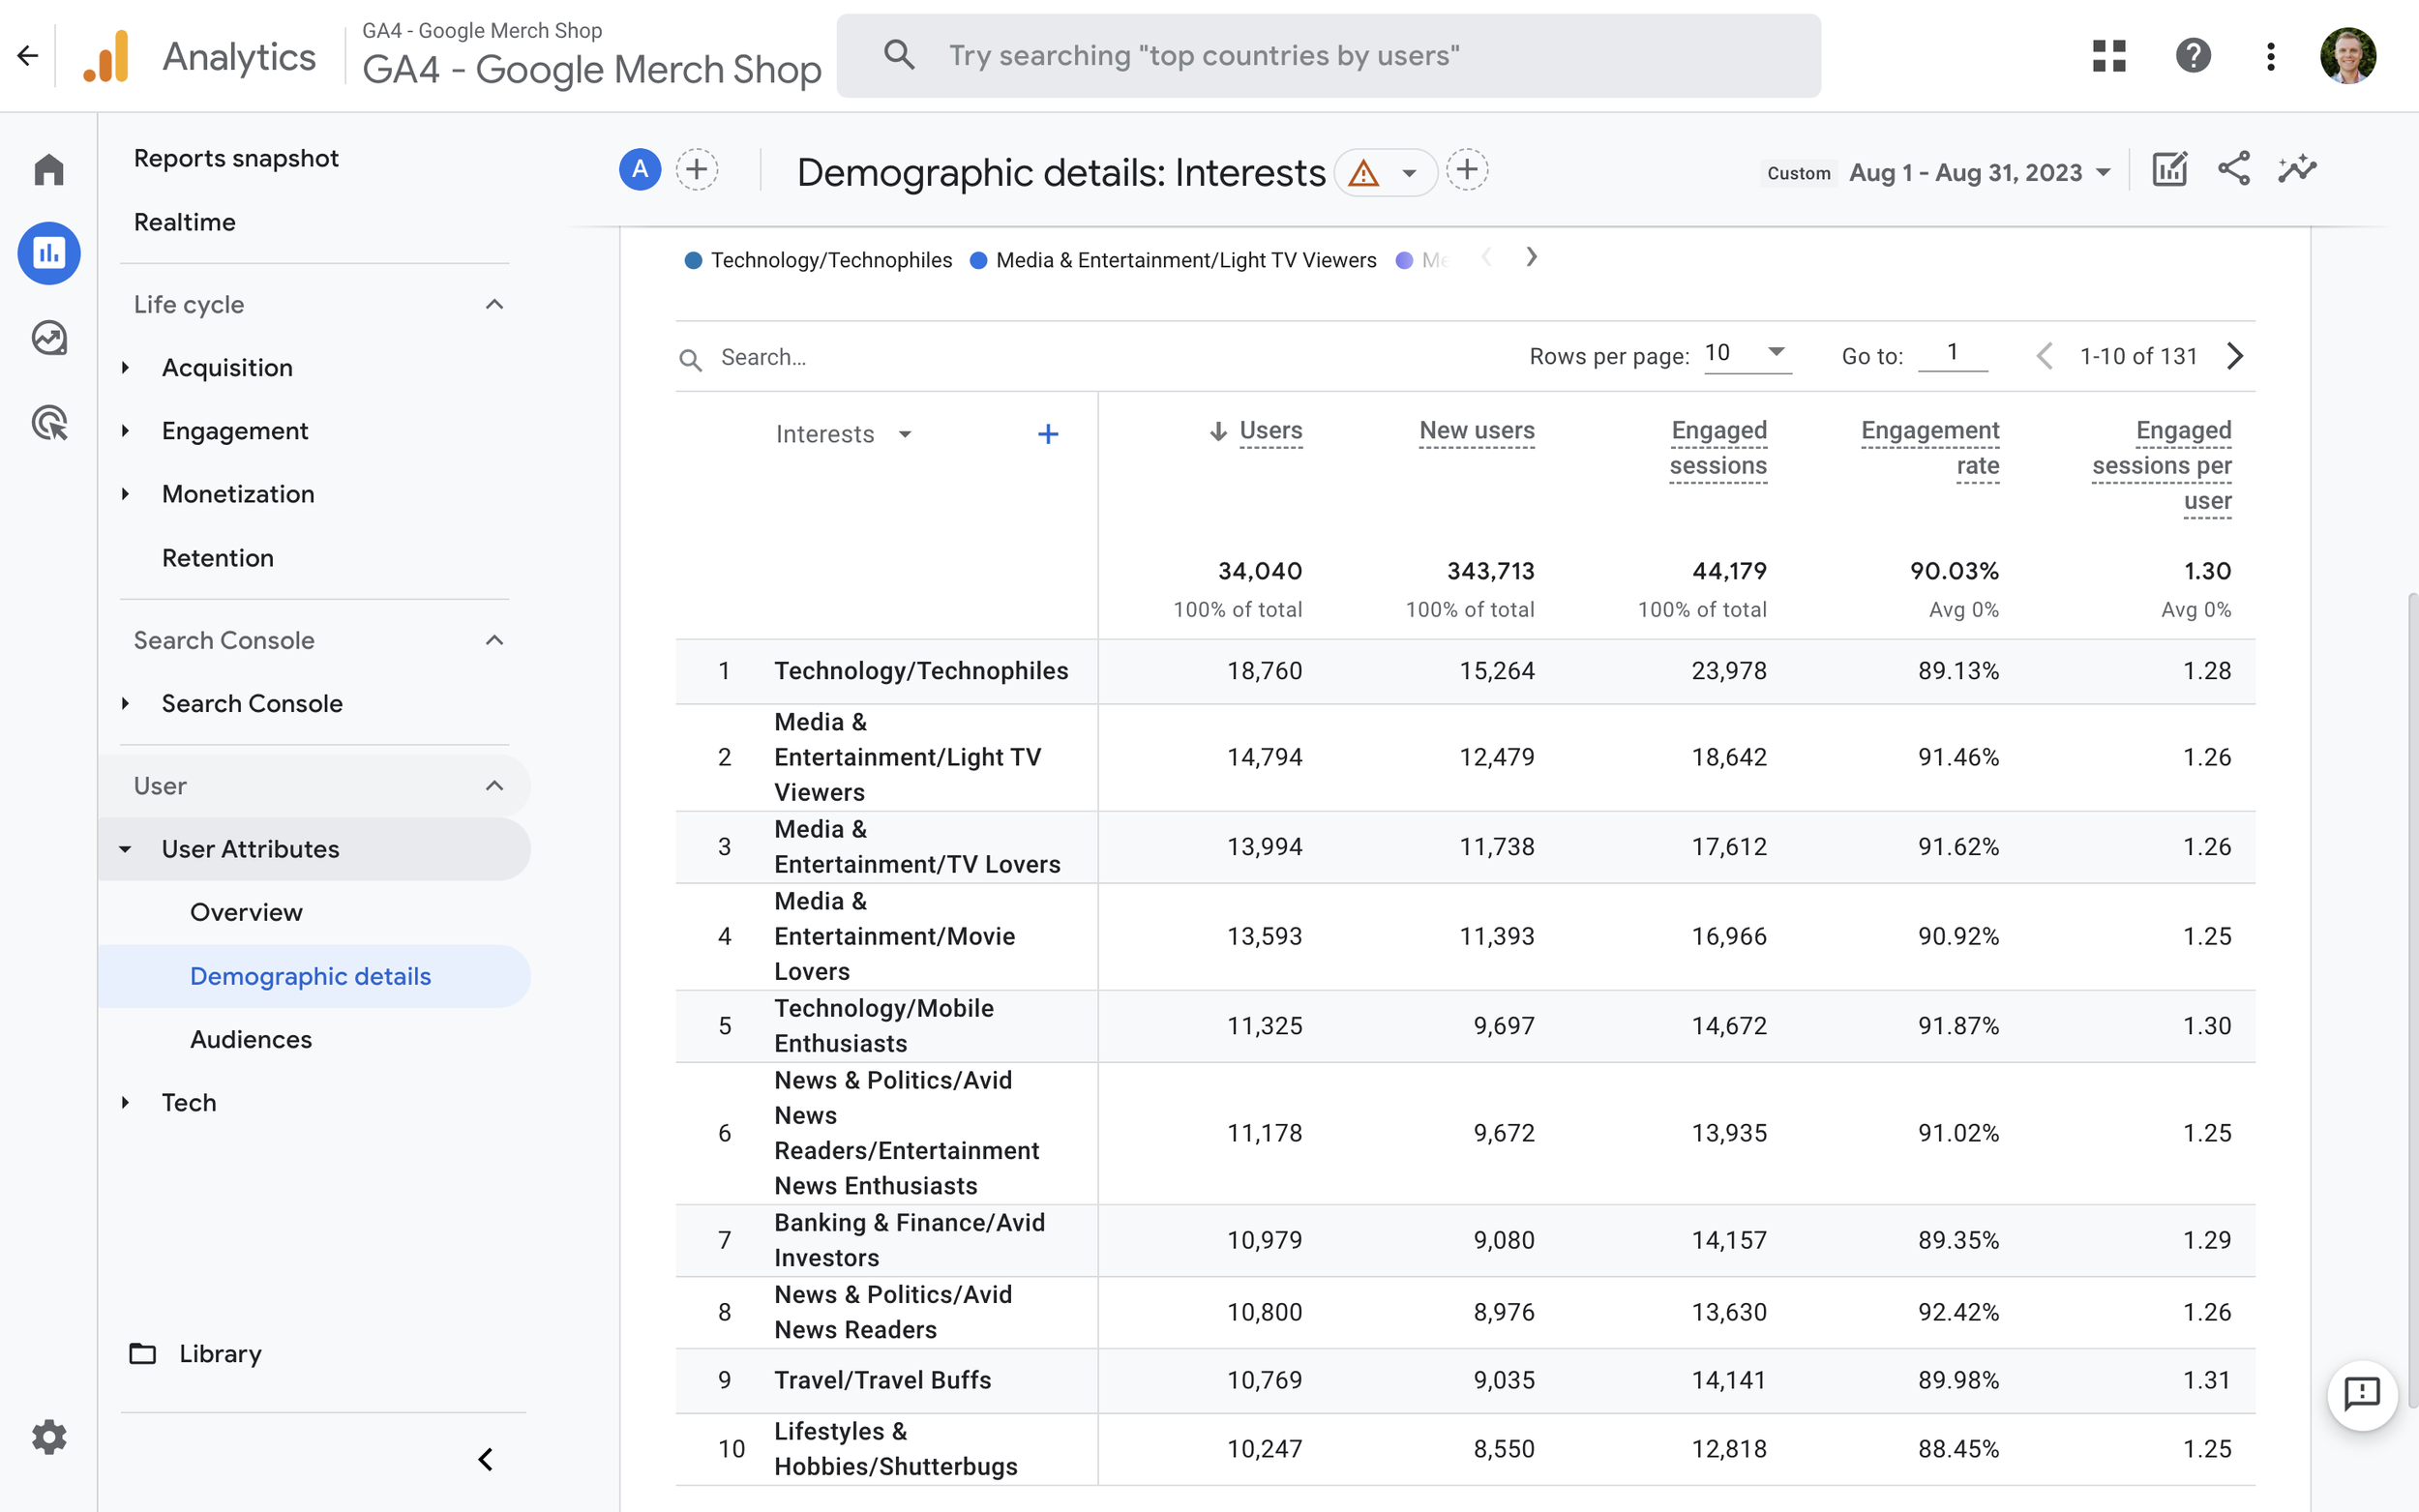
Google Analytics lets you view people’s areas of interest. To view interests, navigate to ‘Reports’, then ‘User Attributes’, and open the ‘Demographic Details’ report. You can then change the default dimension to ‘Interests’. The report will now show you the areas of interest for your users. Here’s an example of the report:
Are there locations that have a higher-than-expected Value?
You probably already know the geographic location of your customers, but are there any locations that lead to higher-than-expected revenue? Or another conversion metric if you’re not selling online? To find out, navigate to ‘Reports’, then ‘User Attributes’, open the ‘Demographic Details’ report and use one of the geographic dimensions.
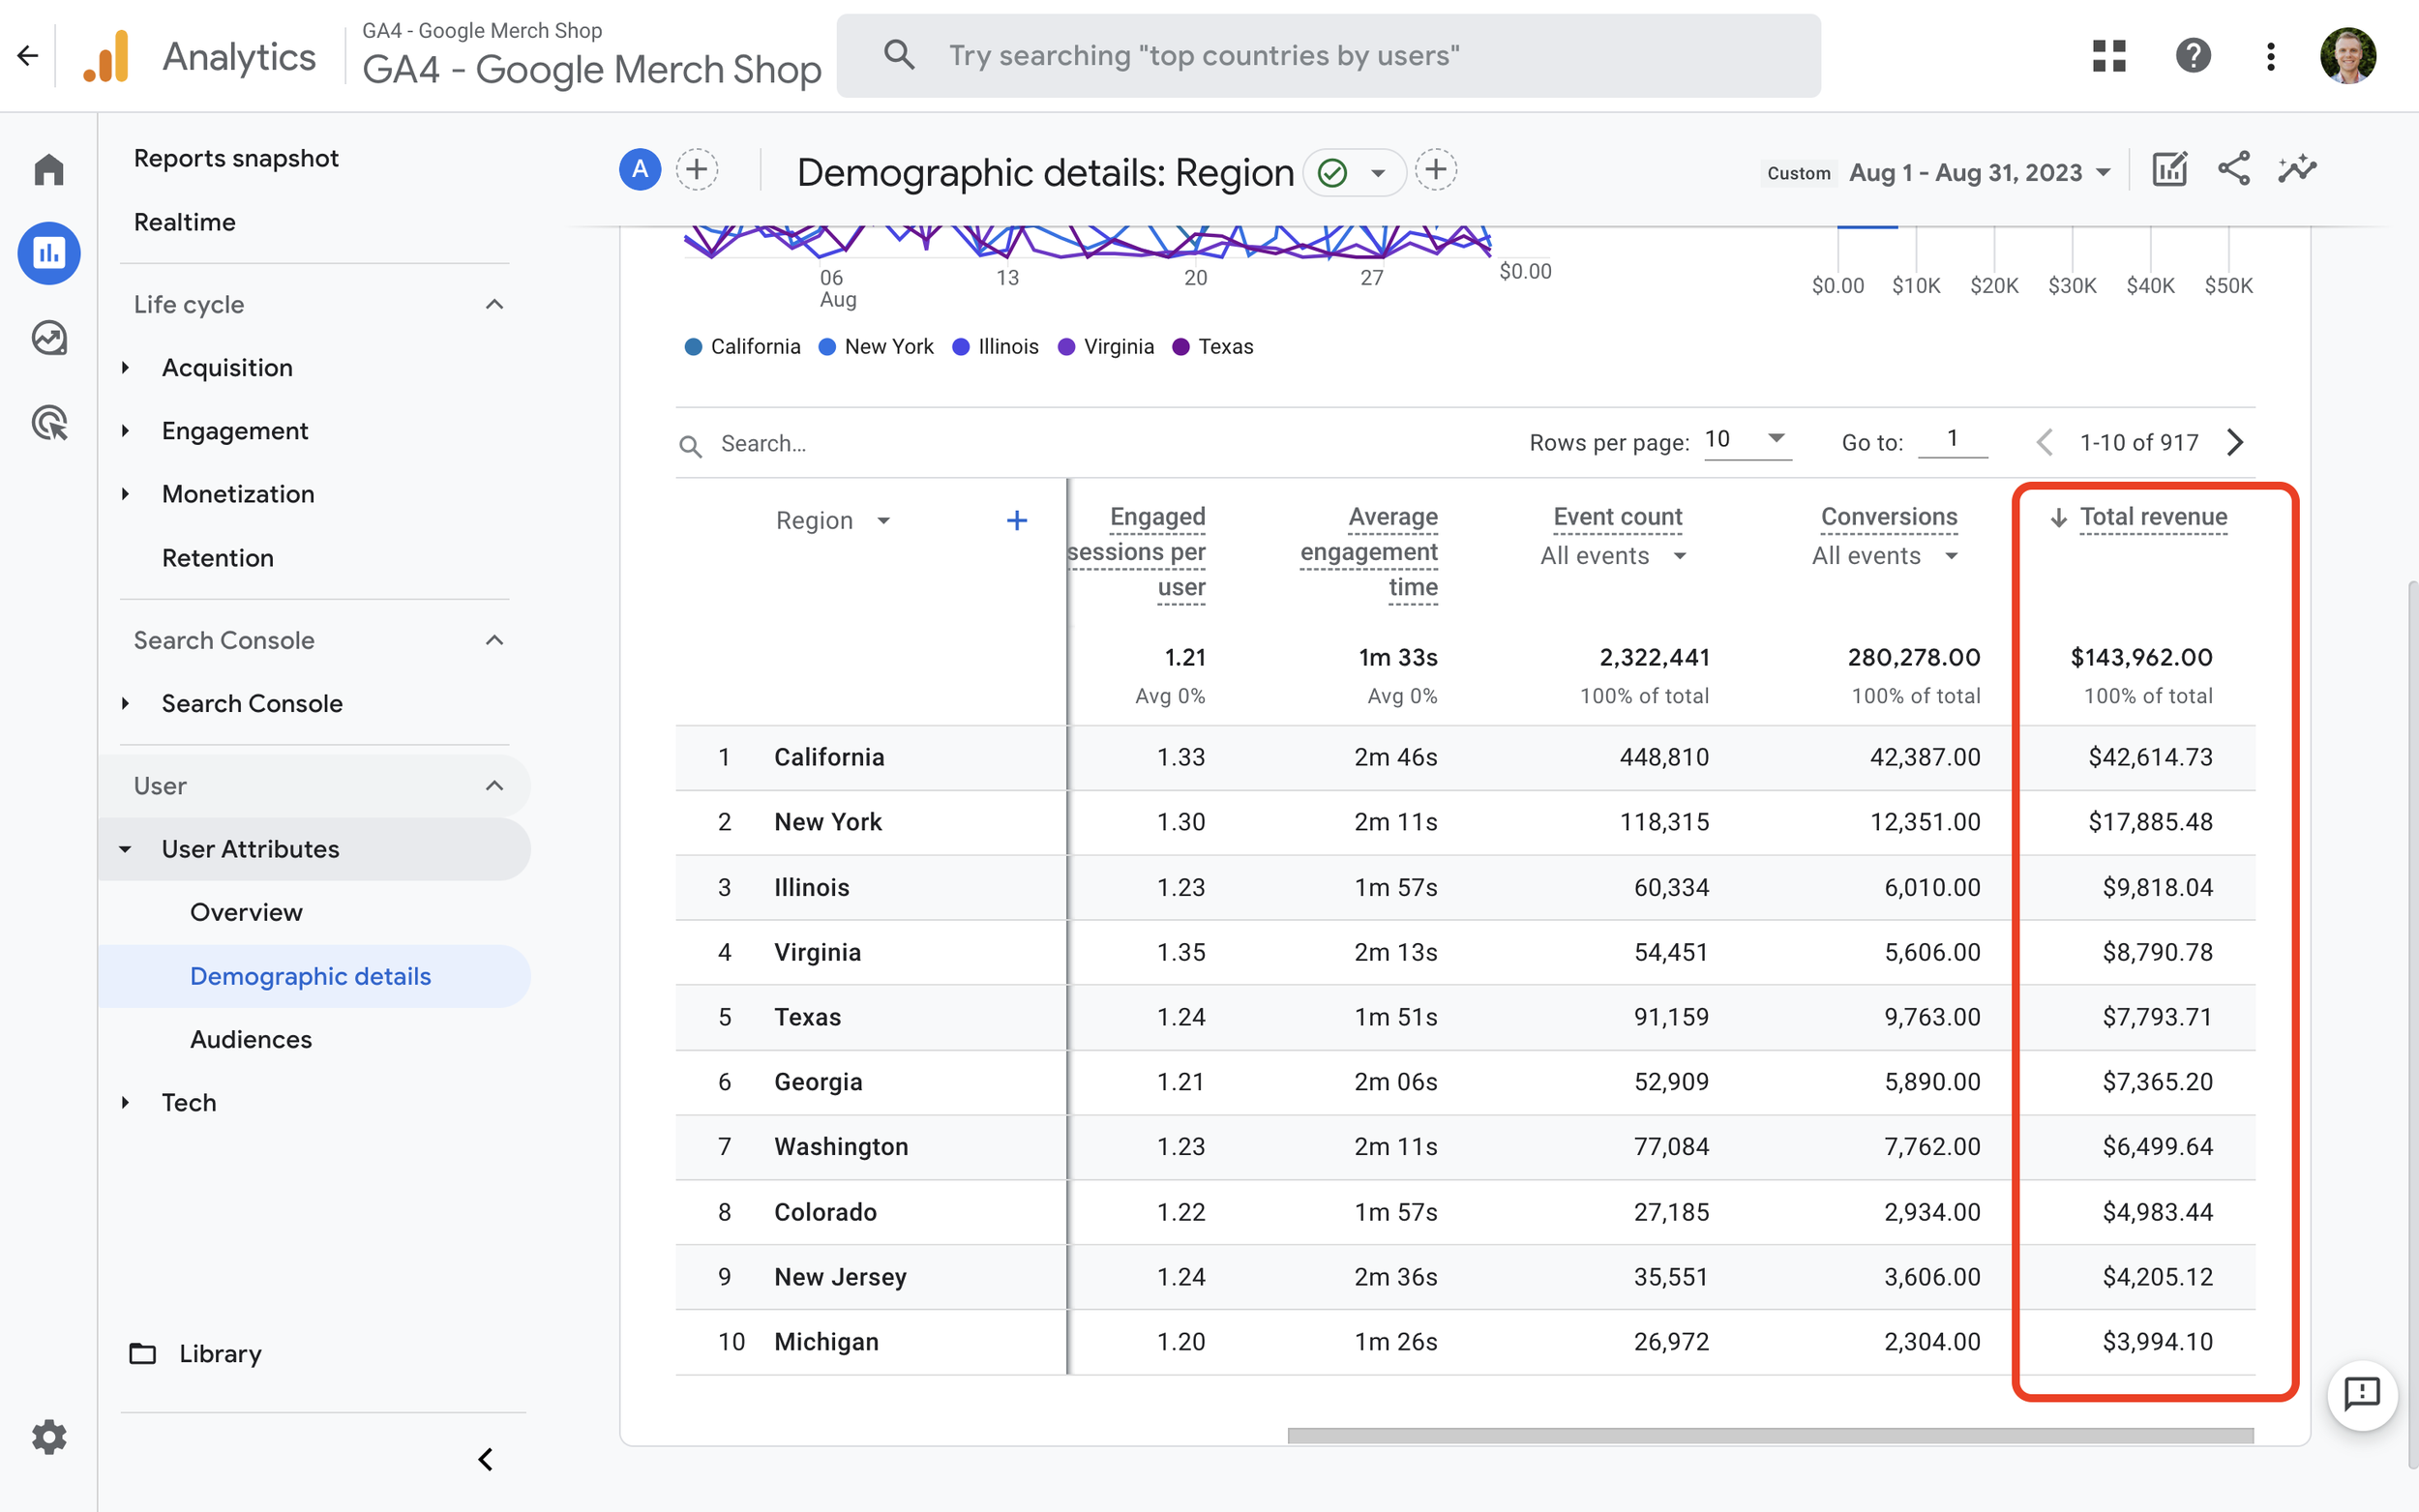
By default, the report will group users by country, but you can change the dimension to ‘Region’ or ‘City’ using the drop-down above the table.
Are mobile, tablet, or desktop users more likely to convert?
Navigate to ‘Reports’, then ‘Tech’, and open the ‘Overview’ report. This report focuses on the different devices people are using to view your website.
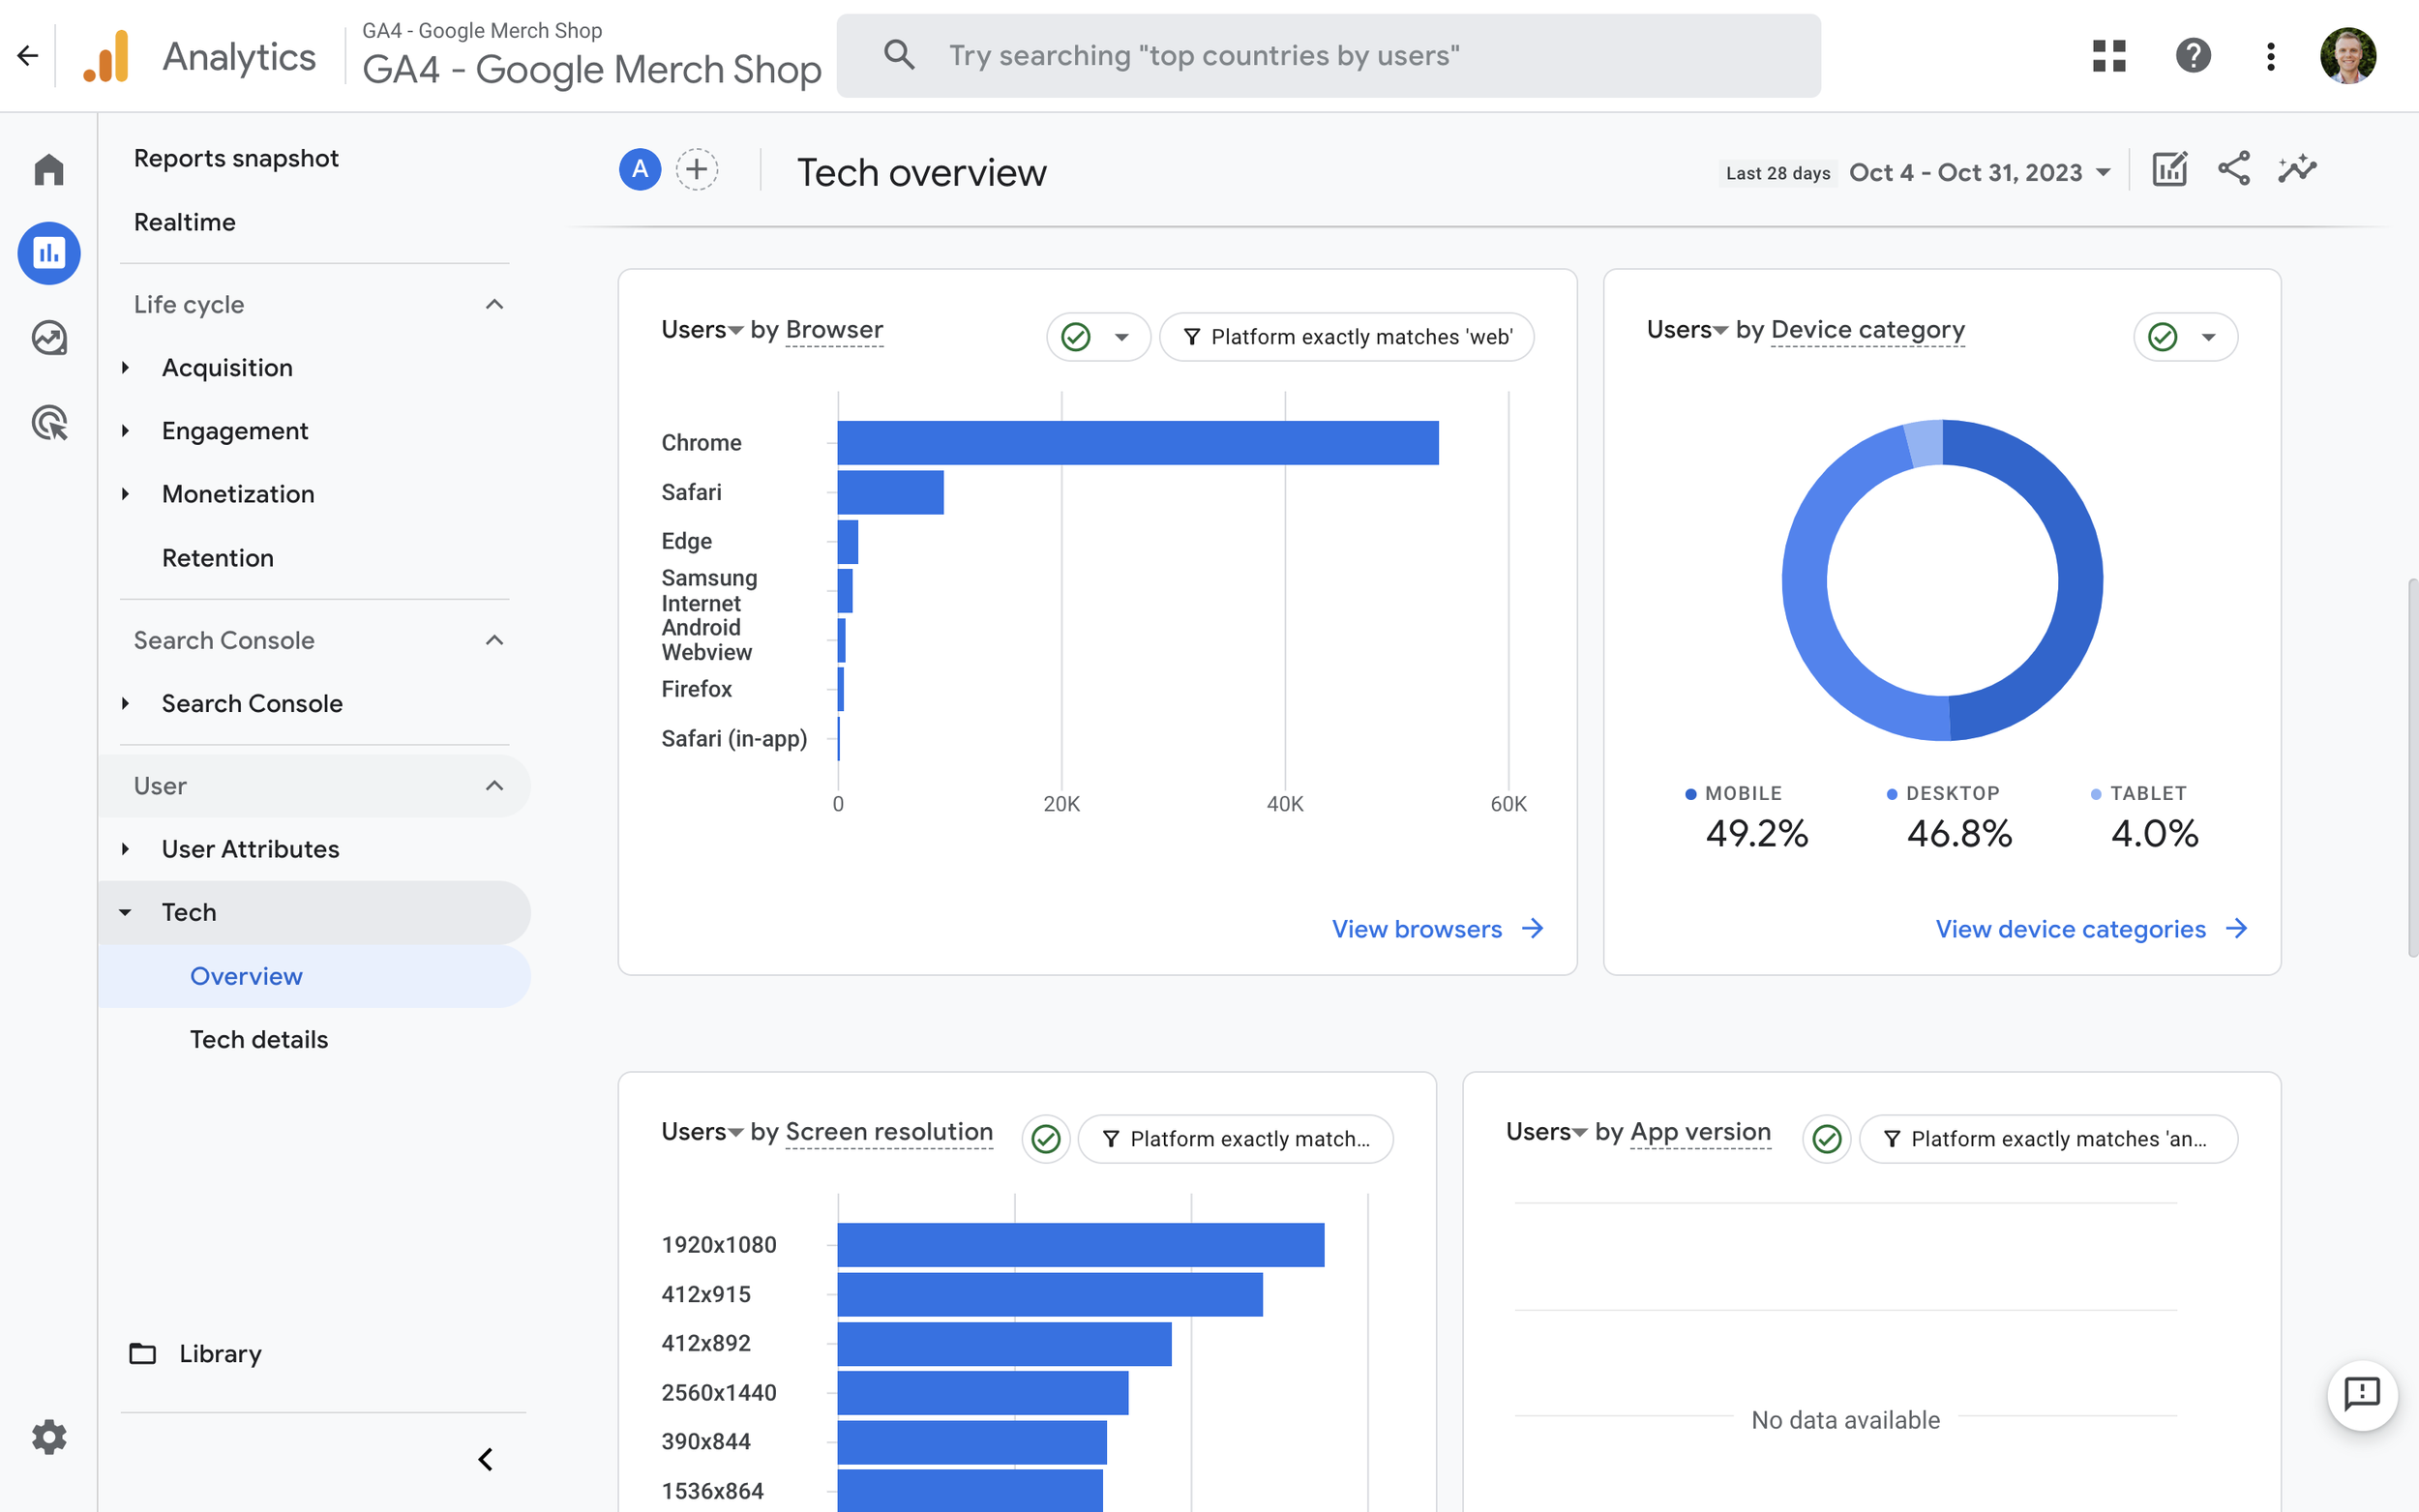
For more granular information, you can open the ‘Tech Details’ report.
Are there any browsers or operating systems that have higher conversion rates?
While you can customize the standard pre-configured reports, the exploration reports let you quickly combine dimensions and metrics based on your needs. In the following example, we’ve modified the first report we looked at to present the different browsers people are using:
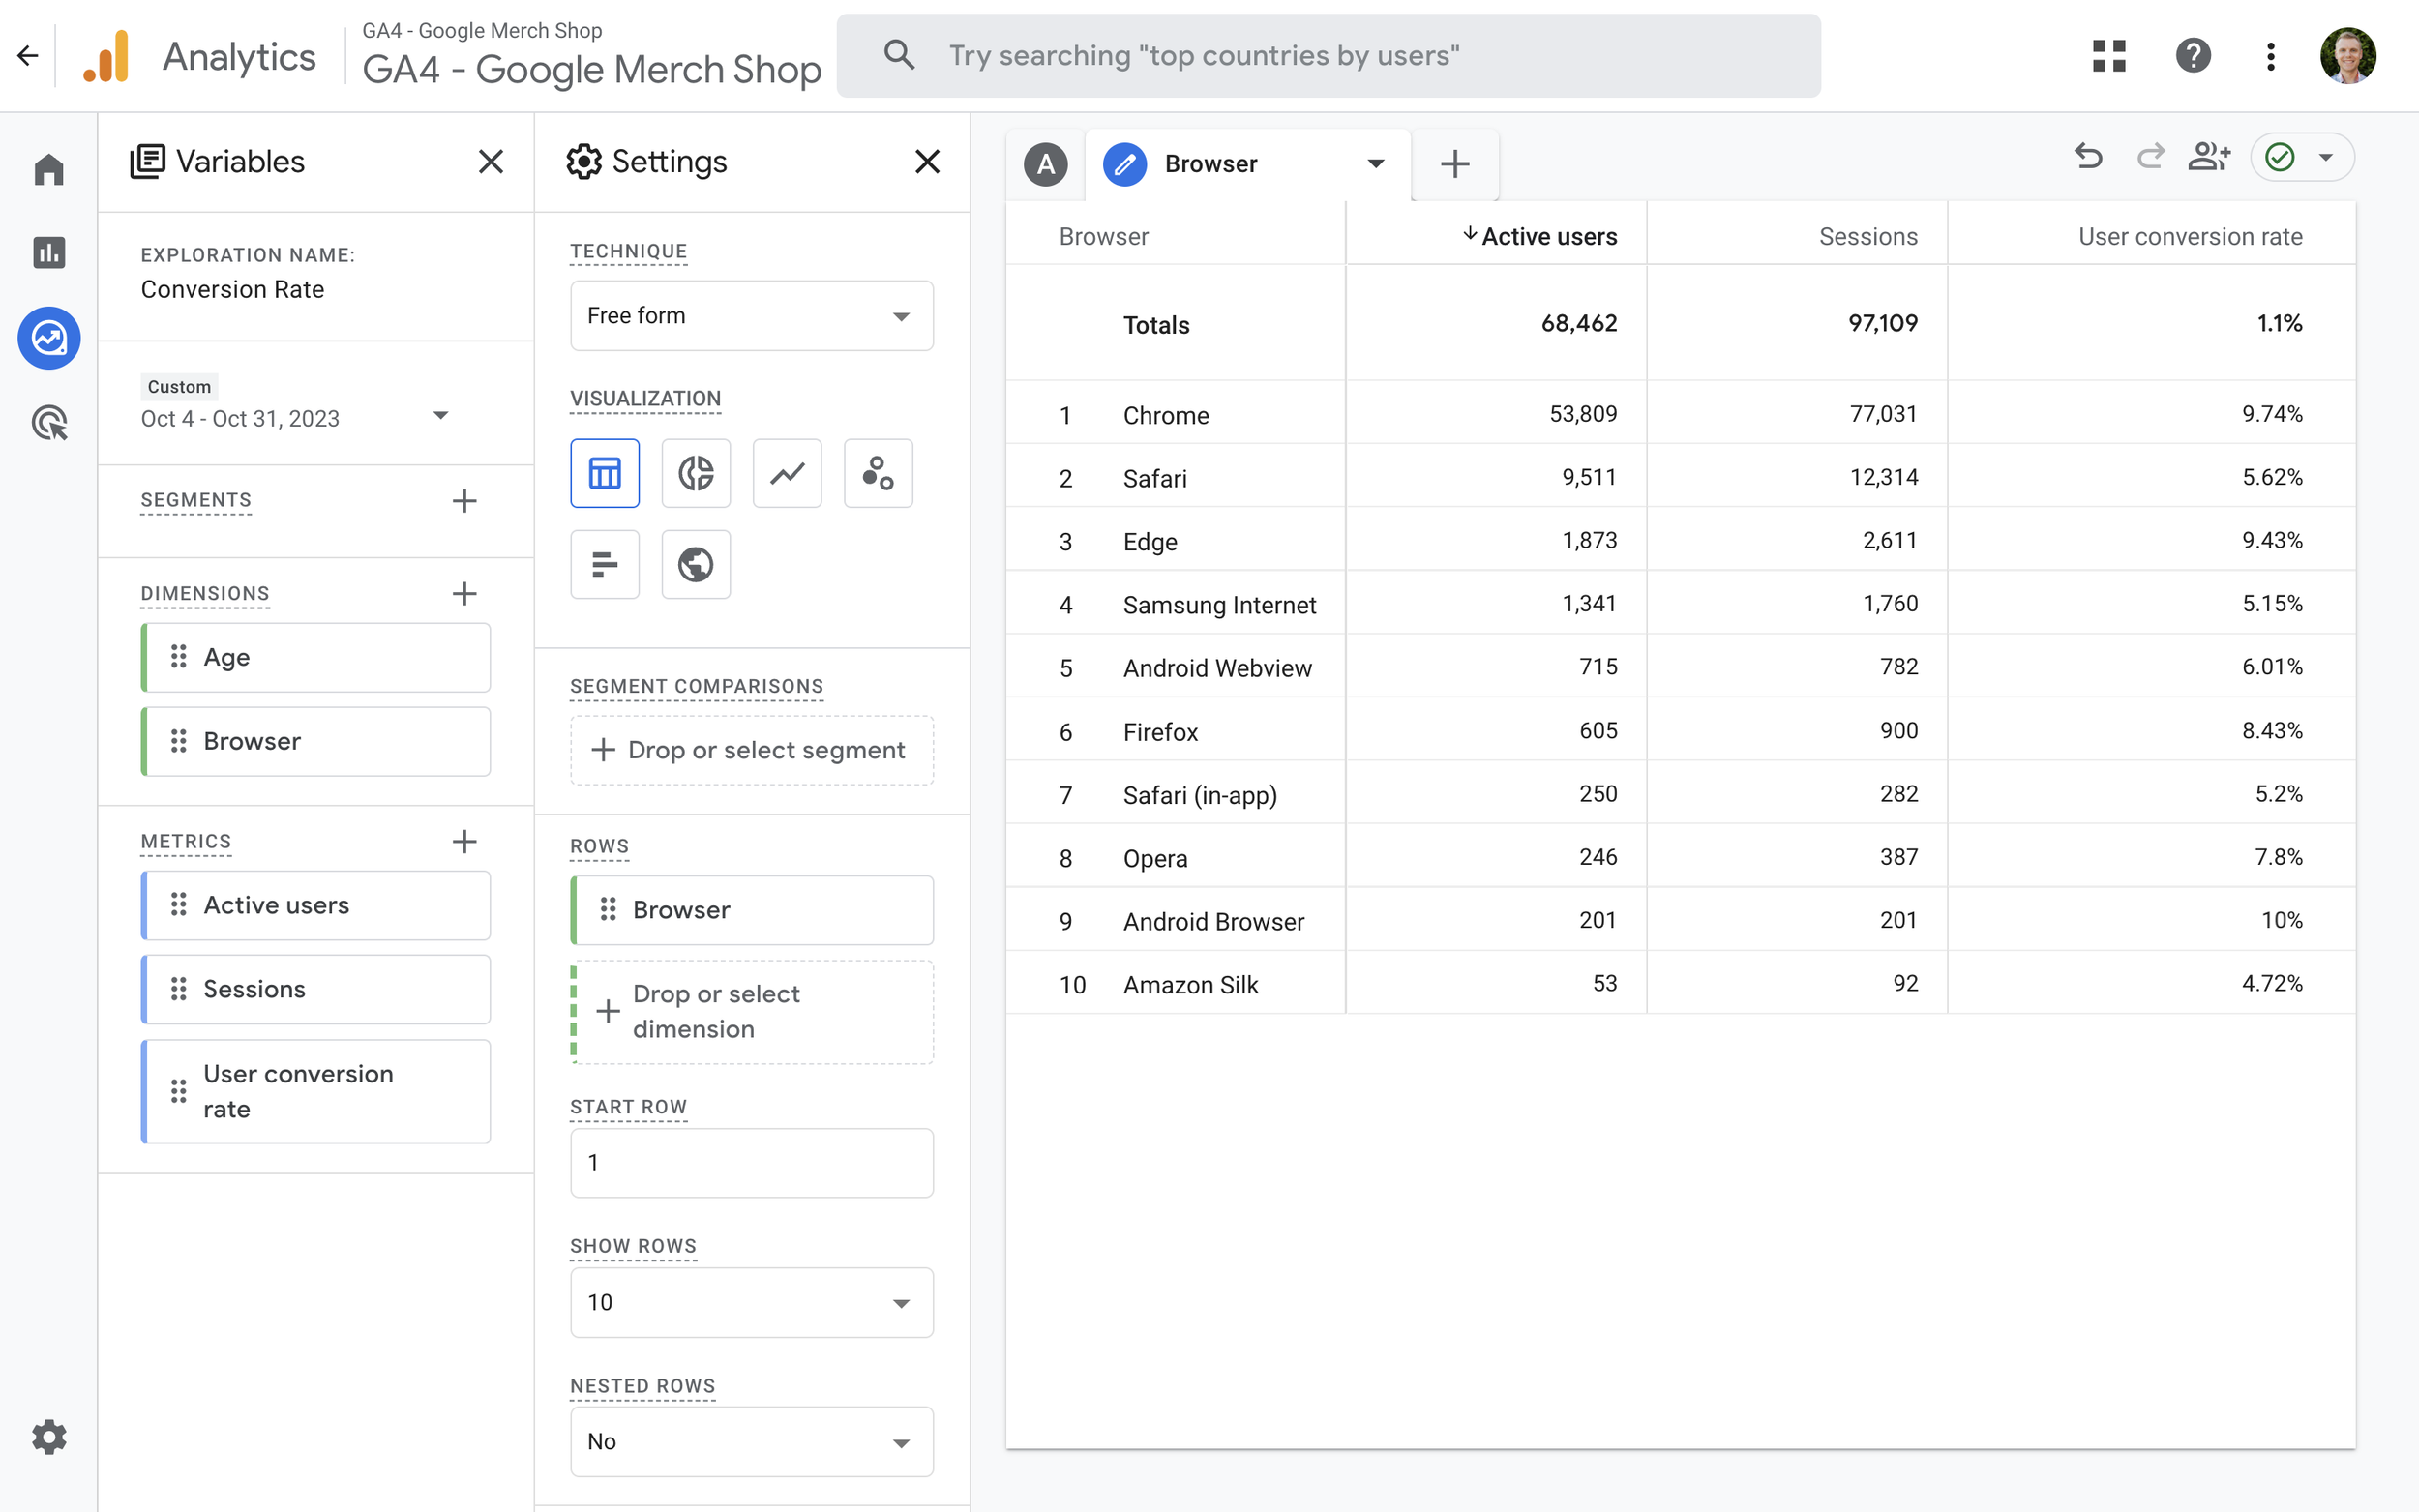
We can use the report to identify the browsers that are more likely to lead to conversions.


Comments