GTM Debug Mode: How to Use Google Tag Manager Preview Mode
Loves Data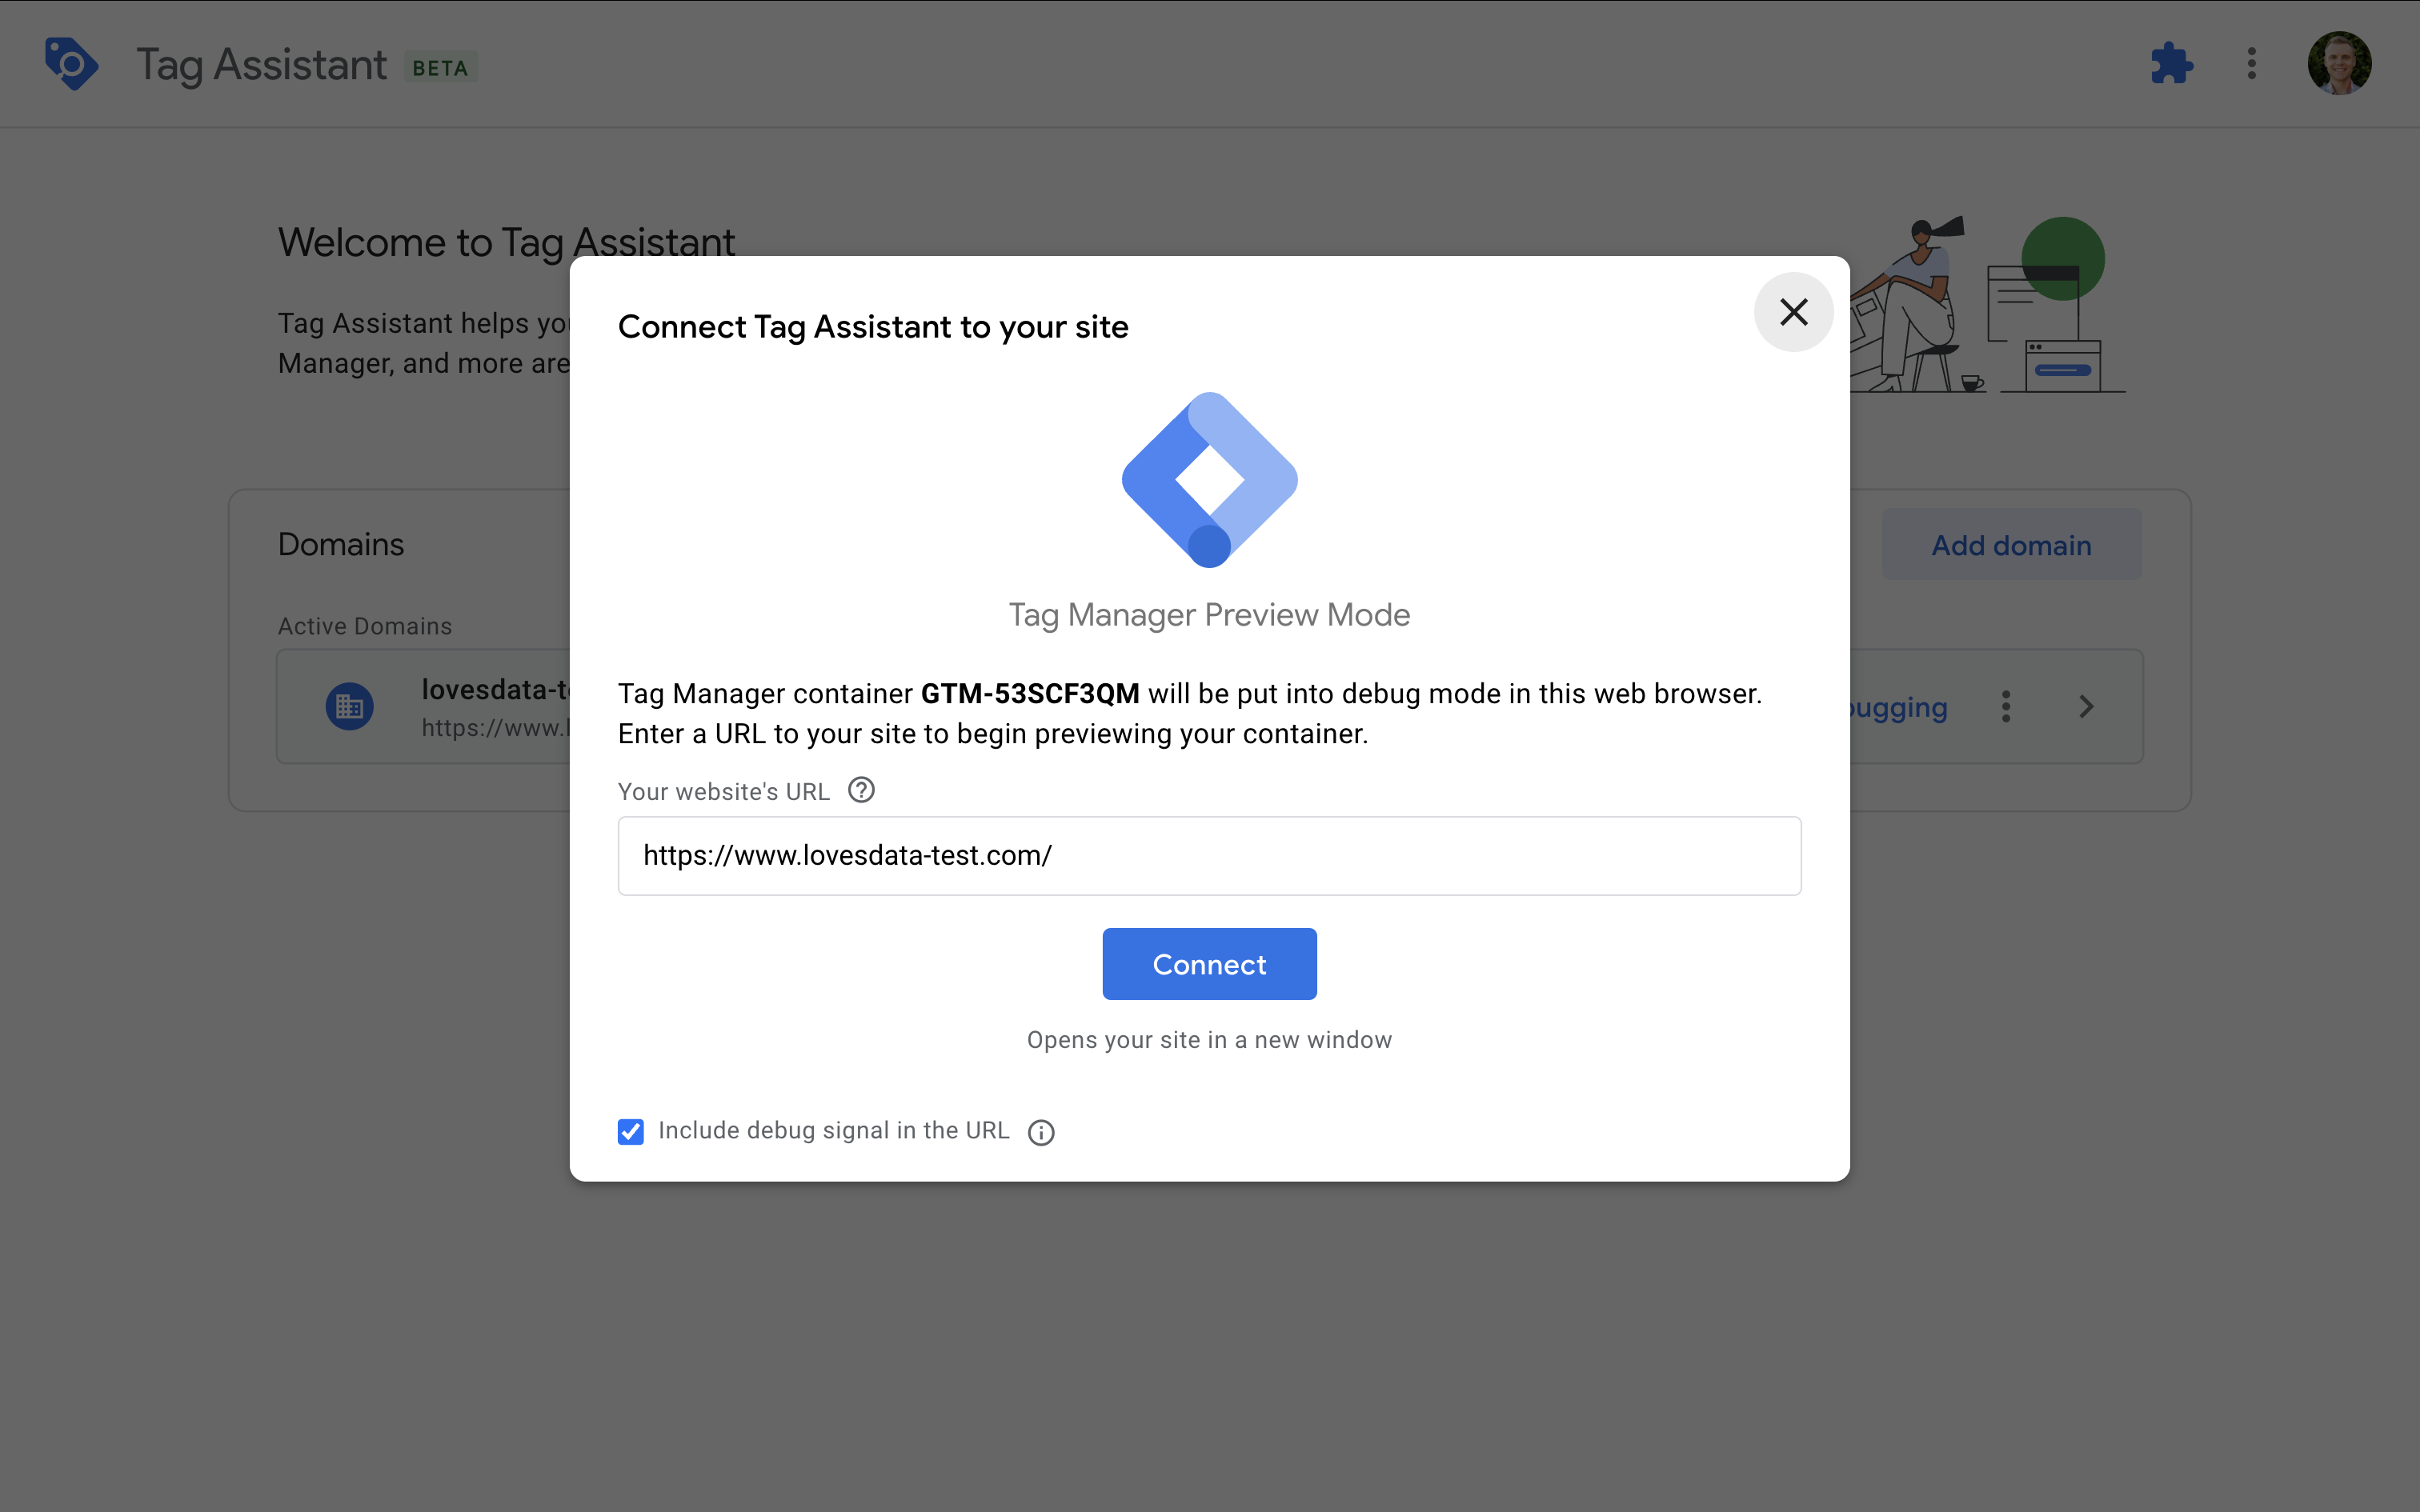
Google Tag Manager's Preview Mode – also called Debug Mode – is one of the most powerful tools in your GTM toolkit. It gives you a behind-the-scenes look at how your tags, triggers, and variables behave in real time. Whether you're testing a new tag, debugging an event, or troubleshooting an issue, GTM Preview Mode helps ensure everything works before your changes go live.
In this guide, you'll learn how to use GTM Debug Mode effectively, step-by-step. We'll cover how to enable it, interpret what you're seeing, troubleshoot issues, and what to do when Preview Mode isn't working – especially on platforms like Shopify using Custom Pixels.
Table of Contents
- What Is GTM Preview Mode?
- How to Enable GTM Debug Mode
- Understanding the Debug Panel
- Testing Tags and Triggers
- Troubleshooting GTM Preview Mode Issues
- GTM Debug Mode and Shopify Custom Pixels
- Sharing Your Debug Session
- Best Practices for GTM Debugging
- Final Thoughts
What Is GTM Preview Mode?
Google Tag Manager Preview Mode lets you test and debug your GTM container in a live environment – without affecting actual users. Once enabled, you'll see a debug panel that shows what tags fired, which ones didn't, and why. It also gives you access to event data, variables, the data layer, and any JavaScript errors related to your setup.
It's essentially your real-time tag debugger.
How to Enable GTM Debug Mode
- Log into your GTM account and select the container you want to test.
- Click the Preview button on the top-right corner of the interface.
- A new window will open prompting you to enter your website's URL.
- Enter your URL and click Connect.
- Your website will load in a new tab with Tag Assistant (Preview Mode) enabled.
Pro Tip: For best results, install the Tag Assistant Companion Chrome extension.
Understanding the Debug Panel
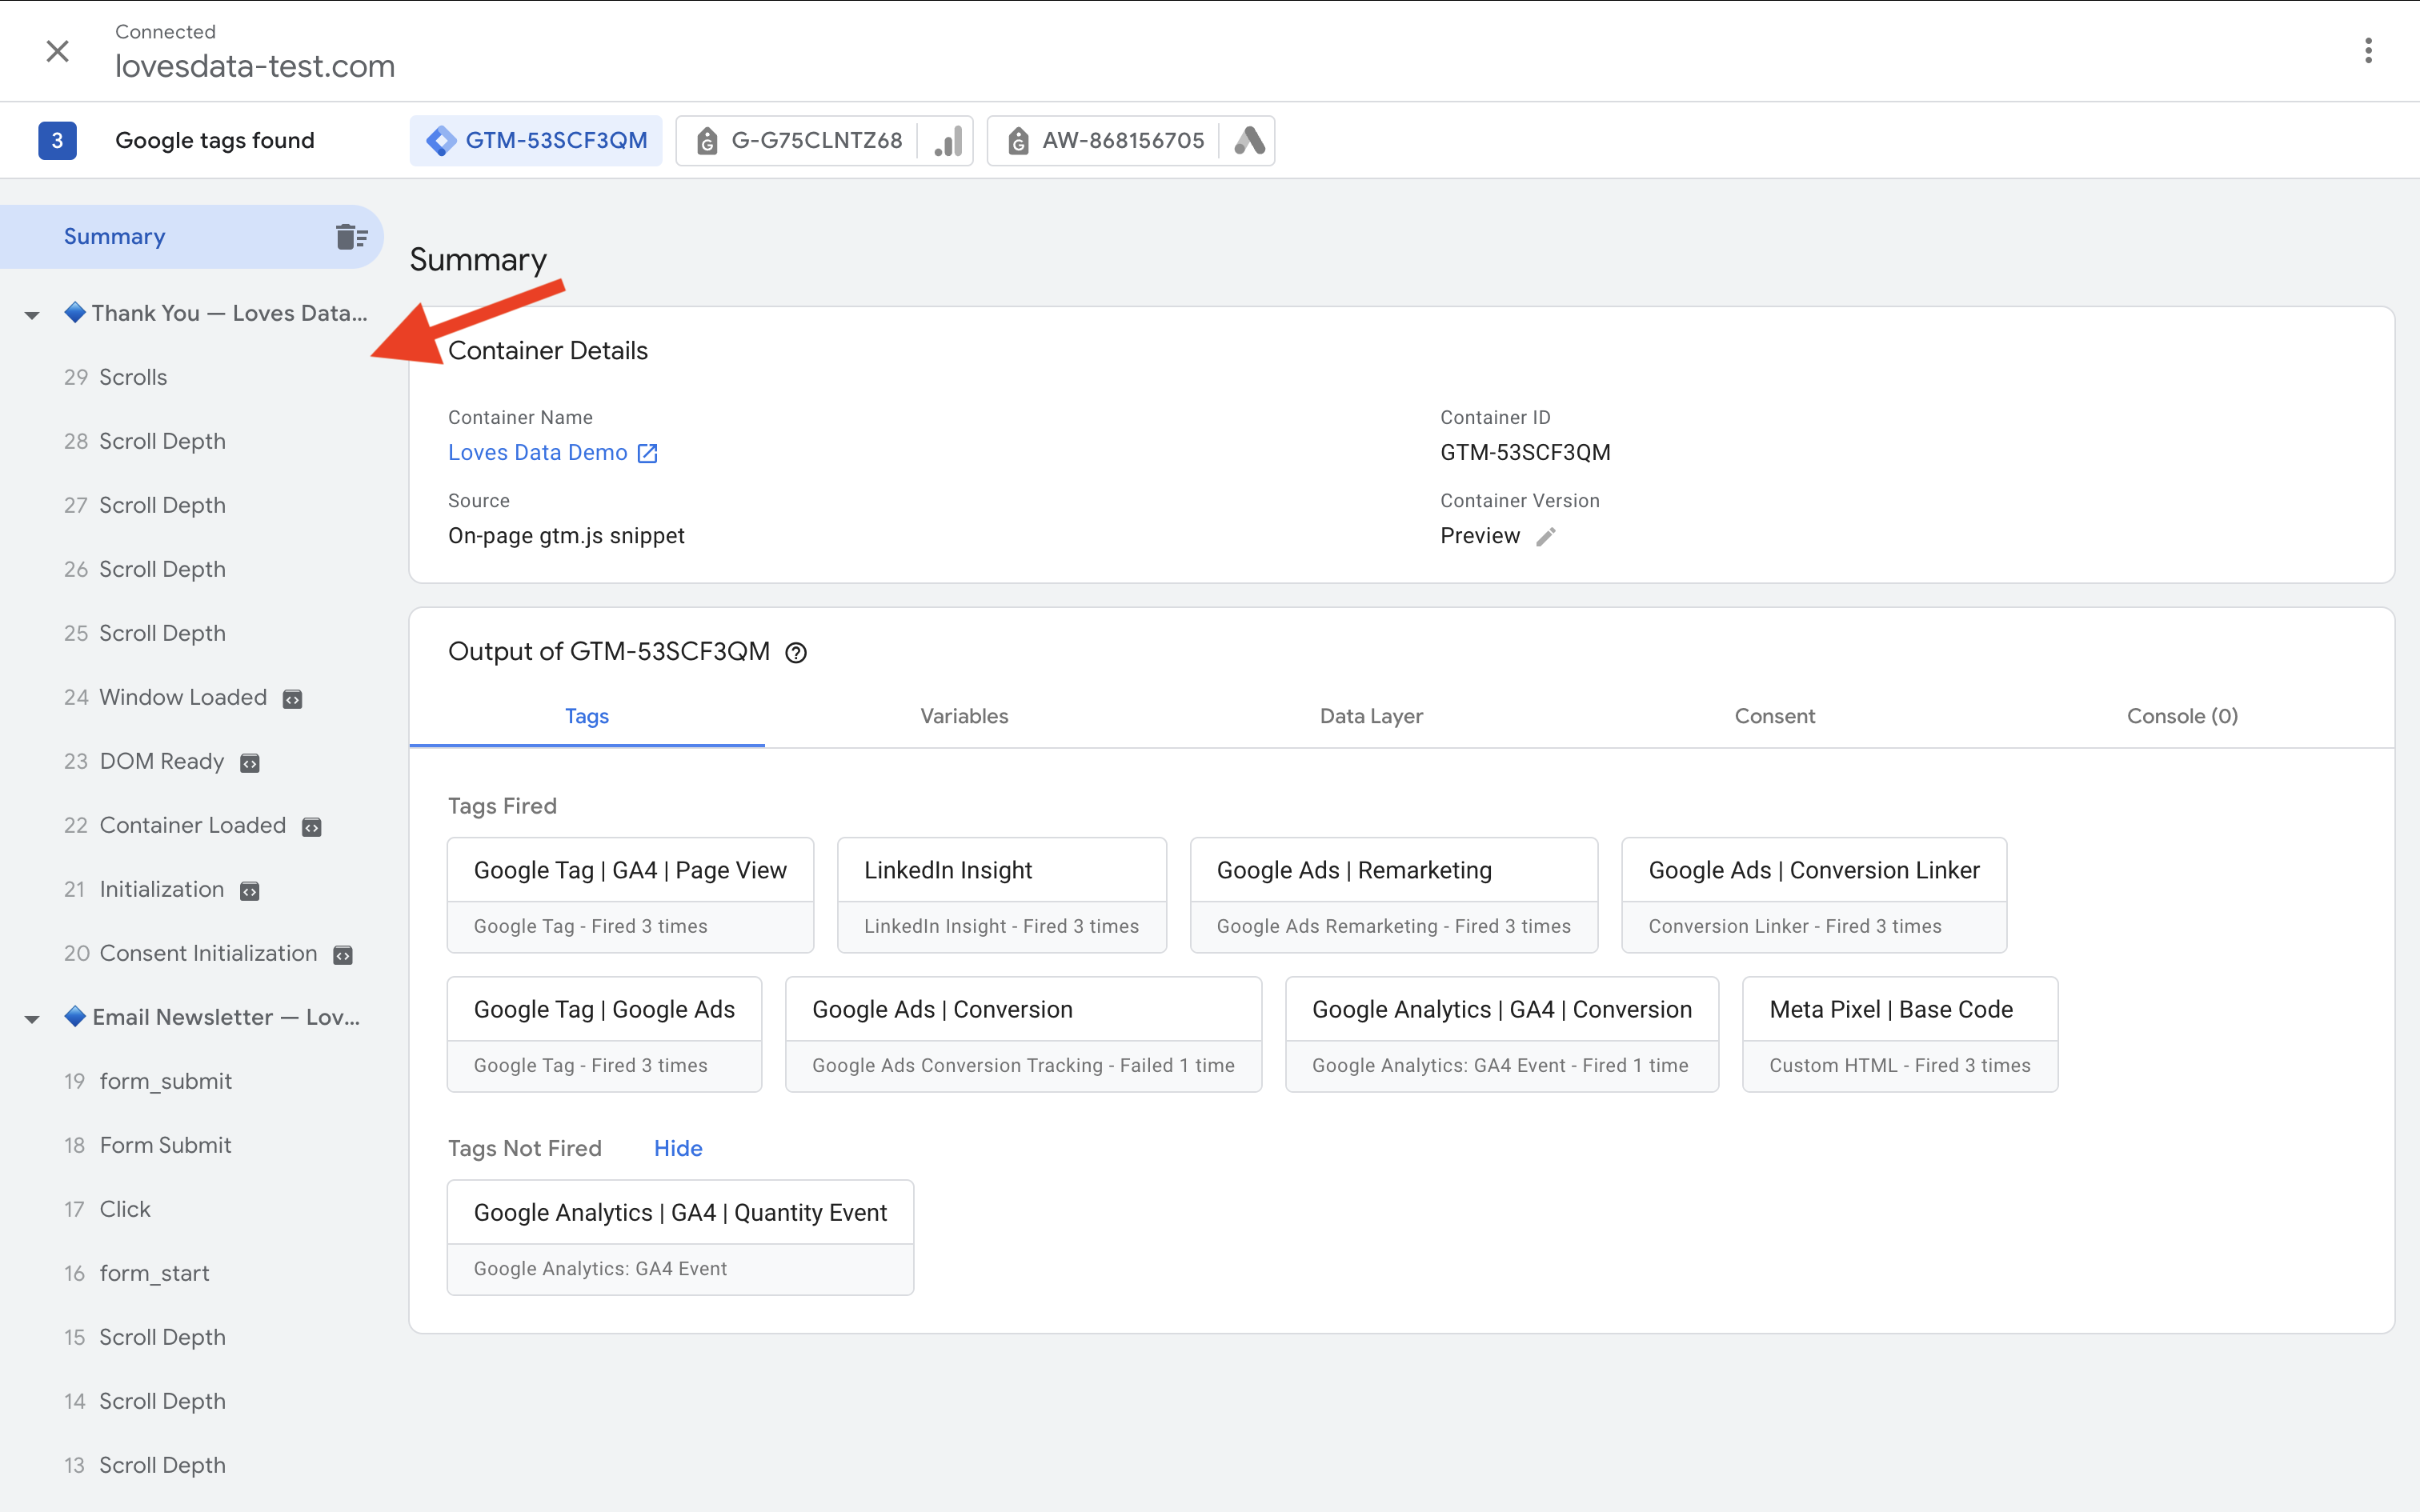
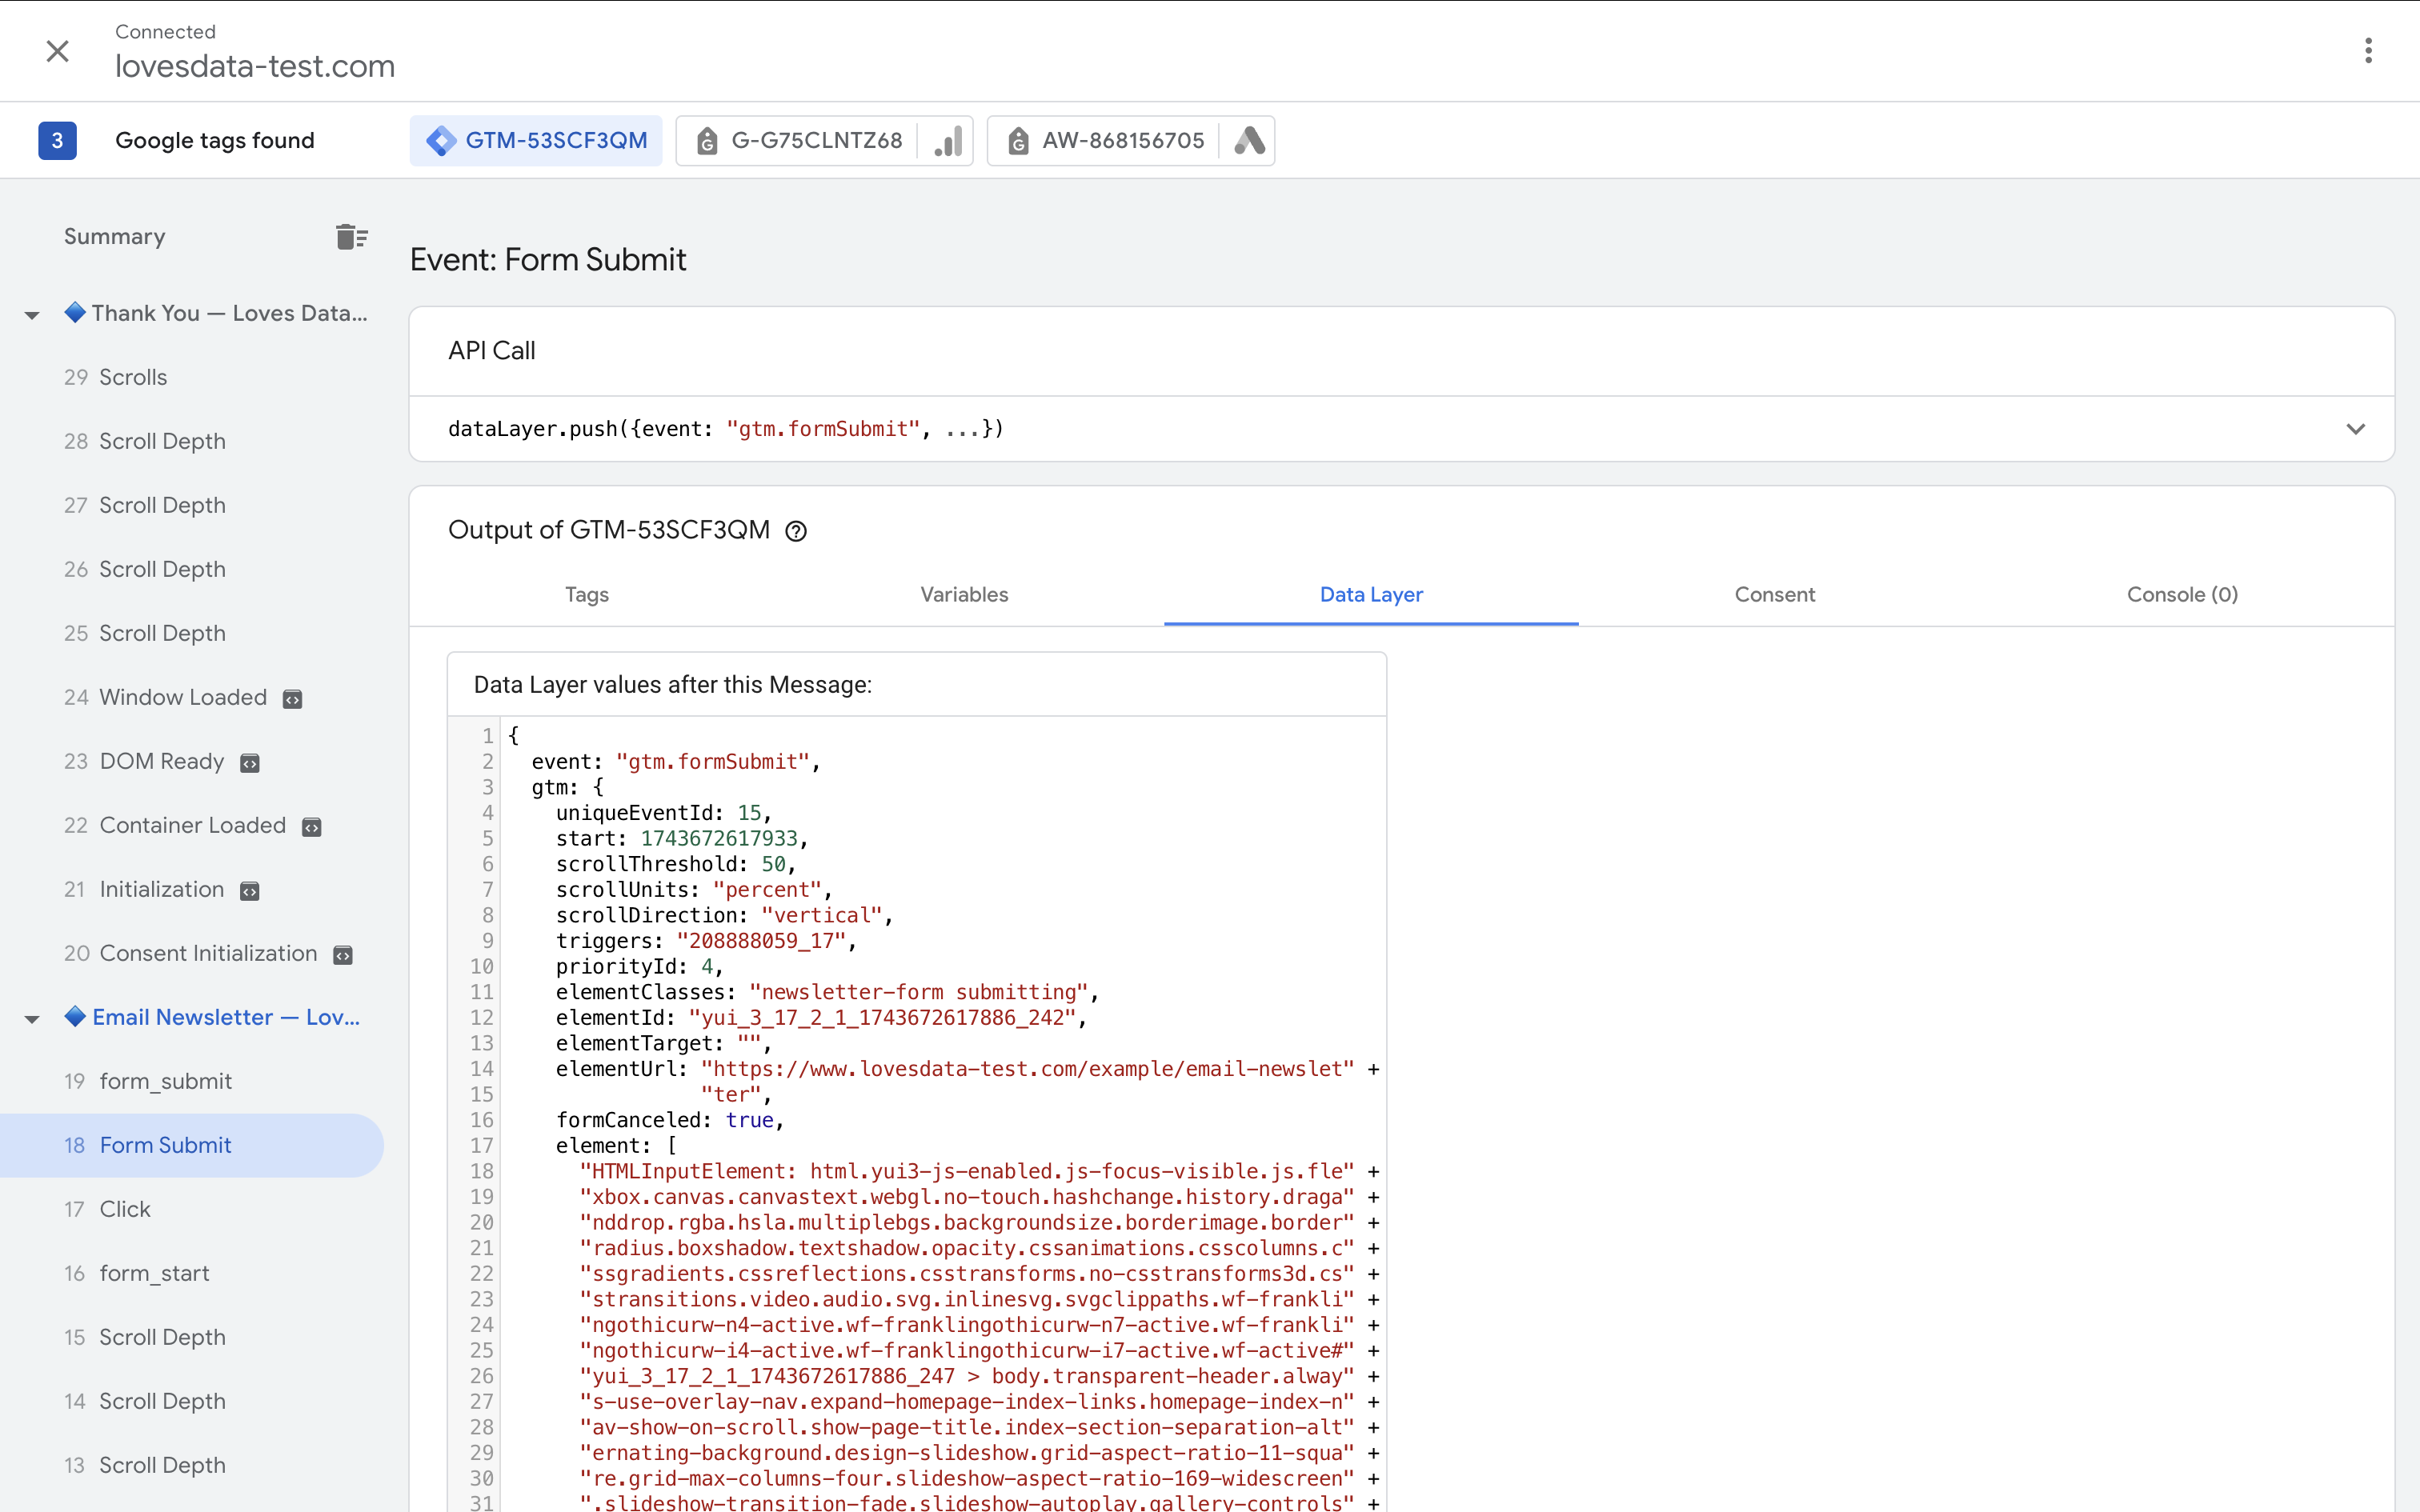
Once Preview Mode is connected to your website, you'll see the Tag Assistant Debug Panel. This panel is your control room for testing and debugging everything in Google Tag Manager. It's divided into several tabs that show what's happening behind the scenes as you interact with your site.
Event Stream
The left-hand sidebar lists all the events that occur on your website, such as:
Consent InitializationContainer LoadedDOM ReadyWindow Loaded
Custom events like Form Submit, Scroll Depth, or Purchase will appear here too. Click an event to inspect it.
Tags Tab
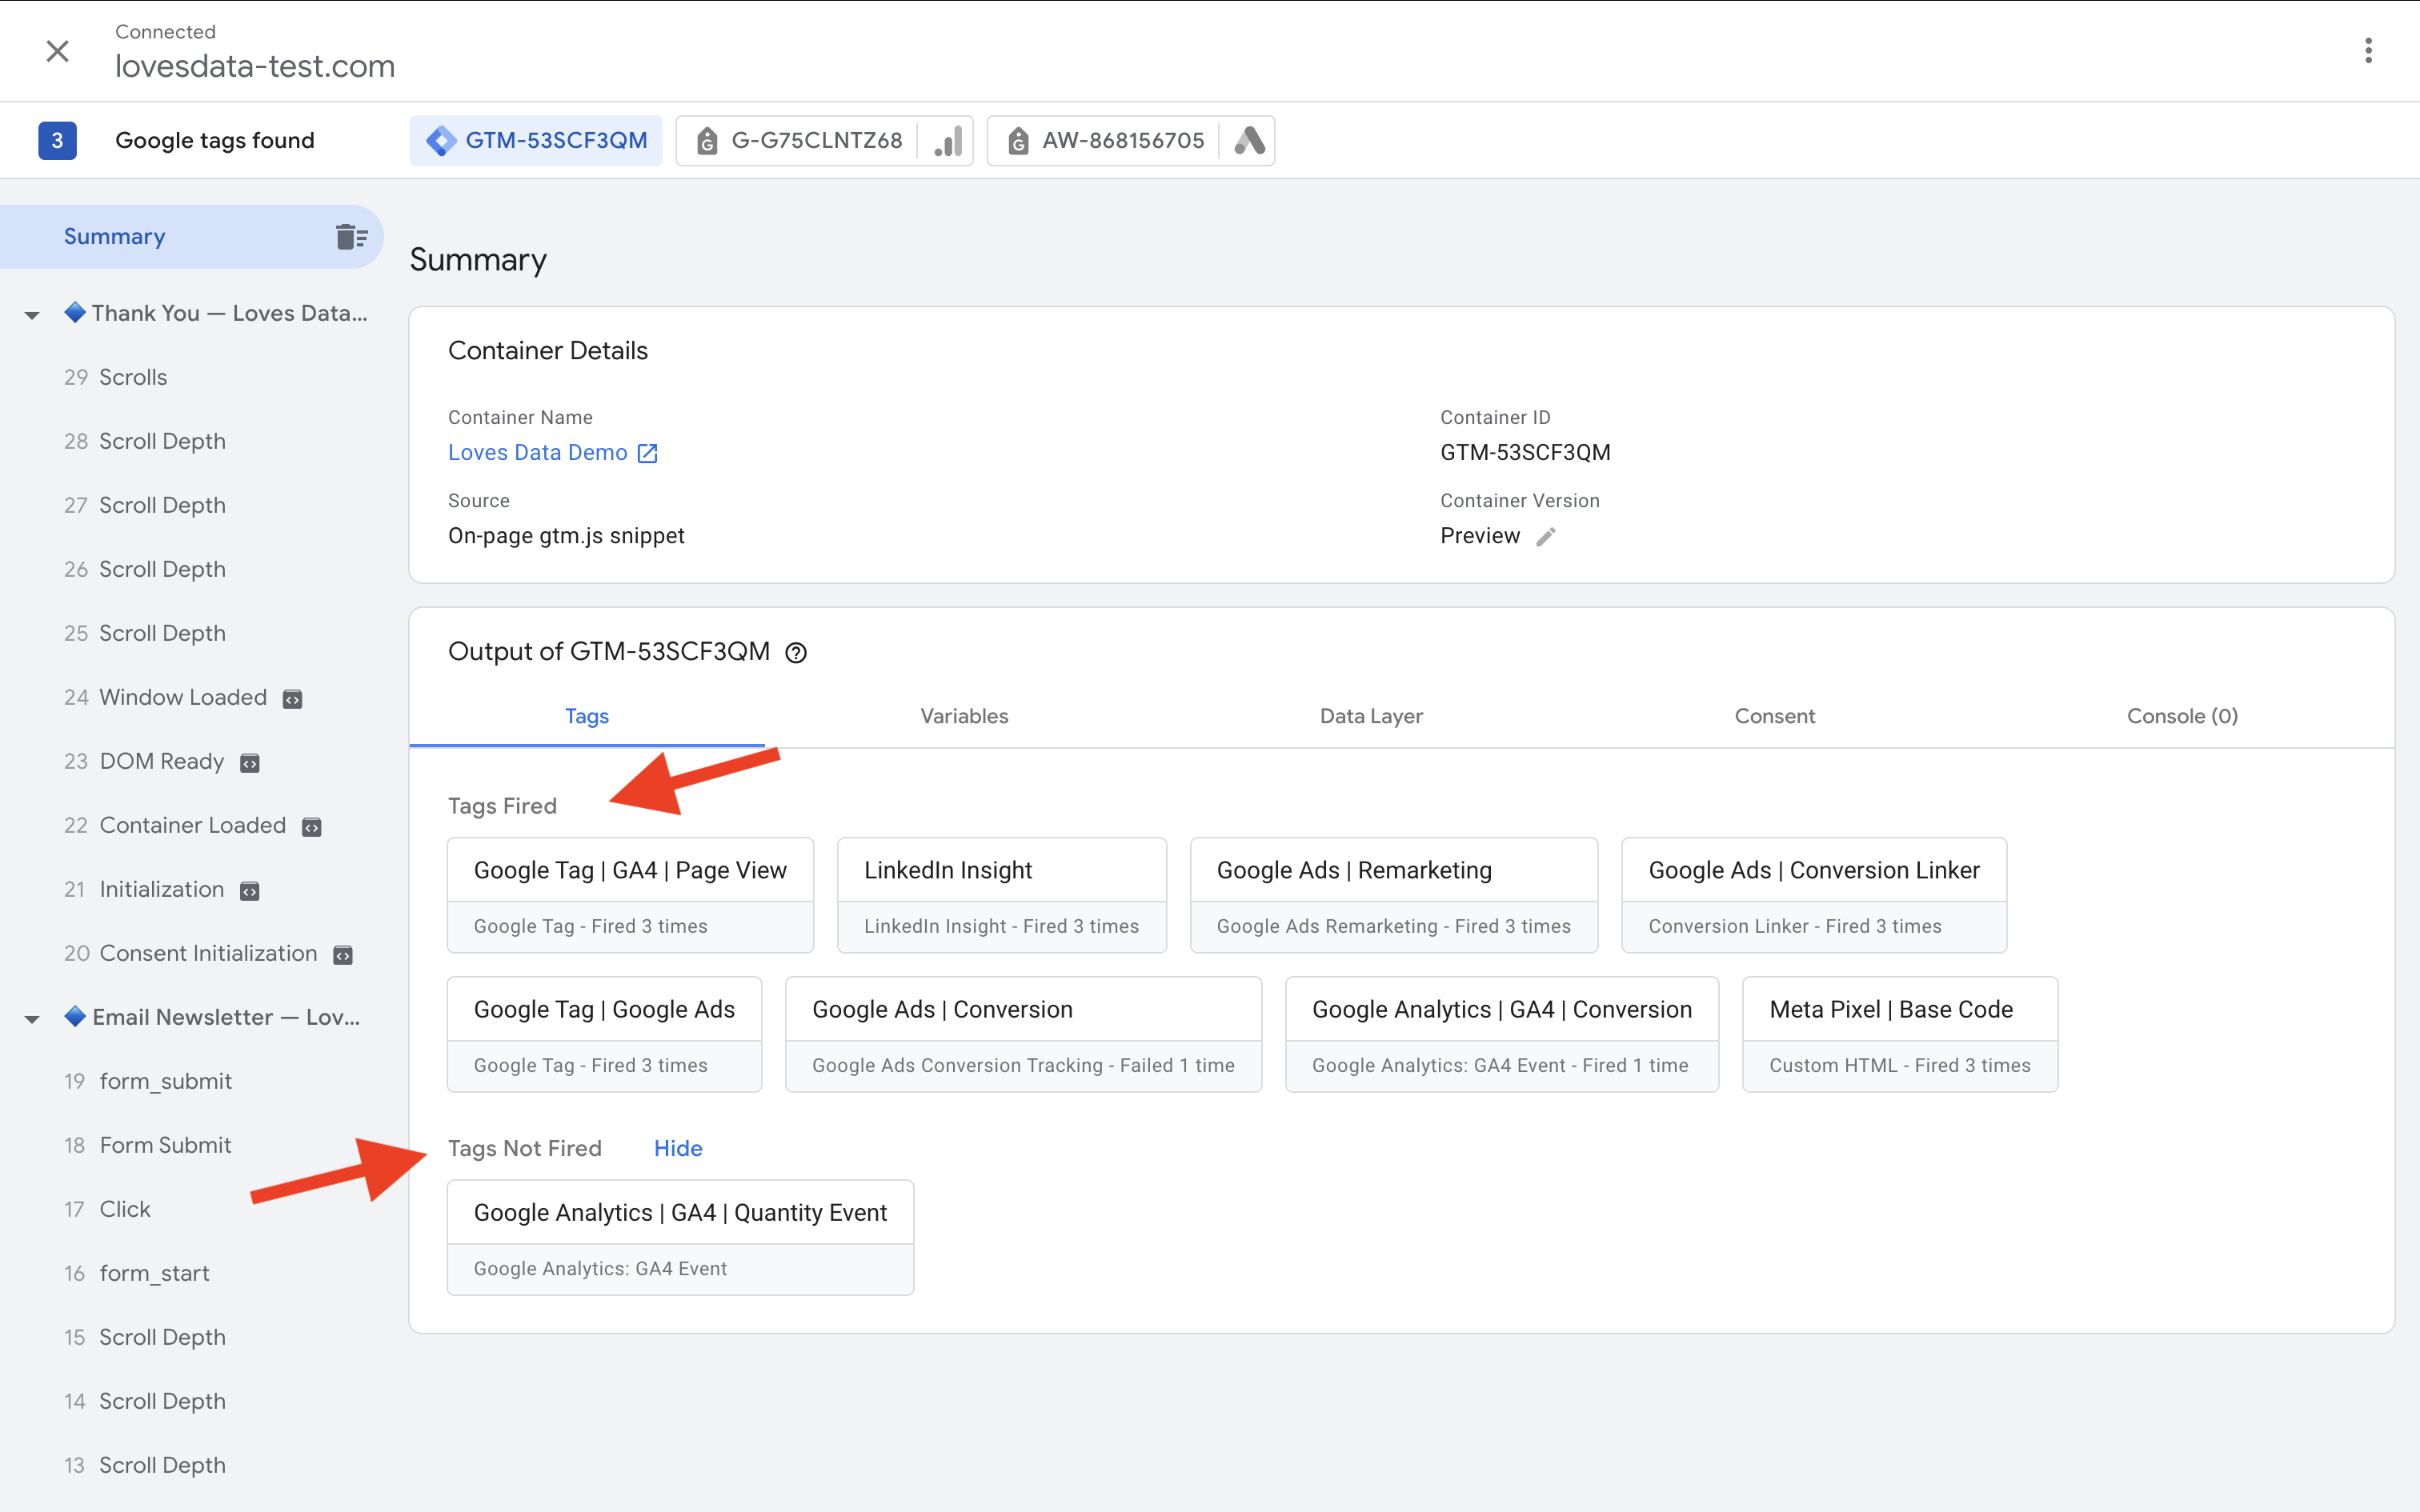
Shows tags that fired or didn’t for a selected event:
- Tags Fired – Trigger conditions were met.
- Tags Not Fired – Conditions weren’t met.
You can expand a tag to see which conditions were true or false, and if any errors occurred.
Variables Tab
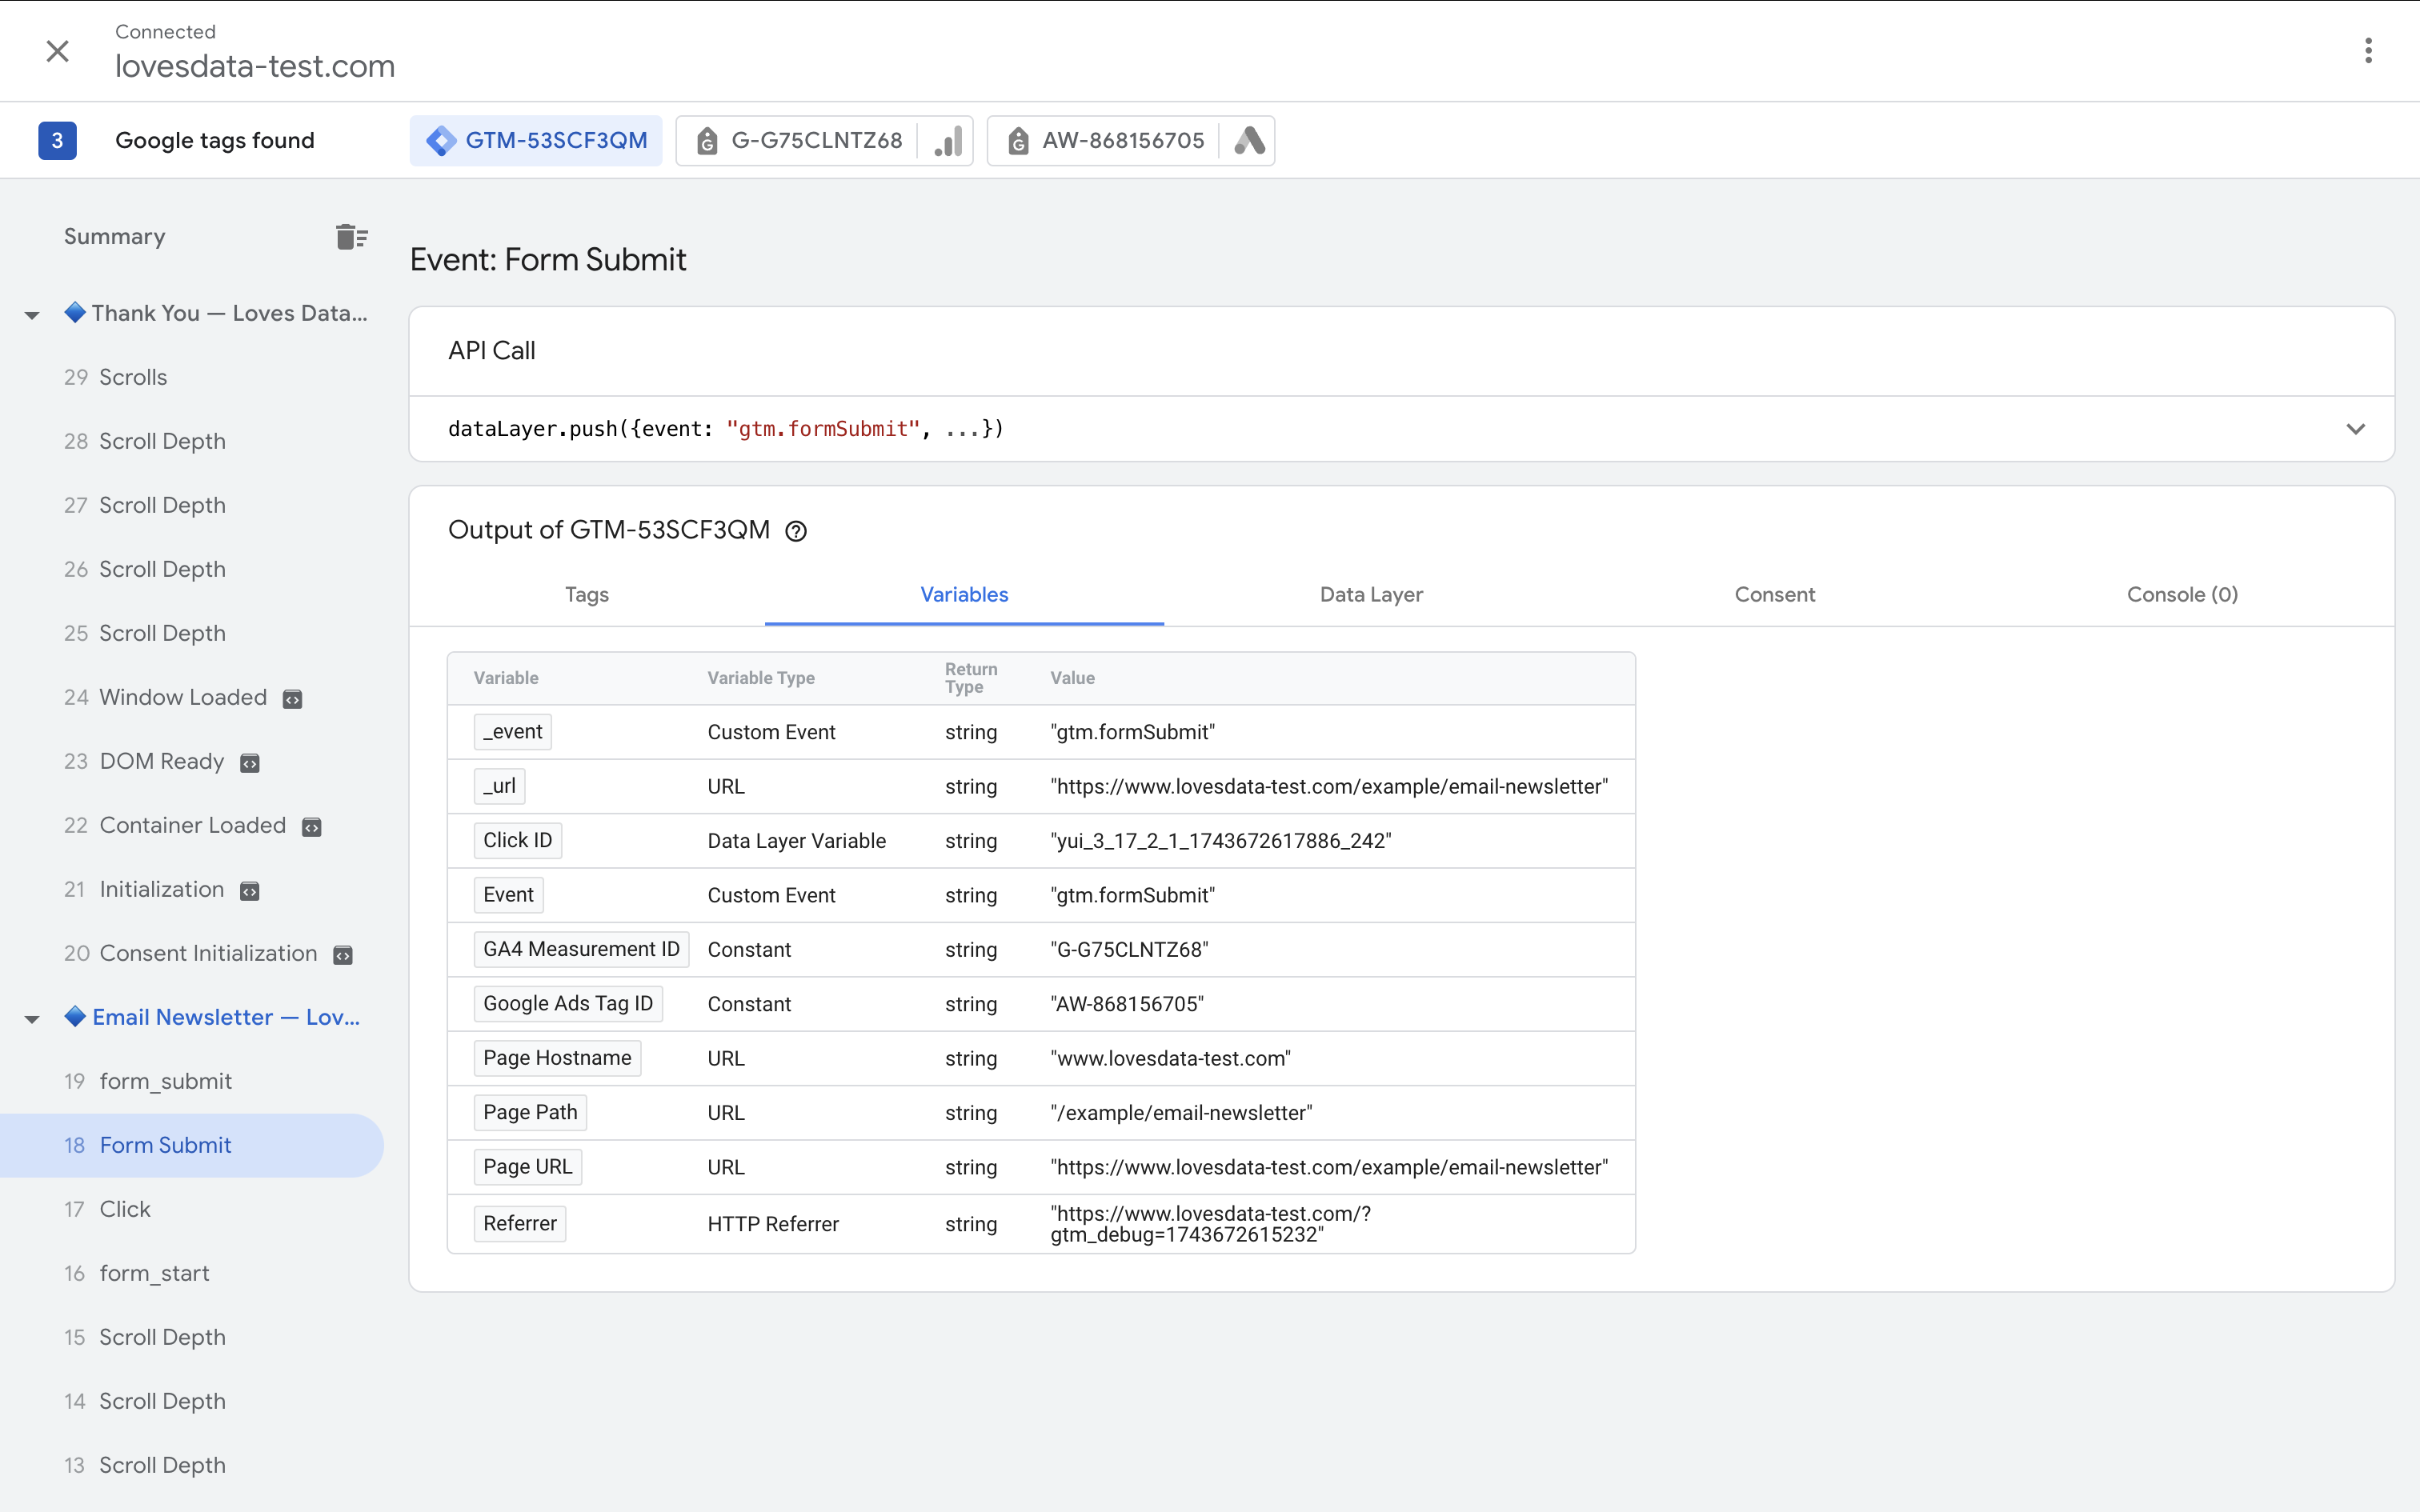
This tab lists all variable values at the time of the event – helpful to confirm that click data, URLs, and form fields are working as expected.
Data Layer Tab
Displays data objects pushed to the data layer. Use this to validate ecommerce data, custom events, or user interaction tracking.
Consent Tab
When the consent state is set for use with tags, you can see the values available for each Google Tag Manager event in the consent tab. For Consent Mode, this can include values for:
ad_storageanalytics_storagead_user_dataad_personalizationpersonalization_storagefunctionality_storagesecurity_storage

Console Tab
If a tag has JavaScript errors or is misconfigured, the issue will be displayed here. This is your go-to place for debugging tag failures.
Testing Tags and Triggers
Now it's time to simulate real user actions and test your GTM setup.
1. Simulate Key User Actions
- Click buttons or links
- Submit forms
- Add items to cart
- Complete a purchase
- Scroll the page
- Play videos or trigger media events
2. Inspect Trigger Conditions
Go to the Tags tab and check which tags fired. For ones that didn’t, open them to see why the trigger conditions failed.
3. Confirm Variable Values
Use the Variables tab to verify values like Click Text, Form ID, and transaction_id. If a variable is undefined, check its setup or timing.
4. Test Multiple Scenarios
Test different forms, product types, and purchase flows. Preview Mode updates in real time as you interact with your site.
5. Repeat After Changes
Each time you edit your GTM setup, refresh Preview Mode and re-test. You can bookmark your test URLs to save time.
Troubleshooting GTM Preview Mode Issues
1. Check GTM Installation
Open DevTools, go to the Network tab, and search for gtm.js. If it doesn’t appear or shows an error, the container isn’t installed properly.
2. Watch for Quote Issues
Ensure the GTM snippet uses standard straight quotes. Curly quotes from text editors can break your code.
3. Disable Conflicting Extensions
Extensions like AdBlock, Ghostery, or script blockers can stop Preview Mode. Try disabling them or testing in Incognito Mode.
4. Use the Same Browser Window
Make sure GTM and your test site are opened in the same browser window – not across incognito or separate profiles unless you're sharing a debug link.
5. Watch for CSP Issues
If you see Content Security Policy errors, ask your developer to allow the domains required for GTM Preview Mode.
GTM Debug Mode and Shopify Custom Pixels
If you're using Shopify and implementing GTM via a Custom Pixel, you'll find that GTM Preview Mode doesn’t work due to Shopify’s sandbox restrictions.
What Happens?
- No preview panel appears
- GTM debug connection fails
- Tags may still fire, but can't be debugged normally
How to Debug GTM with Custom Pixels
- Use GA4 DebugView: Send data with
debug_modeenabled. - Use console logging: Add
console.log()messages inside your Custom Pixel. - Create a staging theme: Add GTM to
theme.liquidfor debugging, then move it into the Custom Pixel. - Use Shopify analytics.publish(): Push custom events into GTM for tracking.
Sharing Your Debug Session
Want to collaborate or ask for help? Click the three-dot menu in Tag Assistant and select Share to copy a debug session link. You can send this to your team or developer.
Best Practices for GTM Debugging
- Refresh Preview Mode after each GTM update
- Use consistent naming conventions
- Check the Errors tab often
- Test in Incognito Mode
- Use GA4 DebugView for additional verification
Final Thoughts
Preview Mode is an essential part of working with Google Tag Manager. It gives you visibility into exactly what's happening on your site and helps you catch mistakes before they impact your live data.
While platforms like Shopify's Custom Pixels present some challenges, there are reliable workarounds that still let you test and verify your setup.
With the right approach and a bit of practice, GTM Debug Mode becomes one of your most trusted tools for high-quality tag management.
Ready to walk through the steps? You can watch our Preview Mode tutorial on YouTube:


Comments