Unlocking User Explorer Reports in Google Analytics
Loves Data
We should all be asking questions about how people experience our website. For lots of us, it’s the first experience people will have with our brand. If it’s confusing and hard to navigate we are immediately losing an opportunity to provide an amazing experience to our prospects (and existing audience).
So, here are some questions I’d like to ask you...
What are people doing on your website?
What paths do your users take?
Is your website user-friendly?
Are people actually having a positive experience?
They’re difficult to answer, right? And they should be difficult to answer because unless we’re sitting next to each person as they land on our website and navigate through our pages and read our content it’s really hard to know what people are thinking. Are they smiling? Or are they yelling at their screen because the experience sucks! So we turn to our data, we turn to Google Analytics and the other tools we are using to understand how people are engaging with us online.
The User Explorer report, which is one of the newer reports inside Google Analytics opens a small window, allowing us to see how people are experiencing our website, how they’re moving through our website and experiencing our content. I’m not going to say it provides every answer, but it does provide some very granular data about how individuals are engaging with us.
Here’s how I’m using the User Explorer report to unlock insights about user behaviour (and how you can use it too)…
When we hosted our Analytics Conference in Australia we looked at the data to improve the experience for everybody attending the conference. And in the lead-up to our conference, we looked at ticket sales and how people traveled through the checkout process. (Now I know you might not be selling something, so replace ‘sales’ for ‘leads’ or whatever is driving value for your organisation.)
Heading to the User Explorer report we are presented with a list of the Google Analytics Client IDs. These are basically the anonymous cookie IDs that are used by Google Analytics in order to track each user (aka person) coming to our website.
Now I can find a user that has converted – in my case this means purchasing a conference ticket and I can click on their Client ID. Now I can see the different sessions (or session) where that person came to the website and the different interactions that have occurred.
Tip: A quick way to find your most valuable users is to reorder the report by clicking ‘Revenue’, ‘Transactions’ or ‘Goal Conversion Rate’ at the top of the table.
Here I can see this person engaged with the website during the date range I have selected which for this person is 3 separate sessions that were spread over 9 days. I can see how long they spend on the website, the revenue generated and how they found the website.
I can also identify that this person is leaving the checkout process in order to view the terms and conditions page – so I can now review how this appears in the checkout process and potentially include some basic details within the process to reduce the chance of someone getting lost in the process.
Looking at another person engaging with the website I can see they move from the website, to the checkout process, then from the checkout process back to the website before they convert.
You can see that they’ve left the checkout process in order to read more about the optional Masterclass. I can use this insight to either include additional details during checkout, so they don’t need to leave the checkout process or I can try and provide more details upfront so they have the information before they checkout. Amazing! An insight that helps me understand how people are experiencing the website!
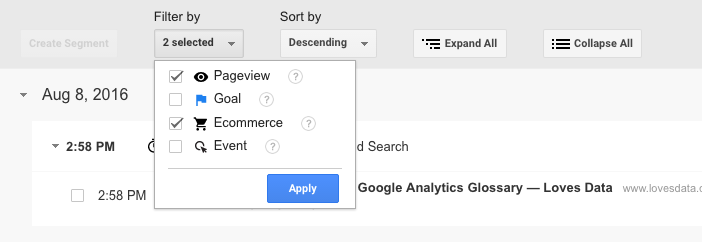
Inside the User Explorer report you can view the following types of interactions for each user:
- Pageviews
- Goal conversions
- Ecommerce transactions
- Events
You can even use the handy ‘Filter by’ option to decide what you’d like to see within the report. If you just want to see ecommerce transactions and pageviews, then simply deselect goals and events:
Jump into your User Explorer reports and see what you can find out about how people are experiencing your website. Are they converting? Are they watching your videos, engaging with your content and do you think they’re enjoying the experience?
You can find the User Explorer reports under ‘Audience’ within the ‘Reporting’ tab of Google Analytics. Go and take a look, you might be surprised at what you find!
Pro Tip: Once you’ve found a particular trait or sequence that you find interesting you can apply a custom segment to the report to see how many users are experiencing the same journey.


Comments