Are you seeing COVID-19 trends in Google Analytics?
Loves Data
As COVID-19 spreads across the world, people’s behavior has changed. This is especially the case online. For example, the regular and predictable audience trends you saw for your website last year are likely to be different at the moment. Many businesses are experiencing a downward trend in website traffic. Today, we’re going to explore ways to identify the unexpected trends you might be seeing in Google Analytics.
Here’s what we are going to cover:
- Identifying trends in Google Analytics
- Is it a limited or industry-wide trend?
- Using Google Sheets to calculate the change
- Monitoring top-level trends
You can also follow along with my YouTube video:
Identifying trends in Google Analytics
The ‘Home’ report in Google Analytics provides a top-level performance snapshot of your website. On the top left corner of the report, you can see recent trends. I’m using the Google Analytics demo account, which is for the Google Merchandise Store. We can see there is a downward trend for all of the metrics, including a 22.8% drop in users.
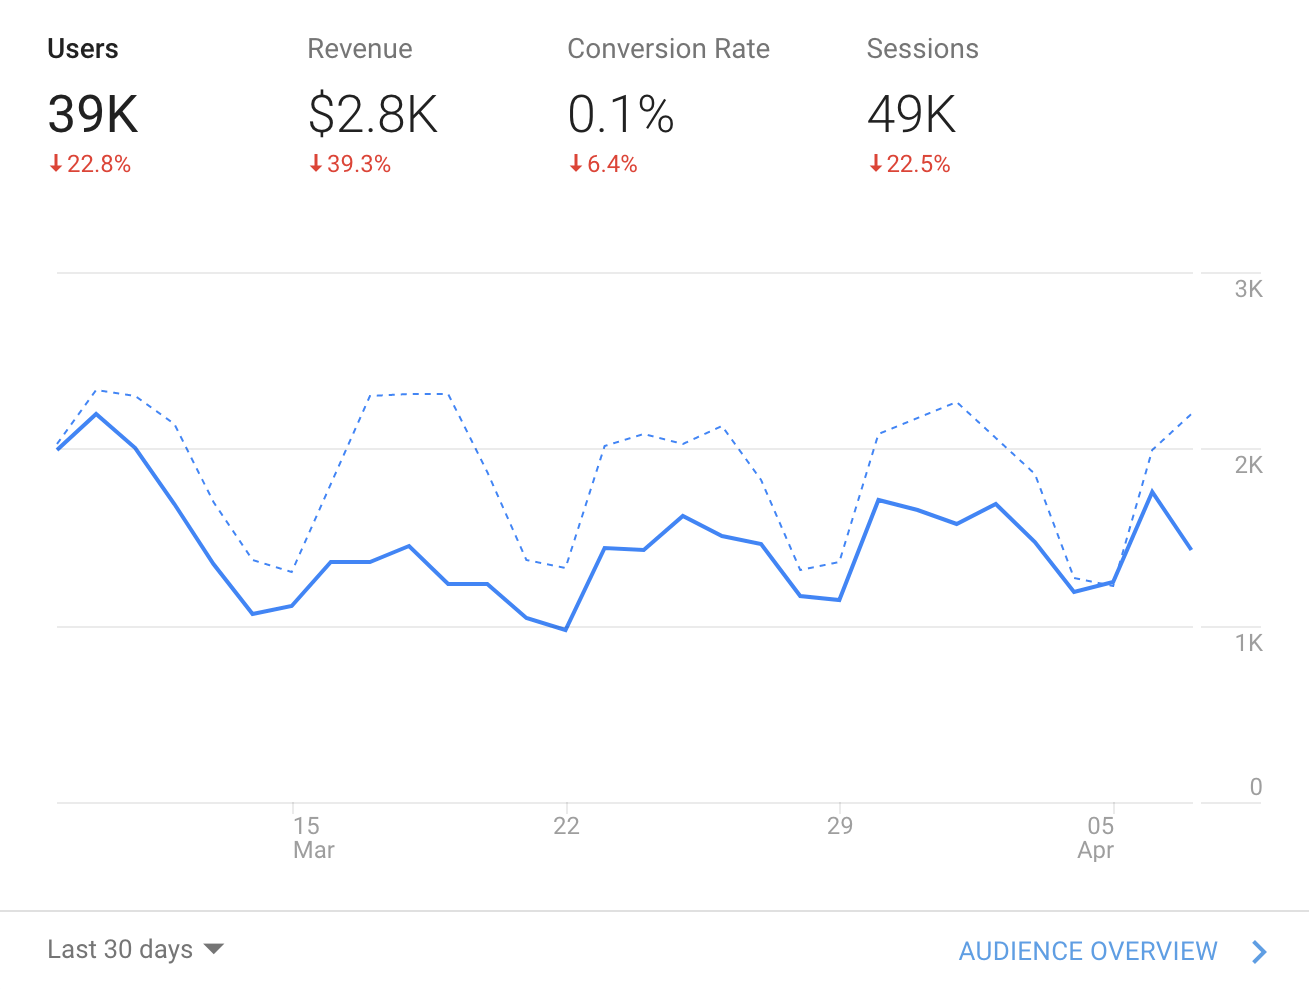
On the bottom left corner, you can adjust the date range. For example, you can switch to ‘Last 7 Days’ to see if the trend is changing.
Now let’s travel to ‘Audience’ and then ‘Overview’. This report also provides a top-level summary for your website. We can see the daily trend for the default date range. Take a moment to open your Google Analytics reporting view. You might be able to identify a trend by just looking at the timeline.
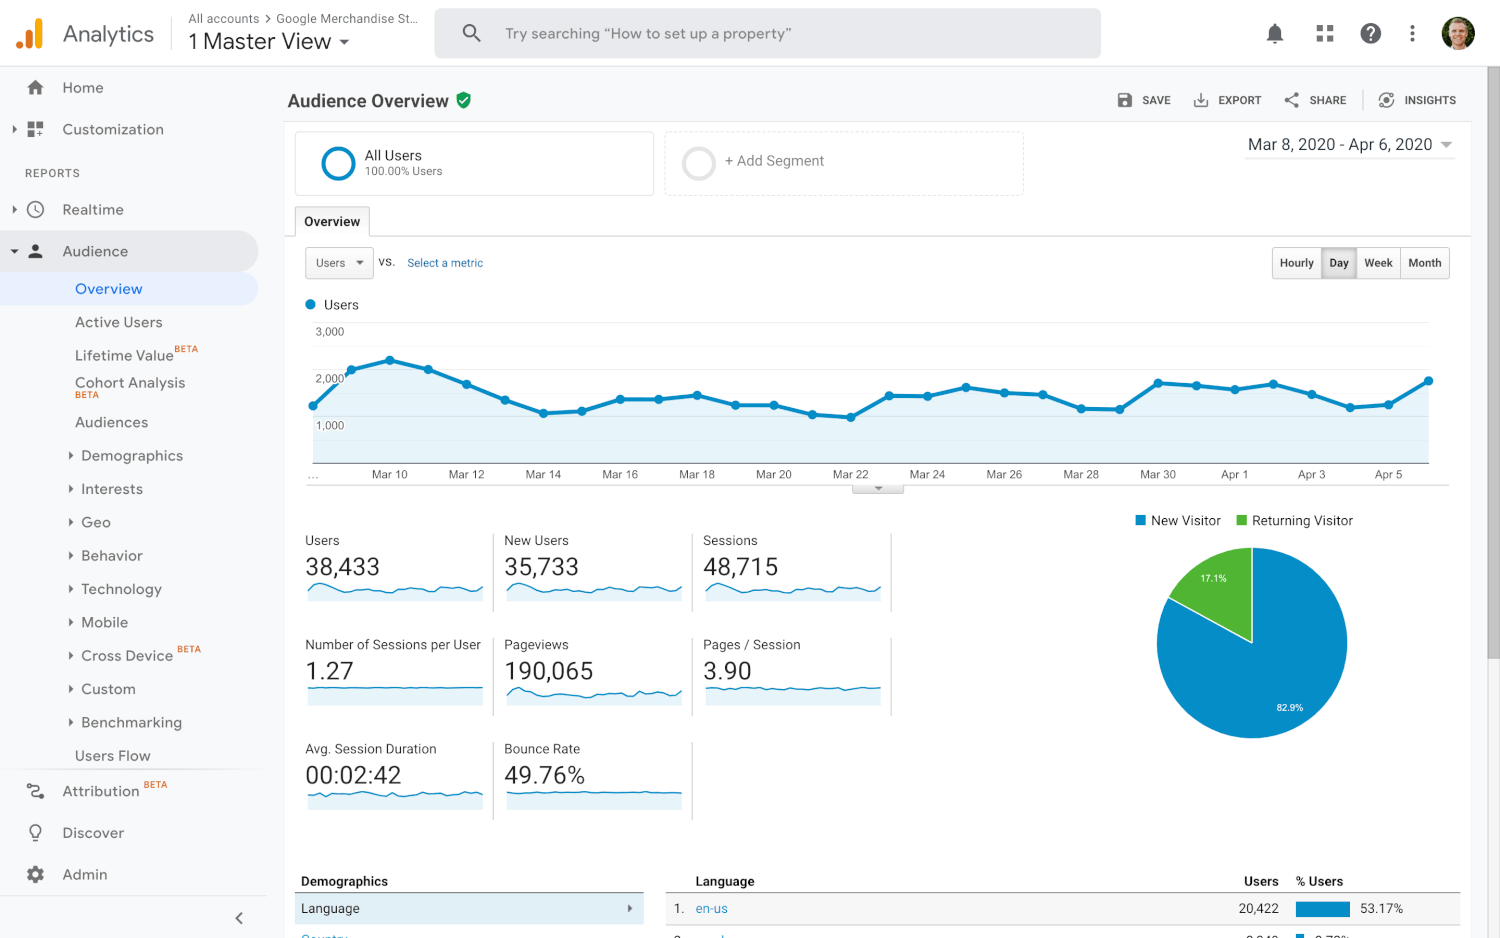
If you can’t see a clear trend, then try increasing the date range for the report. In the following example, I have selected 2 February to 4 April as the date range.
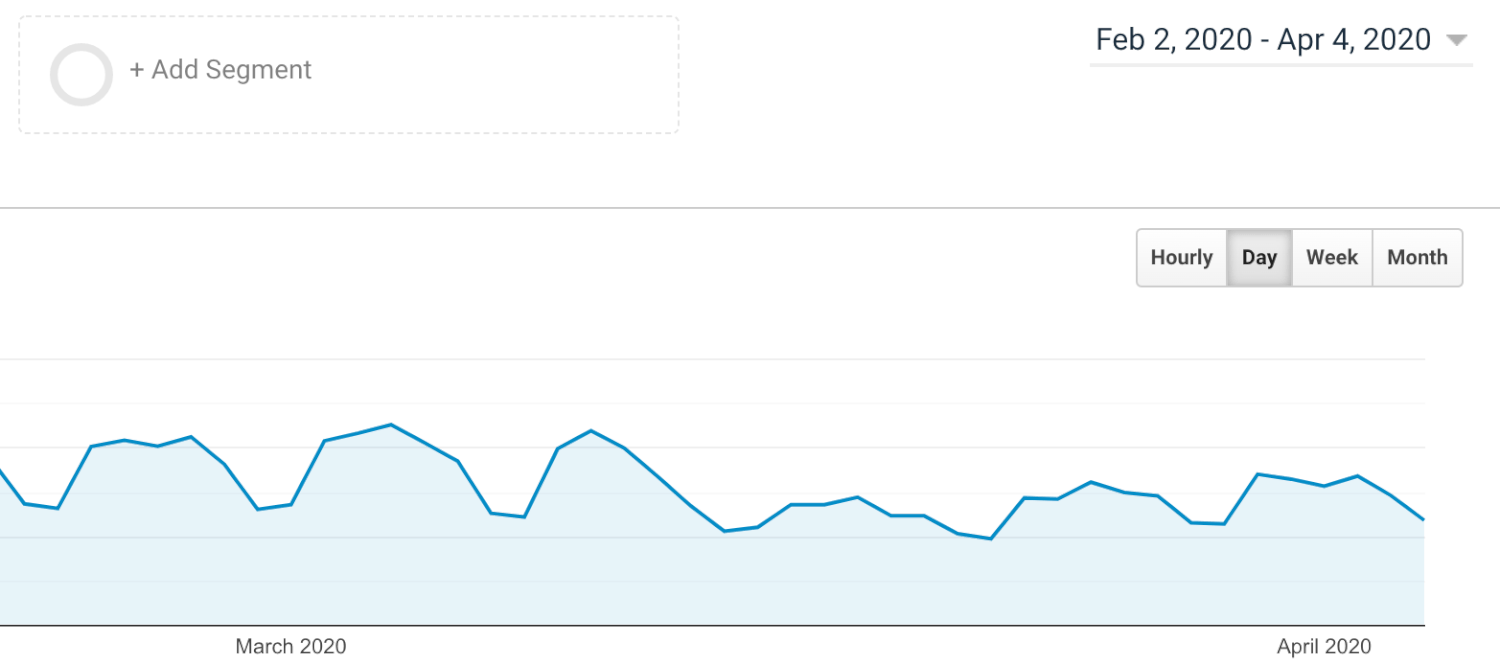
We can now see a clear downward trend from 13 March. If you still can’t see a trend in your report, then try selecting the ‘Week’ option above the graph on the right. This will now present each week as a point on the timeline (instead of a single day).
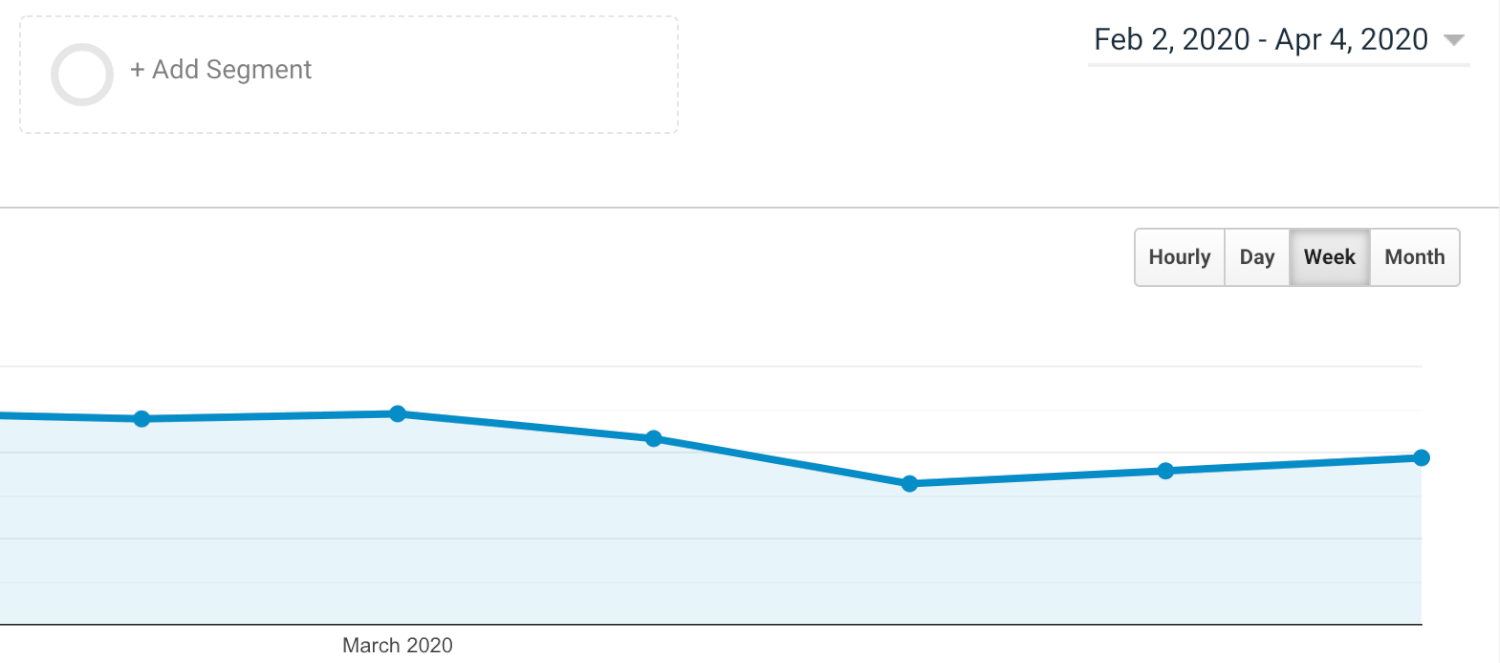
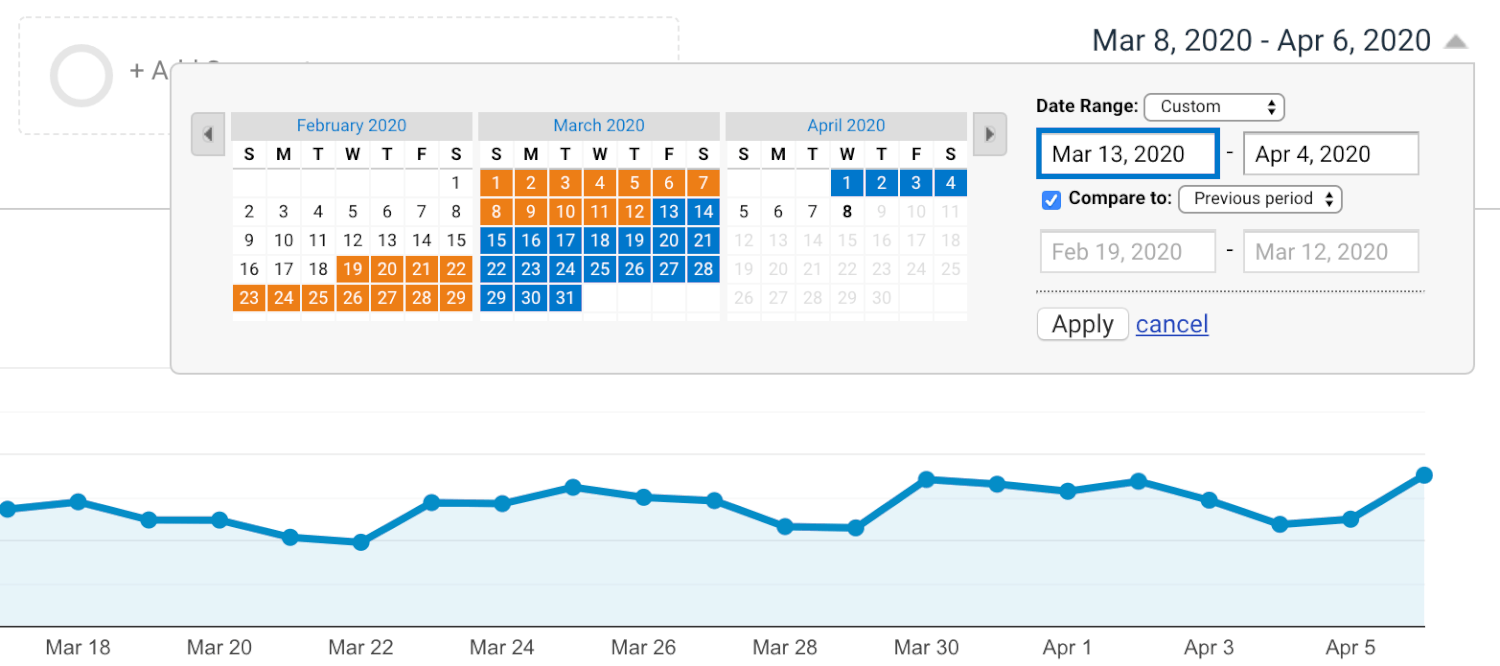
Once you have identified a starting point for the change in your report, you can now use this to adjust the date range. For my example, I will select 13 March to 4 April as the date range. I’m also going to select the ‘Compare To’ option in the date range selector.
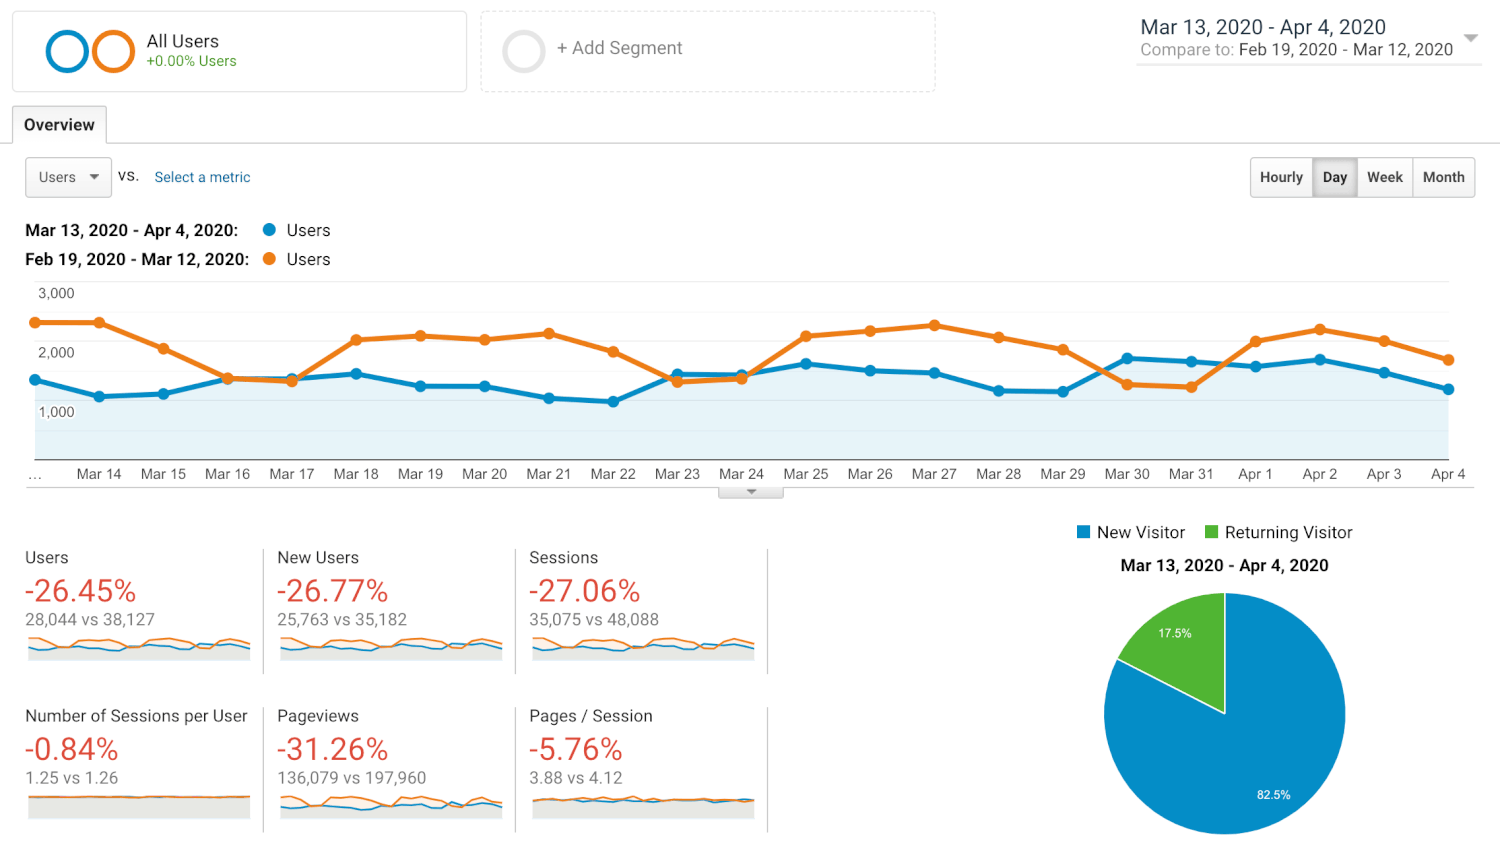
We can now see the differences between the date ranges shown for each of the metrics in the report. This tells us that the number of users for the website has dropped by 26.45%.
I also recommend changing the date range one more time to ensure that the trend isn’t seasonal. To do this, select the date range again and change the ‘Compare To’ option from ‘Previous Period’ to ‘Previous Year’.
Is it a limited or industry-wide trend?
Now that we’ve identified the change, it’s time to figure out if the trend is limited to our business and website or if it’s an industry-wide trend. To do this, we’re going to use Google Trends. For your organization, I recommend using a broad term for your research. For example, if you are looking after a website for a real estate agent, then you might want to enter ‘real estate’ into Google Trends. For the Google Merchandise Store, I’m going to go with something more precise since it’s a niche website. I’m going to enter ‘google merchandise’.
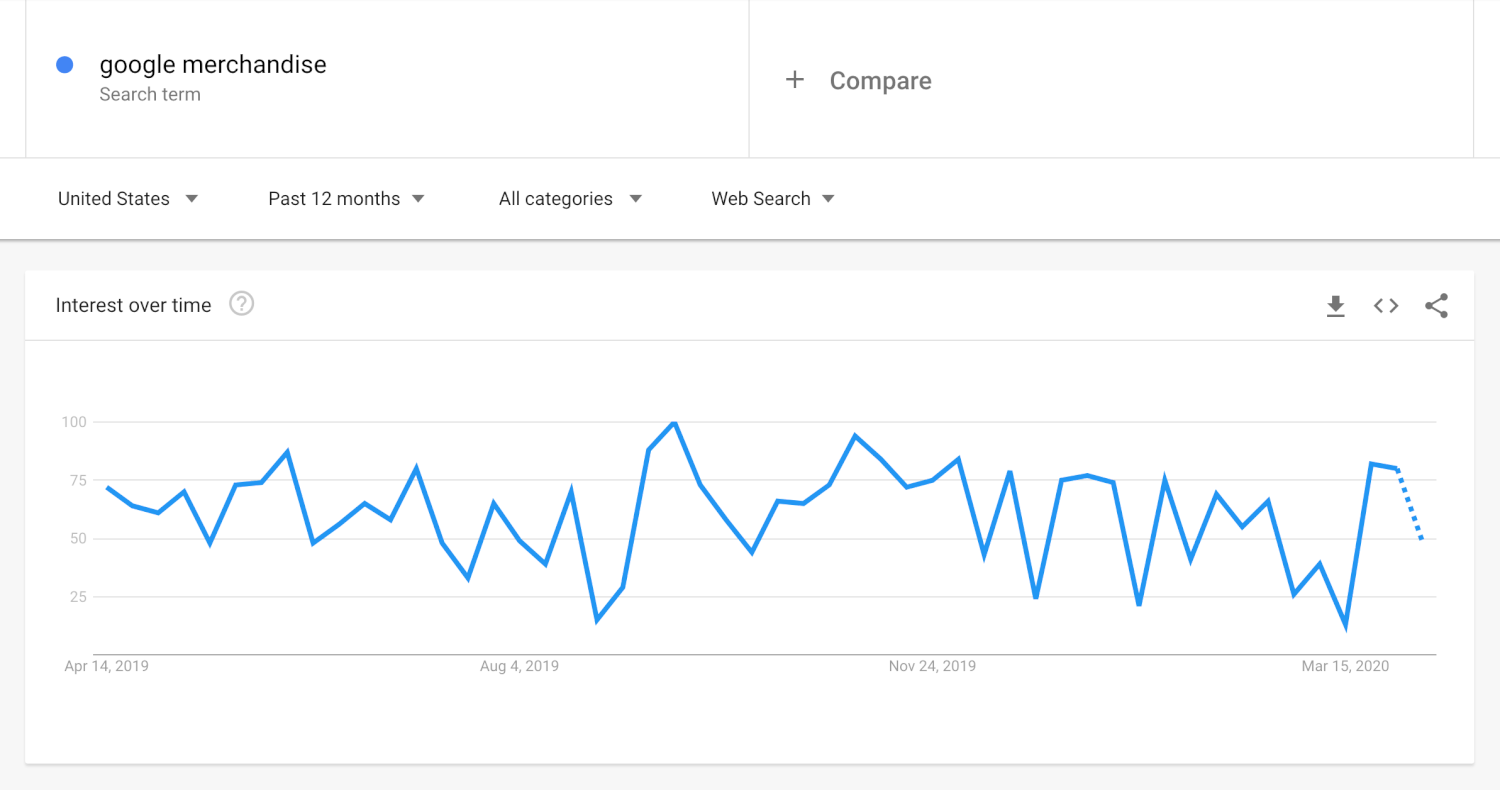
We can now see the trend for the search term. For this term, it looks like there might be a downward trend, but it’s a bit difficult to tell for sure. You might be able to see a clear trend for your term. I recommend changing the date range to the ‘Past 90 Days’ and then downloading the data to verify the trend in Google Sheets. To do this, select the download icon and a CSV version will be saved to your computer.
Using Google Sheets to calculate the change
Now we need to head to Google Drive and upload the CSV, so that we can use it in Google Sheets. After you’ve opened the spreadsheet, you will need to identify the cells that contain the same date range that you used in Google Analytics. For my example, this was 13 March to 4 April.
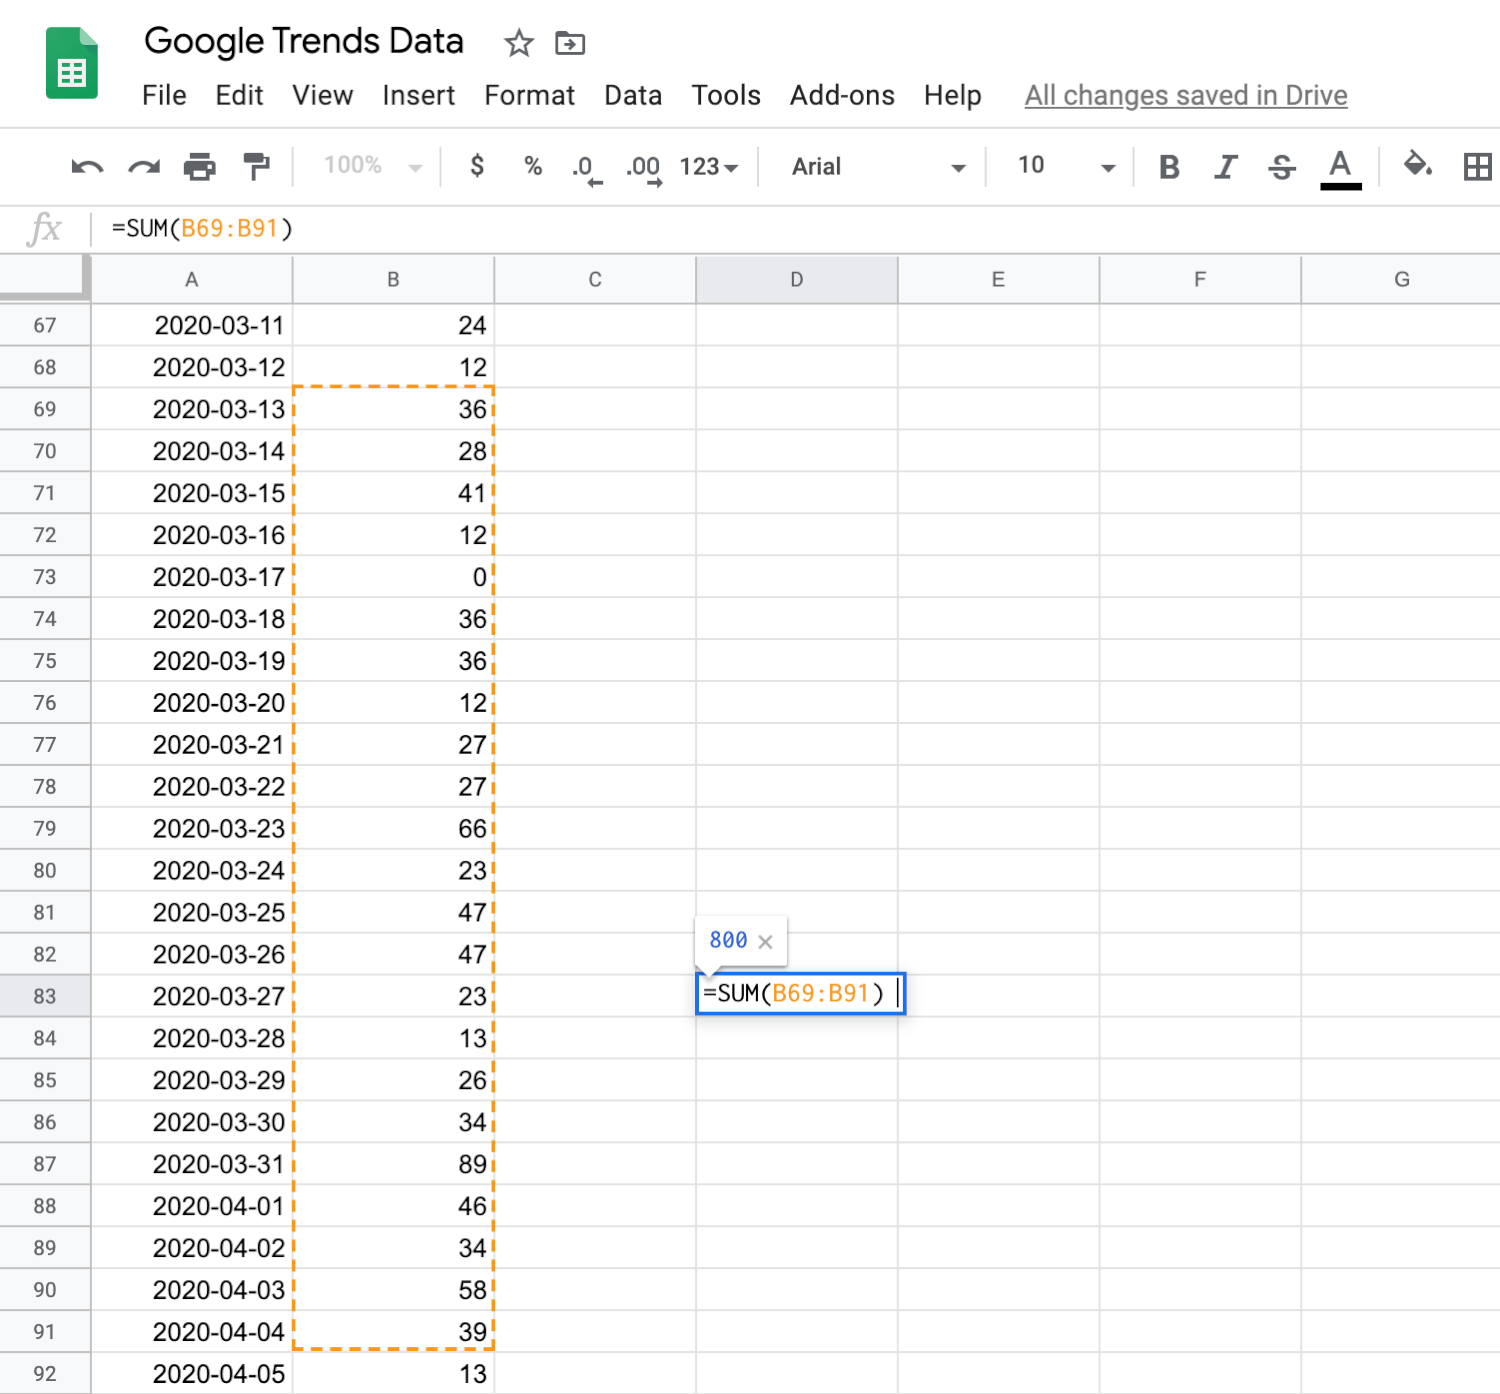
We can then add these values together and compare them to the previous period. This will be 19 February to 12 March. Once we have the total values for the two date ranges, we can then compare them. For my example, there is a 20.56% decrease.

Although this isn’t the same as the 26.45% drop we saw in Google Analytics, it does follow a similar pattern. It looks like the trend might be influenced by external factors and not just limited to our website.
Monitoring top-level trends
You can also use Google Trends to monitor overall interest in COVID-19. Here we can see a clear increase in people searching for ‘coronavirus’ in the United States. This also aligns with the decrease in traffic we saw in Google Analytics.

Take time to review the trend for the geographic locations of your audience. In the example above, we can see a decline in people searching. However, this trend might be different for your audience.
And while we’re looking at trends, two other resources you might want to check out are Google’s COVID-19 Map and Google’s Community Mobility Reports.
Conclusion
Google Analytics, Google Trends and Google Sheets can help to establish the impact of changing audience behavior on your website. While identifying and confirming these trends won’t alleviate any decrease you are experiencing, you will be in a better position to make decisions. And hopefully, soon, you will start to see an upward trend.


Comments