How to Use the Reports Snapshot Templates in Google Analytics
Benjamin Mangold
The Reports Snapshot in Google Analytics 4 (GA4) is your go-to dashboard for a quick overview of how your website is performing. Whether you're checking in daily or just need a quick glance before a meeting, the Reports Snapshot offers a high-level view of your most important metrics – and it's customizable using the Reports Snapshot Templates.
While you've always had the option of adjusting the cards included in the snapshot, Google has now introduced templates to make it quicker to get insights tailored to your business or organization.
If you're Reports Snapshot hasn't been customized yet, you will be prompted to choose a template, as we can see here:
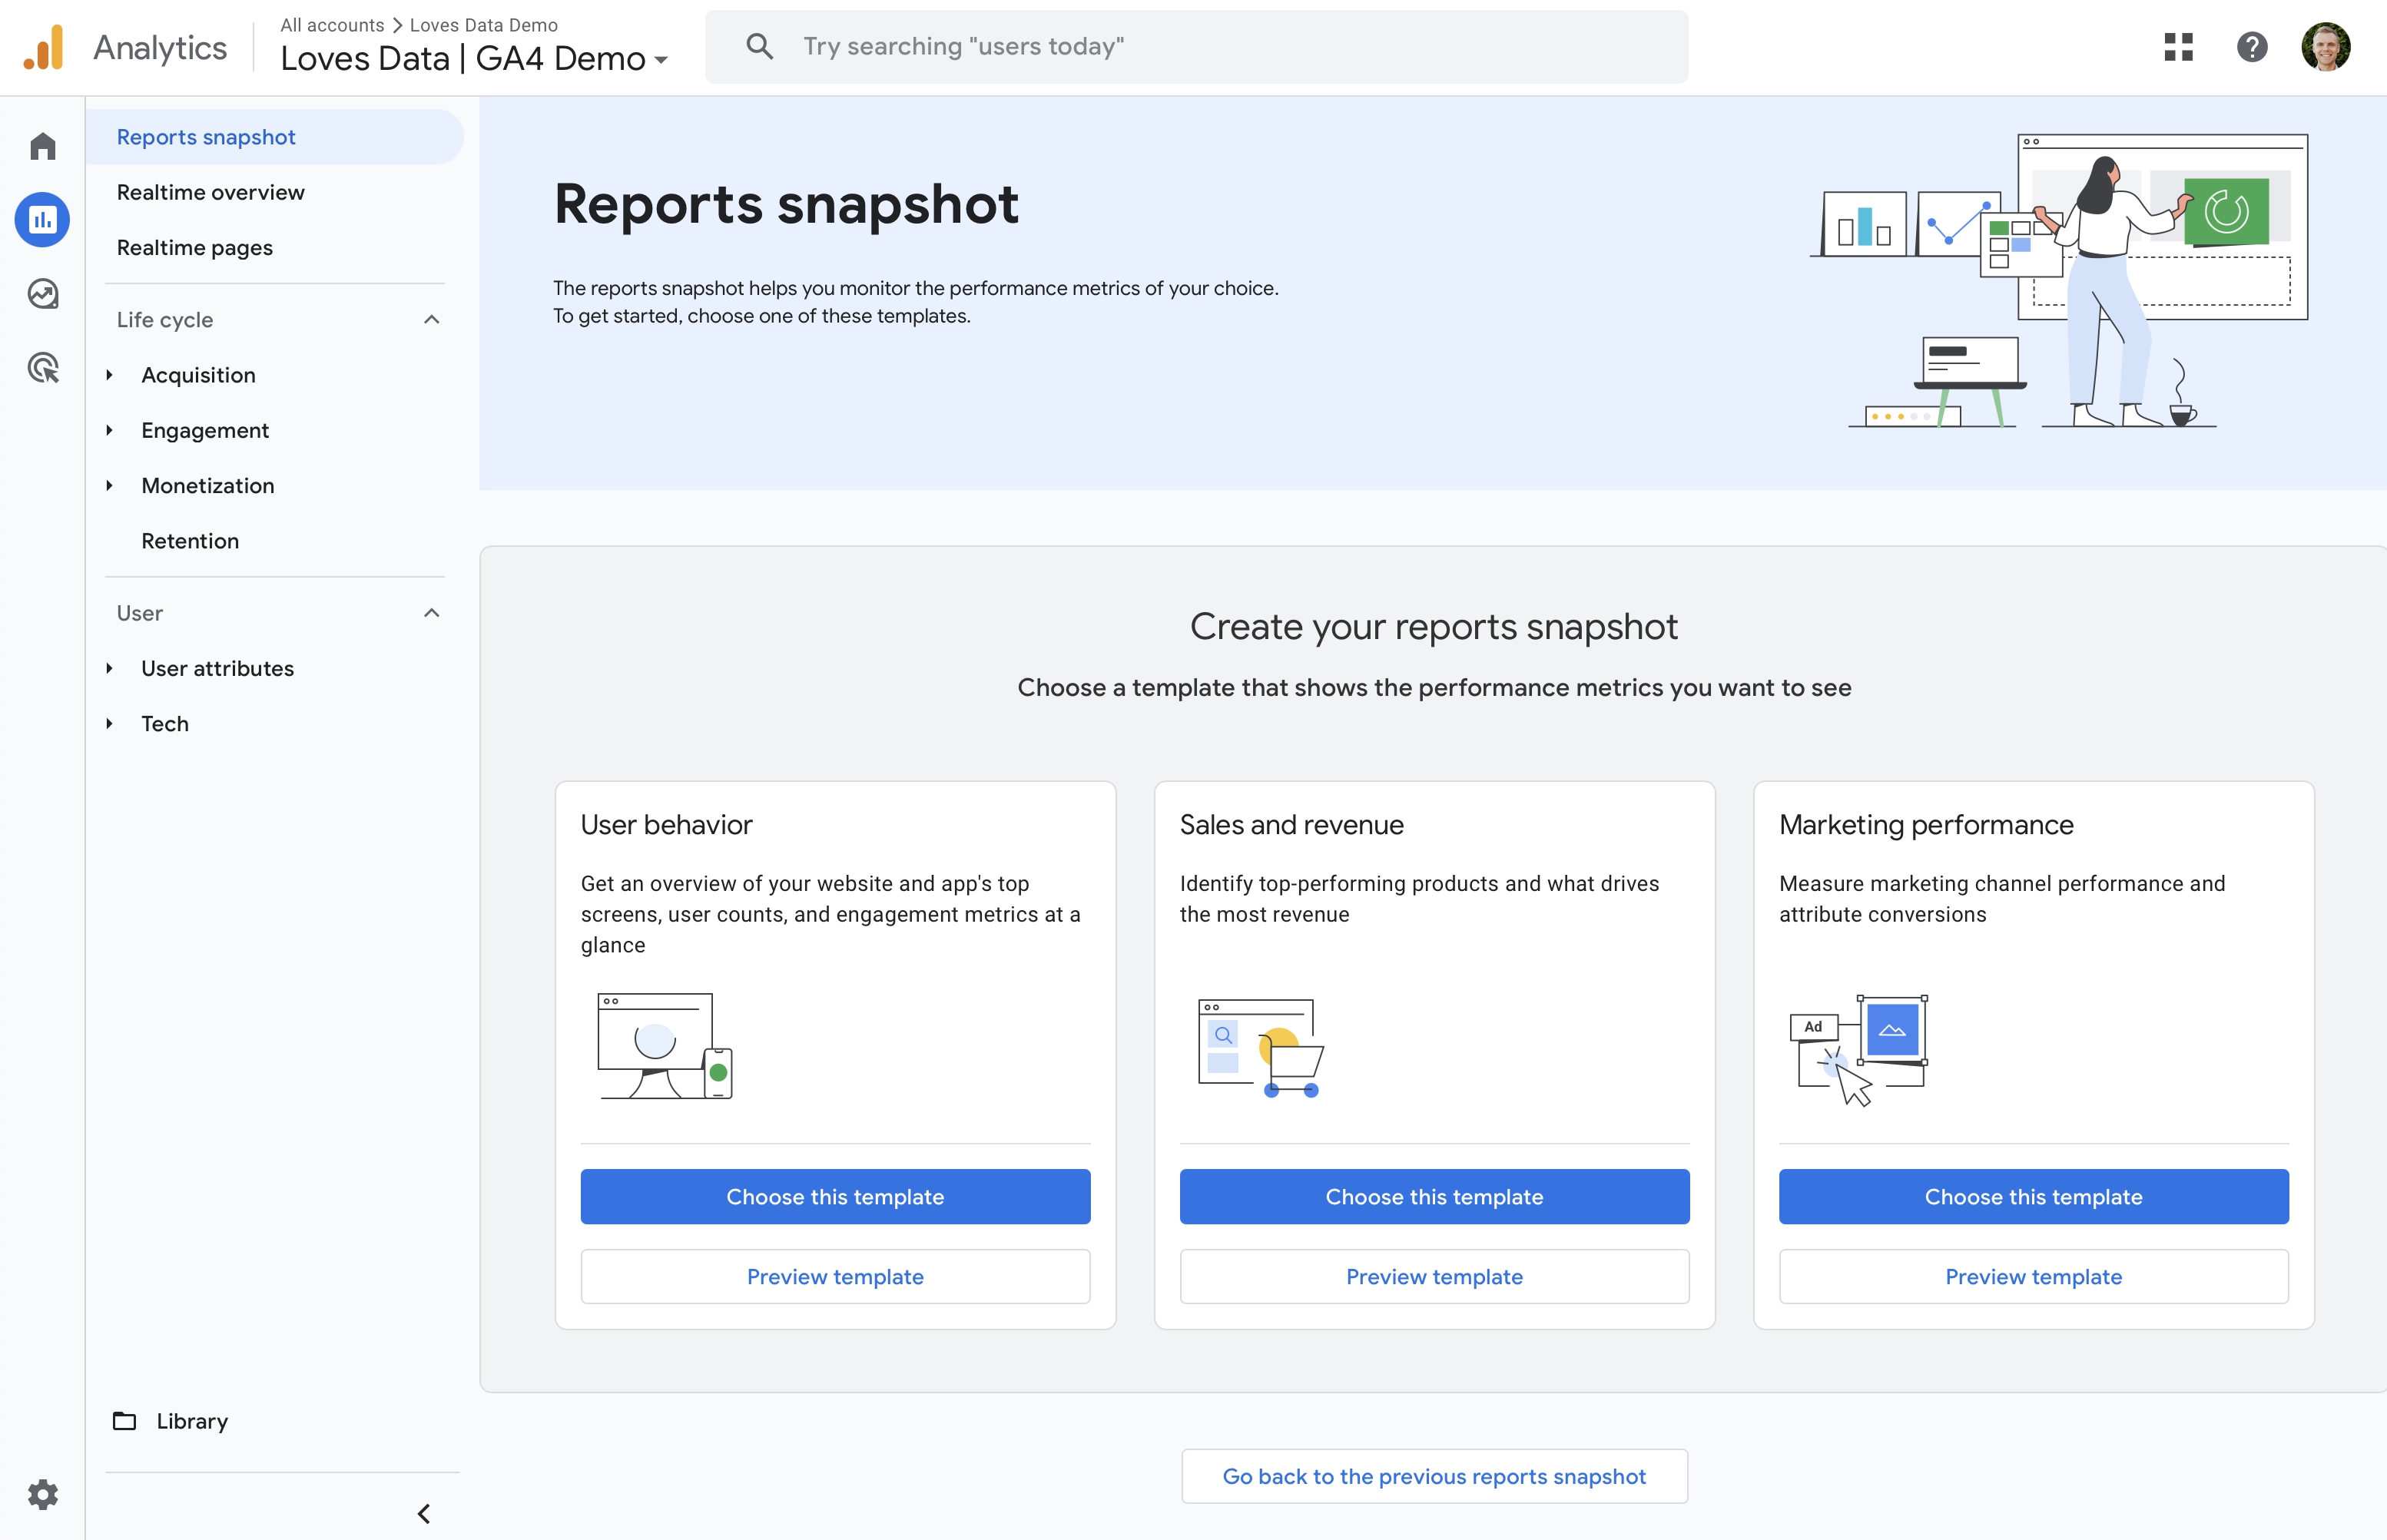
You can then choose from one of the following templates:
- User behavior which focuses on the number of users visiting your website, the content they view, how users find your website and details about your audience members.
- Sales and revenue which is all about ecommerce metrics and dimensions. This snapshot includes details about the items people purchase, how people find your website, and other revenue-based metrics.
- Marketing performance which presents how people find your website based on the source and mediums being used. You will also find metrics about the number of users and sessions in the snapshot.
Here's a demo account with the 'User Behavior' template applied:
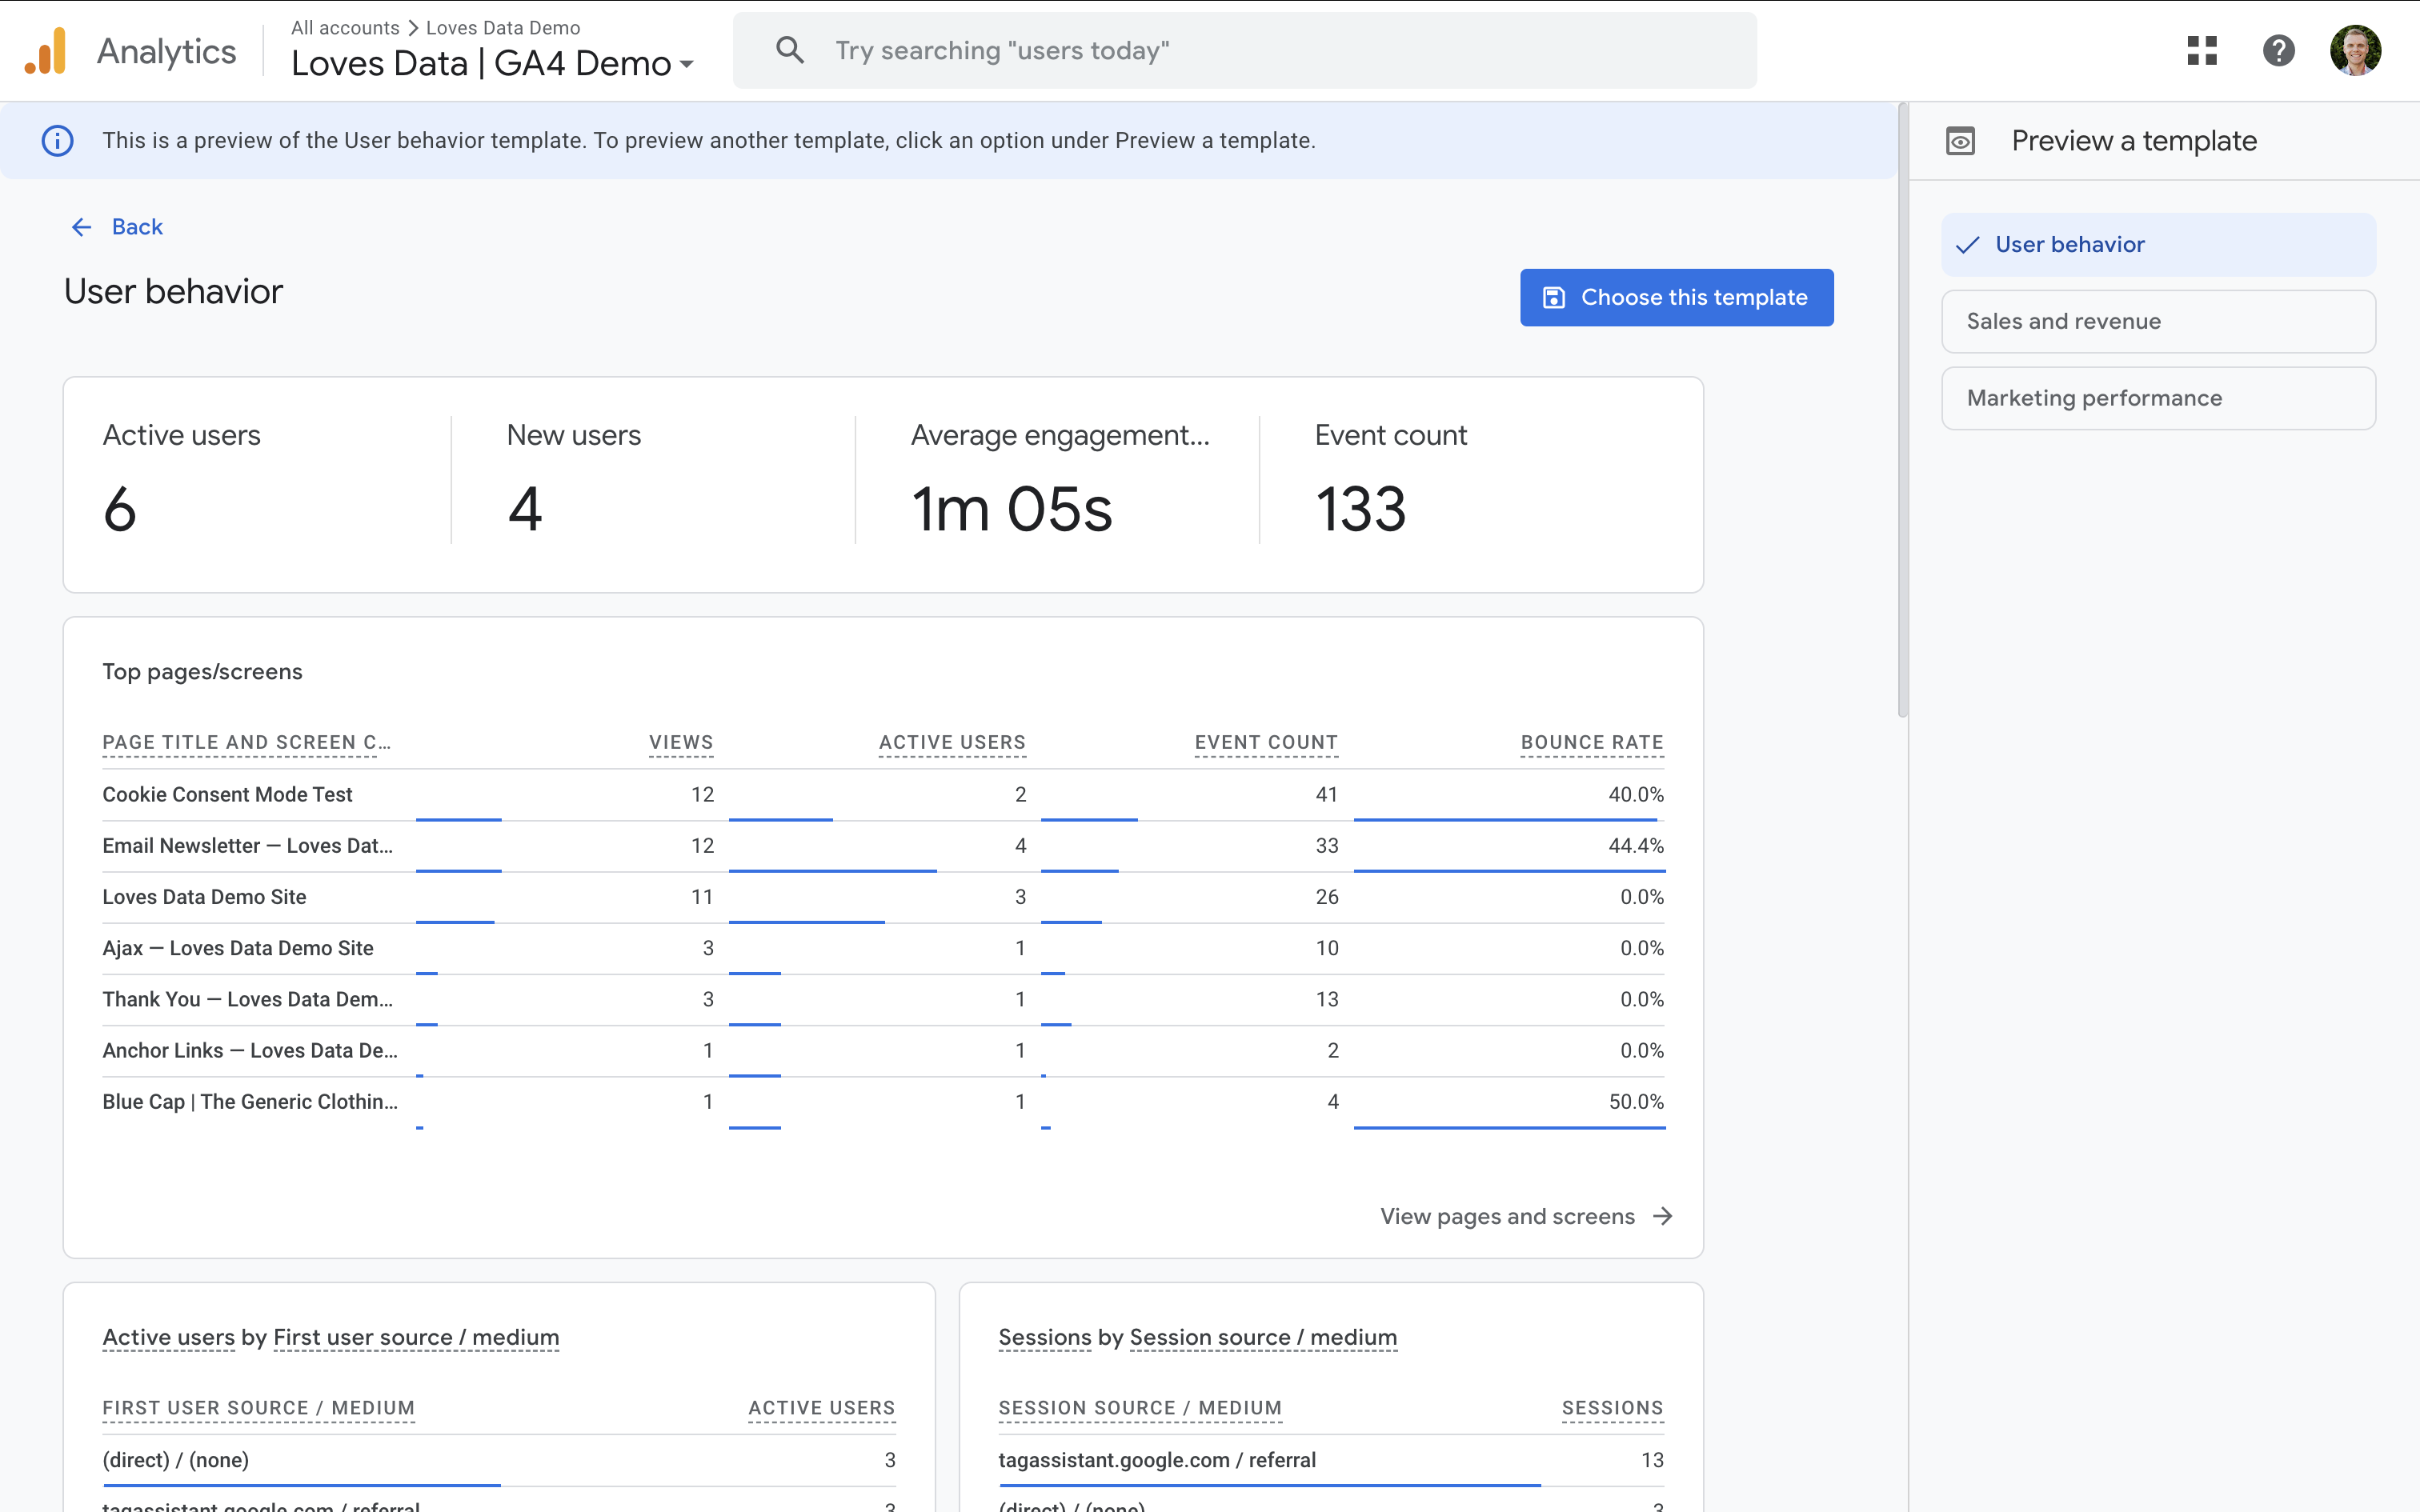
Apart from the available templates, you can also select the option to 'Go back to the previous reports snapshot' to get the previous, default version of the report.
When you open GA4, the default Reports Snapshot typically includes cards like:
- Users in the Last 30 Minutes – Real-time user count and source breakdown
- New Users – How many new users you’ve had over time
- Top Campaigns – Which marketing campaigns are driving traffic
- Top Pages and Screens – Most viewed content on your site or app
- Events by Event Name – A list of the most triggered events
- Key Events – Overview of your key events used to track conversions
These cards give you a solid overview, but the real power comes when you start customizing.
What Is the Reports Snapshot?
The Reports Snapshot is the first screen you’ll see when you navigate to the 'Reports' section of Google Analytics. Think of it as your top-level reporting summary. It includes a number of different cards showing details about your traffic, engagement, conversions, and more.
This overview can help answer questions like:
- How many users have visited the website recently?
- Where are users coming from?
- What pages are performing best?
- Are key events (conversions) are trending up or down?
Customizing Your Snapshot
As we've already touched on, you can customize the Reports Snapshot. You can adjust it to focus on the metrics and dimensions that matter most to your business. To edit your snapshot you will need administrator or editor permission for the property. You can then follow these steps:
- Navigate to 'Reports' and then 'Reports Snapshot'.
- Click the icon to customize the report (the pencil icon in the top-right corner).
- Use the editor to add, remove, or reorder cards.
- Each card can link to a detailed report, so think about what you want to drill into quickly.
- Click 'Save' once you’re happy with your changes.
Tips for an Effective Snapshot
- Focus on KPIs – Include cards that reflect your goals: conversions, engagement, revenue, etc.
- Keep it concise – Aim for clarity. The snapshot isn’t the place for deep analysis – it’s for quick insights.
- Use it in meetings – It’s a great screen to share during team check-ins or client calls.
Sharing Insights from the Snapshot
While the Reports Snapshot itself can’t be exported directly as a PDF or shared via email, each card links to a deeper report that can be shared. To share insights:
- Click on a card to open the full report.
- Use the Share icon in the top-right to copy a link or export the data.
Final Thoughts
The Reports Snapshot is a great way to monitor your data at a glance, catch trends early, and stay informed without diving deep into every report. So next time you log in to Google Analytics, take a moment to customize the snapshot for your needs.
Comments