Google Analytics Dashboards
Loves Data
Using Google Analytics 4 (GA4) Exploration Reports
You can use exploration reports in Google Analytics 4 (GA4) to create custom dashboard-style reports. In this article, we will look at how GA4 Exploration Reports allow us to create simple reports through to more in-depth reports to analyze our GA4 data in further detail to understand trends in user behavior, event insights, sales performance, and more.
While you can use Looker Studio to create custom dashboards and reports using your GA4 data, these reports typically take more time to create and configure than Exploration Reports. Exploration Reports have defined limits, which can make them quicker to create.
Since Exploration Reports can be customized, you can use them to report on the data and information that is most important to your business or organization. For marketers, this might be a dashboard-style report that shows the performance of marketing campaigns, while software developers might want to understand the performance of technical aspects of the website and mobile apps.
Exploration Report Techniques and Templates
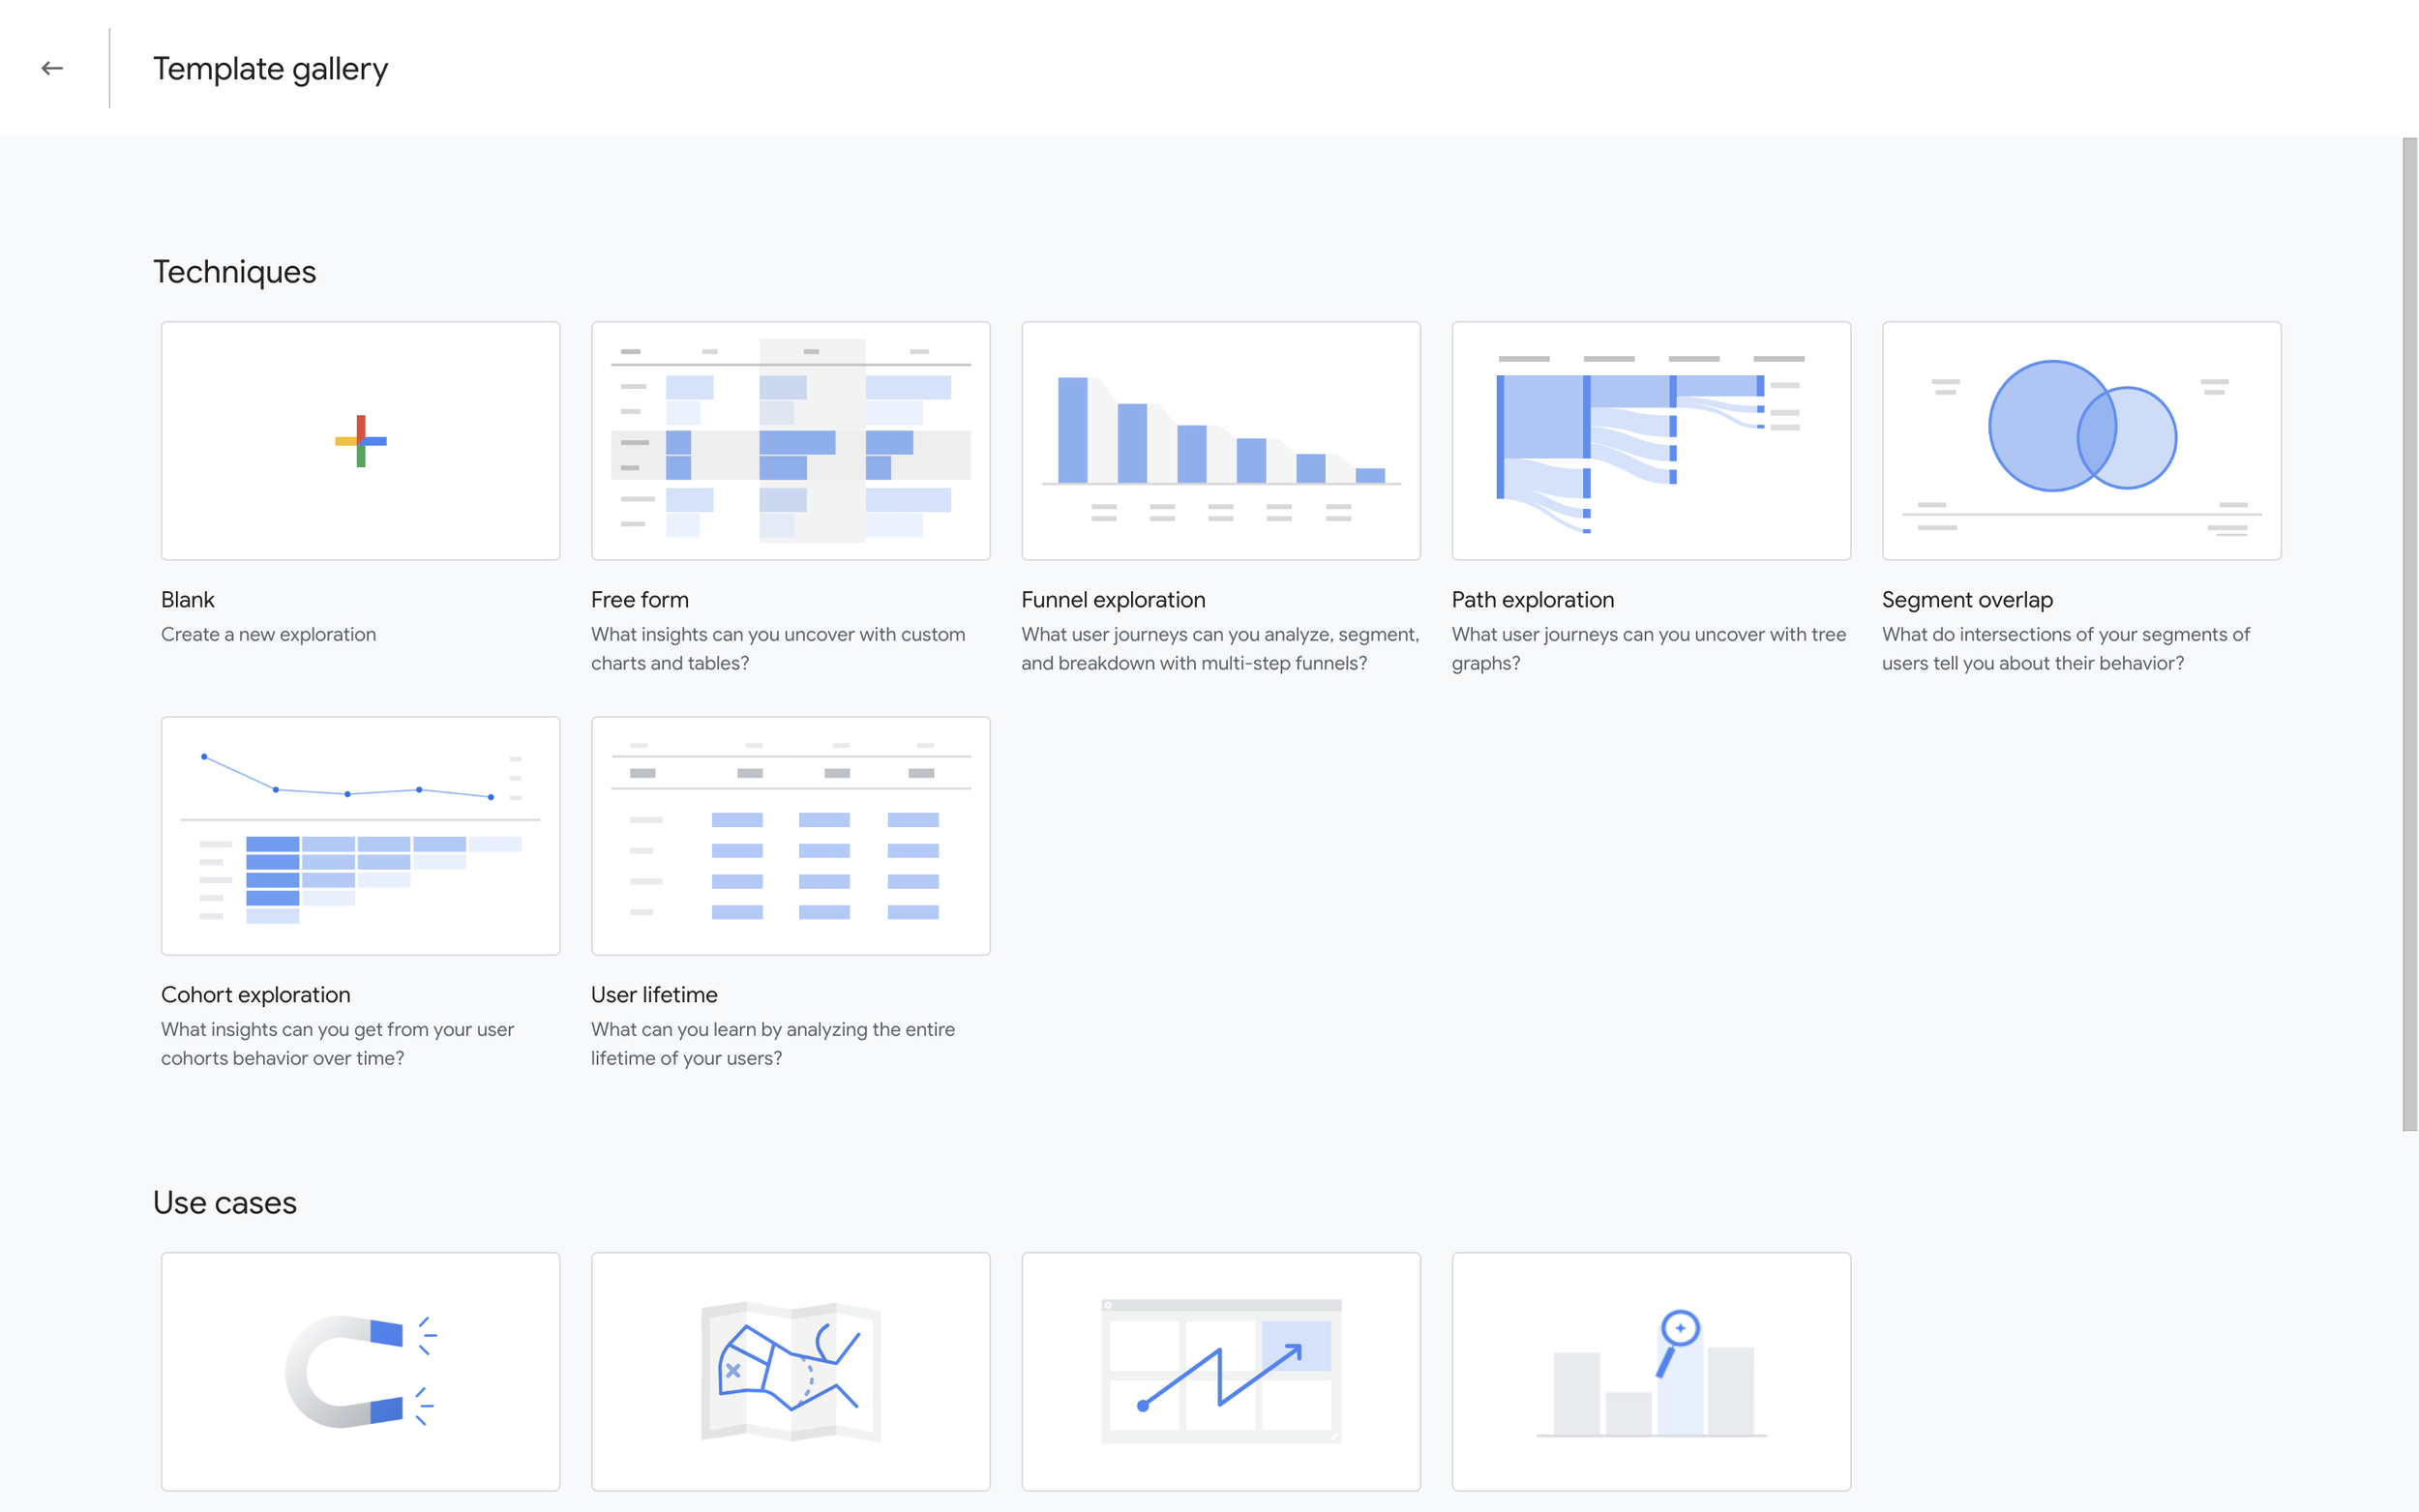
GA4 Exploration Reports can consist of multiple tabs and different techniques. There are eight different types of techniques listed on the template gallery:
- Blank: This creates an entirely blank exploration. Free-form is selected as the default technique.
- Free-form: This technique allows you to create six different types of visualizations and is the most commonly used Exploration Report. If you select it, it will create a table by default. But you can also create tables with heatmaps or bars, donut charts, line charts, scatterplots, bar charts, and geographic maps with bubbles.
- Cohort exploration: This technique allows you to create cohort tables with heatmaps. It is especially useful to observe user retention.
- Funnel exploration: This technique allows you to view details of different steps of your funnel in a visualization with bars. While this technique is especially useful for ecommerce sites, it can be used to analyze any funnel, including lead magnet funnels with multiple steps, such as forms.
- Segment overlap: Using this technique, you can analyze the users in different segments. This allows you to see if users are included in one or more segments at the same time. The chart is interactive, so you can analyze different parts to compare users and use different breakdowns to dive deeper into your audience.
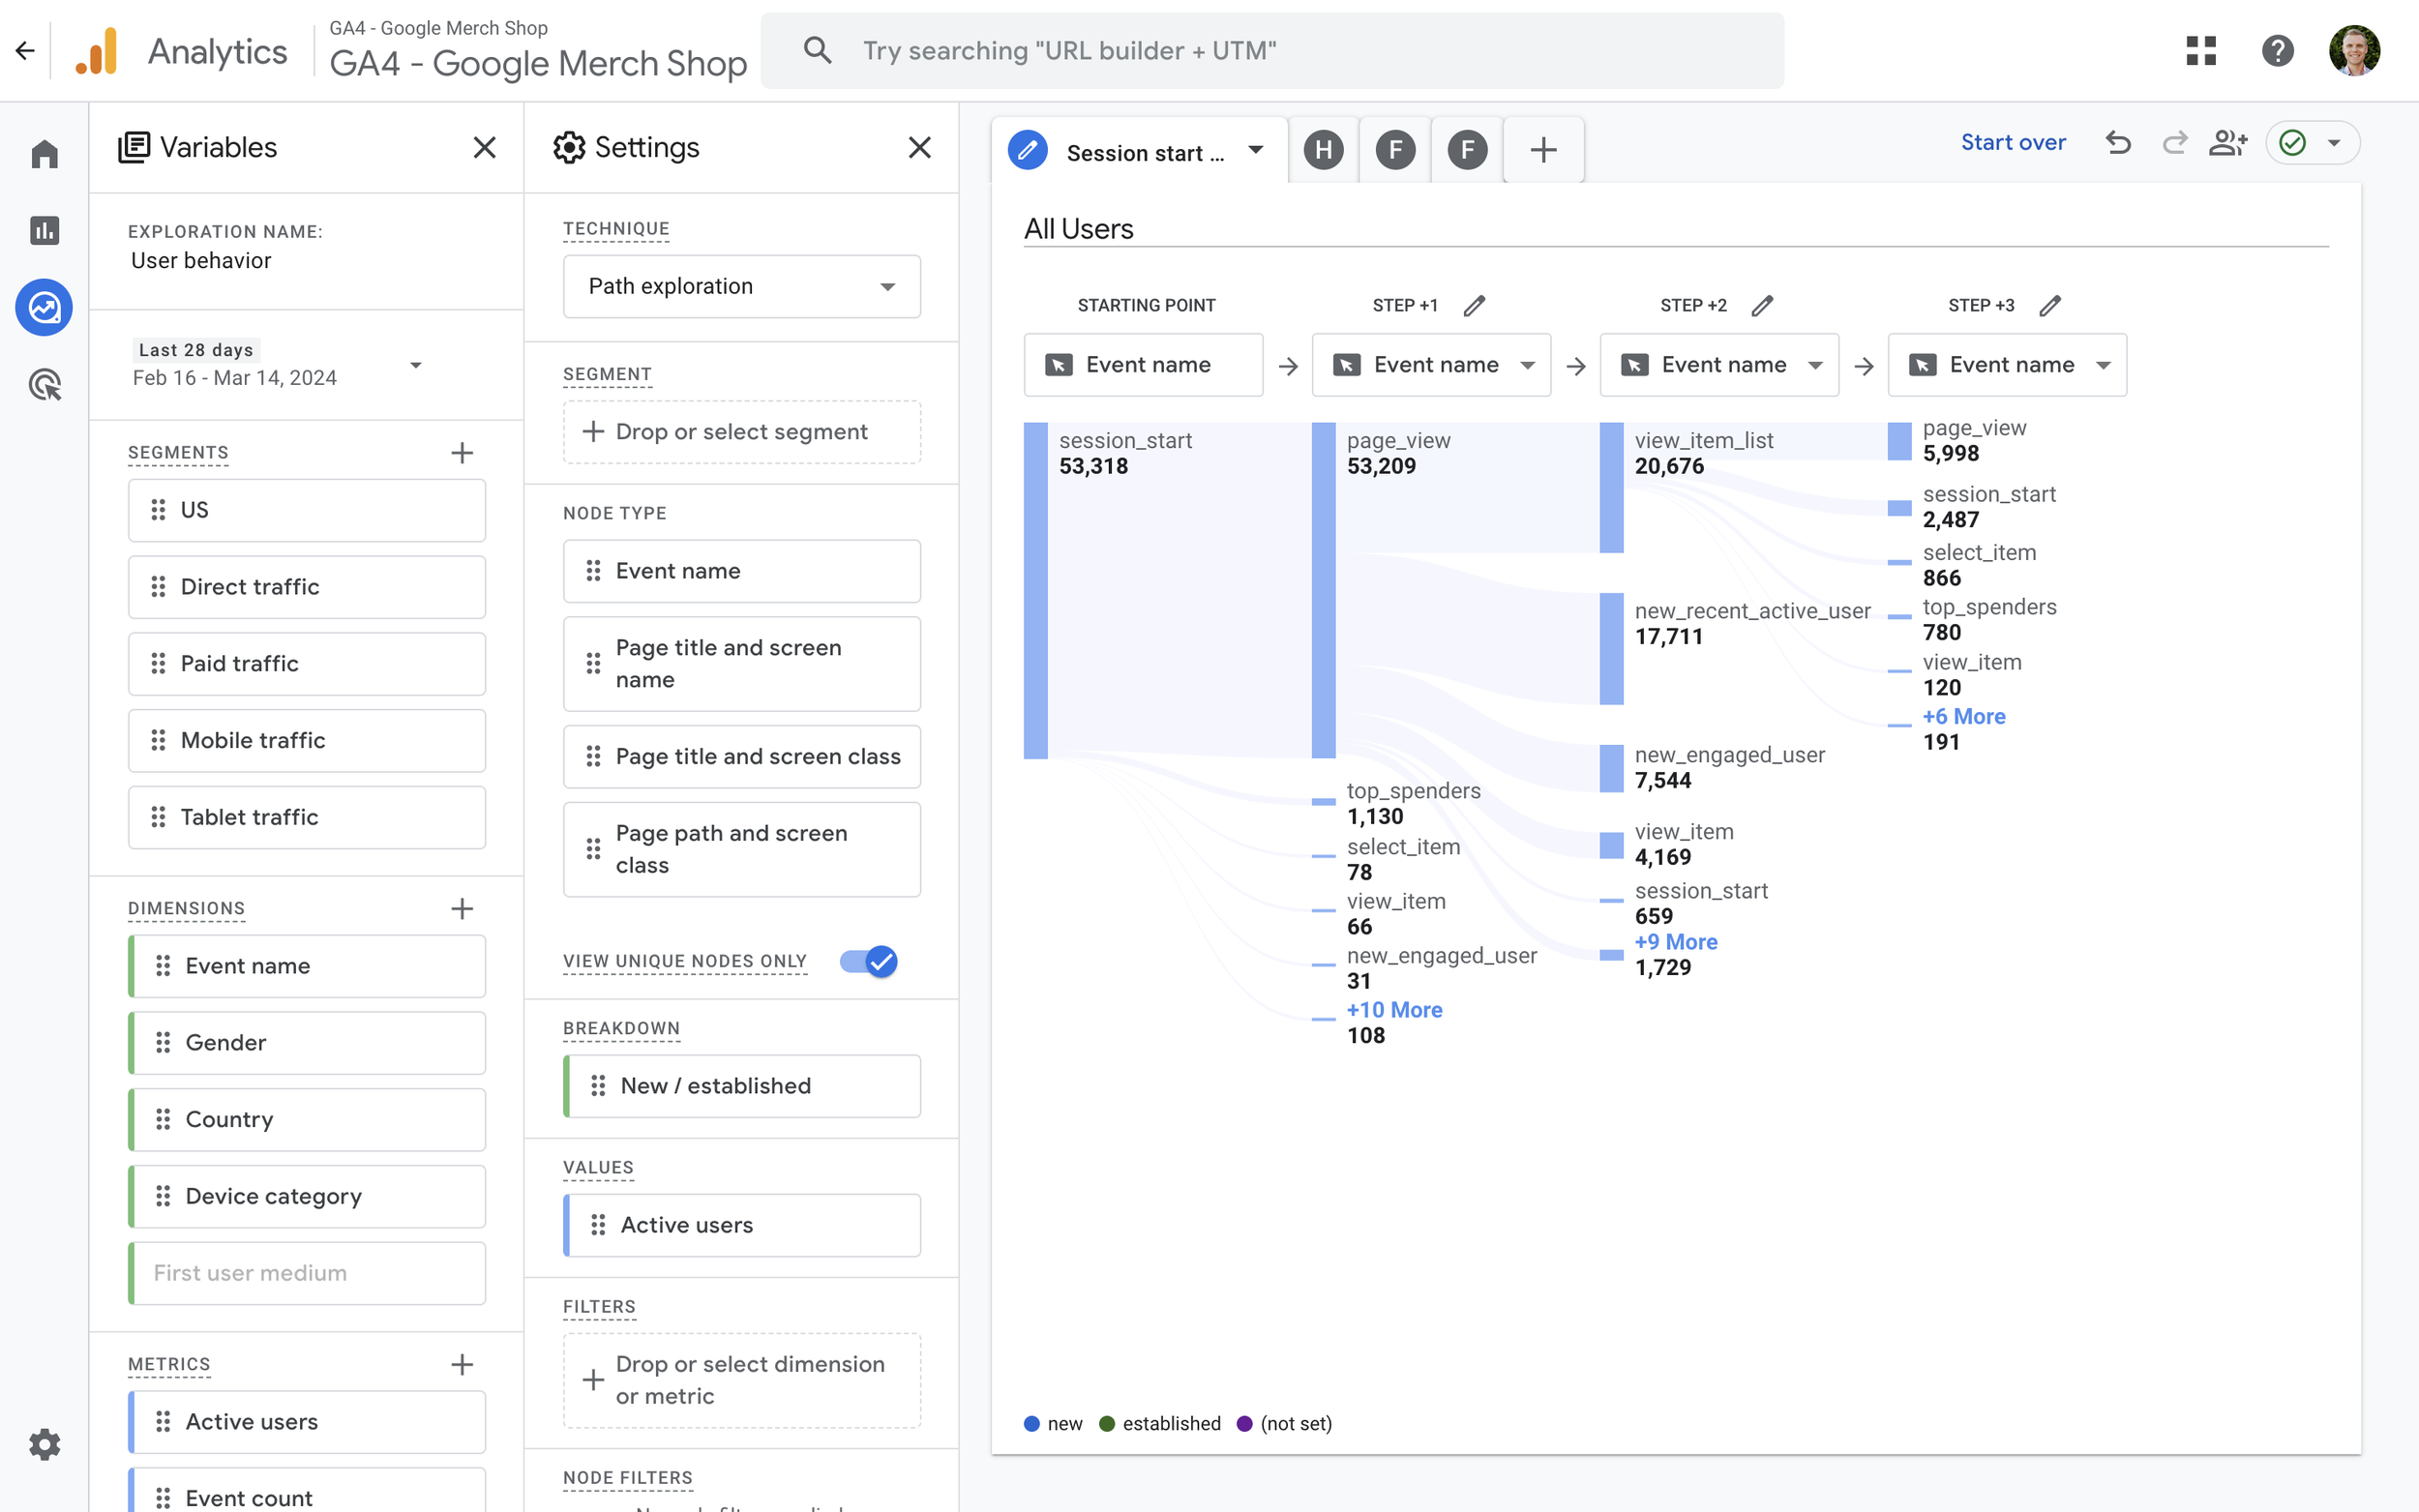
- Path exploration: This technique allows you to see what paths your users are following step by step. By selecting the option to ‘starting over’, you can select either a starting point or an ending point. Then you can dive deeper by clicking on any value of the steps that appear. This technique is useful for understanding what actions users are taking after landing on a specific page or triggering a specific event.
- User explorer: This technique allows you to see all of the different user identifiers collected into your reports. You can then drill-down on individual users by clicking on any of the IDs listed in the table. While the report is designed for granular insights, it’s fairly limited in its application since the values of default dimensions are not included in the report.
- User lifetime: This technique allows you to create tables that contain insights about the total lifetime values for your users. For example, you can report on the total average lifetime value of your users.
TIP: If you’re just getting started with GA4 exploration reports and want to explore more examples, you can select ‘Template Gallery’ to see all of the available templates.
Creating Exploration Reports
Now that we’ve looked at the types of exploration reports you can create in Google Analytics, let’s cover important concepts when creating and modifying reports.
The steps you take will depend on the type of report you’re creating, but for most of the reports you will need to select the dimensions and metrics you want to use in the report and then add them to the report as rows and columns. To do this, you will use the ‘Variables’ and ‘Settings’ sections in Google Analytics.
Exploration Report Variables
On the left hand side of your exploration report, you will find a section called ‘Variables’. This section contains the variables or elements that are used to build your report. This includes the date range, segments, dimensions, and metrics. This is also where you can rename your exploration report.
Changes made to the elements in this section will apply to all tabs in the exploration report. For example, the date range and available dimensions and metrics will apply to all tabs of your report.
If you want to filter one or more tabs included in an exploration report, you can use the available dimensions and metrics or create segments and apply them to different tabs. Segments are similar to audiences and if you would like to learn more, we recommend reading our guide to GA4 Audiences.
Exploration Report Settings
You will also find the ‘Settings’ section next to the ‘Variables’ section in your exploration report. This section contains all of the settings for the selected tab and allows you to control how the elements from the ‘Variables’ section are used in the report. For example, you can add dimensions as ‘Rows’ in your report, add metrics as ‘Values’, adjust the number of rows, create filters, and more.
Changes made in the ‘Settings’ section will only apply to the current tab and will not affect any of the other tabs in your exploration report.
Note: You might not be able to use all of the dimensions and metrics you’ve enabled in one tab. This can be for a number of reasons. Some dimensions and metrics are not compatible with one another in Google Analytics. For example, we can’t combine ‘Item Name’ with ‘Total Revenue’ because the item-scoped dimension doesn’t combine with the event-scoped metric.
While some dimensions and metrics cannot be combined based on the type of exploration report being used. To prevent dimensions and metrics from being combined, they will be grayed out as we can see in this example:

In the example above, we cannot use the ‘Event Name’ dimension because we’re creating a User Lifetime Exploration report and there are only specific user lifetime dimensions and metrics we can include in the table.
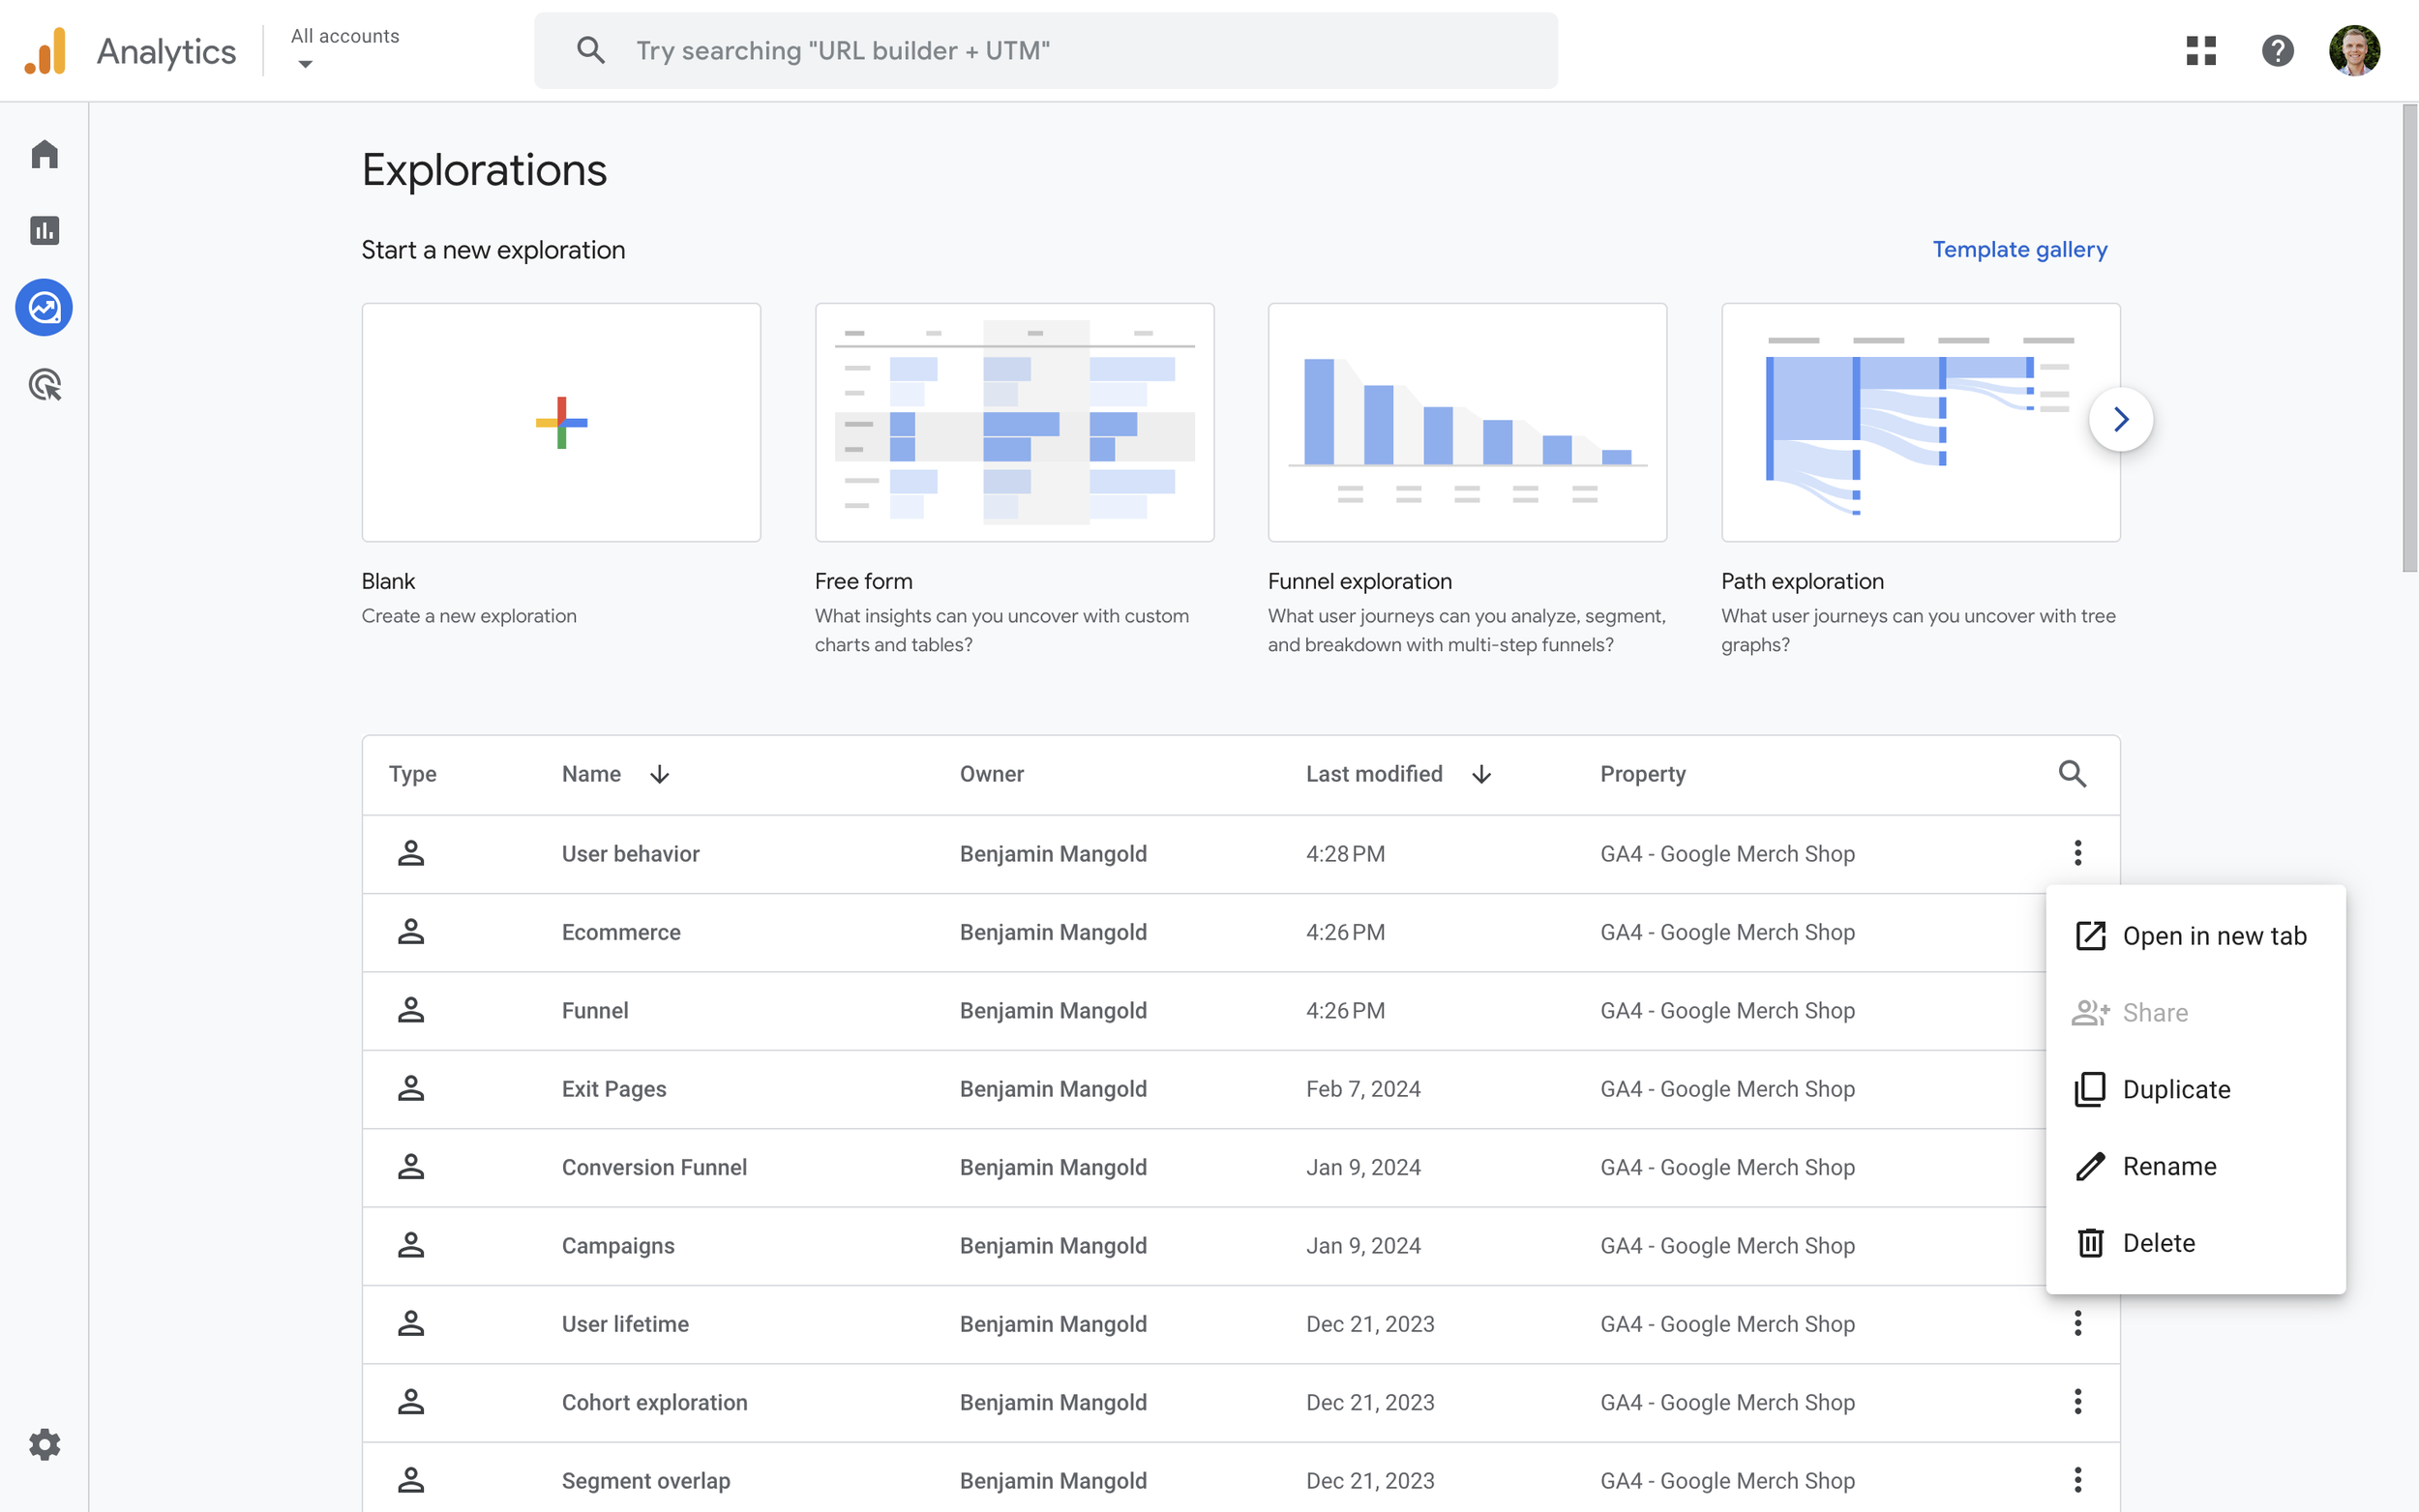
Sharing Your Exploration Reports
You can find the sharing options for your explorations reports on the top right corner of the interface. Sharing options allow you to:
- Share the report with other users who have access to the Google Analytics property.
- Exporting the report to Google Sheets or downloading the report as a CSV or PDF.
To share the exploration with other users added to the property, simply click the ‘Share Exploration’ icon and select ‘Share’.
Tip: When you share your exploration report with other users who have access to the property, all other users who have read-level permission or higher will be able to access the report. They won’t be able to edit the report. To be able to edit the report, people can simply duplicate the shared report from the list in the ‘Explore’ section.
Conclusion
Exploration reports provide a customizable, dashboard-like experience that lets you dive deeper into your data. You can mix and match dimensions and metrics across different scopes – including user, session, event, and item – marketers and analysts can tailor their reports to uncover unique insights that standard reports might overlook.
You can create personalized reports that help answer your specific business questions, allowing for a more nuanced understanding of user behavior and site performance. And the interactive nature of exploration reports in Google Analytics encourages users to experiment with data and how data is visualized, providing a more dynamic and exploratory approach to analytics.


Comments