5 ways to turn your Google Analytics data into awesome dashboards
Loves Data
In this post you’ll learn five ways to present your Google Analytics data. We’ll start with some important basics (like using the dashboard options built into Google Analytics), before we dig in a little deeper and look at some more technical ways that you can create custom dashboards.
Here’s exactly what we’ll cover. Feel free to skip to the topic you’re most interested in:
- Dashboards directly within Google Analytics
- Using Google Data Studio
- Using the Google Sheets add-on
- Filtering data within dashboards
- Combining data sets within dashboards
There are a few things that you should consider before jumping in to create your next dashboard. We need to really step back for a moment, and think about what sort of business, or organization, or question are we trying to answer with our dashboard. Ask yourself:
What is the REAL purpose of this dashboard?
WHY am I going to create this dashboard?
How will this dashboard HELP me?
You don’t have to get all deep and meaningful on me. I don’t even think you should take too long answering them – a minute is totally fine. The main thing here is to really make sure that your dashboards have a focus and that they’re not going to turn into a data puke (to quote my friend, Avinash).
Here are four starting points I recommend to get you thinking. These are four common areas that are definitely suited for creating your dashboards:
- Conversions: I'm not sure about you but I certainly like to understand the conversions that are coming in from my website. Having a nice concise dashboard where I can see the total number of conversions at a glance is super helpful. You might want a dashboard that combines a number of different conversions (including ecommerce) or you might want one that is more focused. For example, a dashboard that just shows you conversions coming from your AdWords campaigns.
- Marketing: If you’re looking after marketing then you’ll definitely want a dashboard to understand how your campaigns are performing. This might include your email campaigns, organic search, paid search and other campaigns. Your dashboard might include a combination of top-level marketing channel performance combined with more granular campaign details.
- Technical: For anybody looking after more technical components of maintaining and optimizing your website, then a technical dashboard is a must. This can include elements like the loading time of your pages and the breakdown of devices people are using to view your website.
- Engagement: Maybe If you’re in the world of content marketing or branding, then a dashboard where you can see your most influential and popular content will help you fine-tune your efforts and give you quick insights into what’s working.
Now I’m hoping you’ve had some ideas for your perfect dashboard, it’s time to jump in and look at how we can get your data into shape!
#1 Creating dashboards directly within Google Analytics
First off let's look at creating our dashboard directly within Google Analytics. This is a really great option for creating dashboards, especially if you want something that you can make quickly. Now I know some people might say they’re not flexible enough, they’re not really that custom or some other argument. That’s totally fine. I get it. But I find for a lot of cases the in-built Google Analytics dashboards are awesome and meet a lot of really fundamental dashboarding needs. So I love them.
These dashboards are made up of widgets. Now widgets do have some limitations for more advanced users and there is a maximum number of widgets you can add to each of your dashboards. You've got a couple of options here. You can certainly just create a new additional dashboard inside Google Analytics, or you could potentially use one of the other options we are going to look at in this post. For example, Google Data Studio.
Let's have a look at the different widgets that are available.
Inside Google Analytics, we basically have standard widgets which present historical data (just like you see inside your standard Google Analytics reports). But there is also the option of including real time widgets, which show you what's happening on your website right now.
You can see with standard widgets we can add in a metric, which is like a straight number. You can add in a timeline which includes a trend line. You can add in a map, a table, a pie chart, or even a bar chart. With the real time widgets it's a little bit different. You can add in a metric, a timeline, a map, or a table but there is no pie or bar charts.
#2 Using Google Data Studio to create dashboards
Next up, let’s look at Google Data Studio. Data Studio is a brand new... It's the newest dashboarding option from Google, and it's really great. It’s the next step up from the in-built Google Analytics dashboards. It's not quite as straightforward to get up and running as the Google Analytics option that we just looked at but it's very flexible, and once you have a bit of a play with it you'll be up and running in no time. It's really awesome.
Google Data Studio allows you to create dynamic dashboards. This means you can create your dashboard, but allow people to modify the date range and even add filters to the reports.
The other awesome thing about Data Studio is that you can actually include multiple data sources. Google currently supports a whole range of sources. This includes Google AdWords, Google Analytics and Google Sheets. You can also feed in additional data, so you can also pull in YouTube analytics data from your YouTube channel, data from your own databases (MySQL and Google Cloud SQL), and for those of us lucky enough to have Google Analytics 360, you can pull in Big Query and Attribution 360 data as well.
Things you should know about Google Data Studio:
- For the standard version (which is the free version) of Data Studio you can create up to five reports.
- You can create up to 100 pages per report.
- Data Studio is screen and print friendly, but unfortunately, there's not a PDF download option currently. However, if you do hit print on the particular page, it is print friendly, and you can save each individual page as a PDF.
- You can collaborate on the creation of your dashboards and share your dashboards with other people who have a Google login (just like documents in Google Drive).
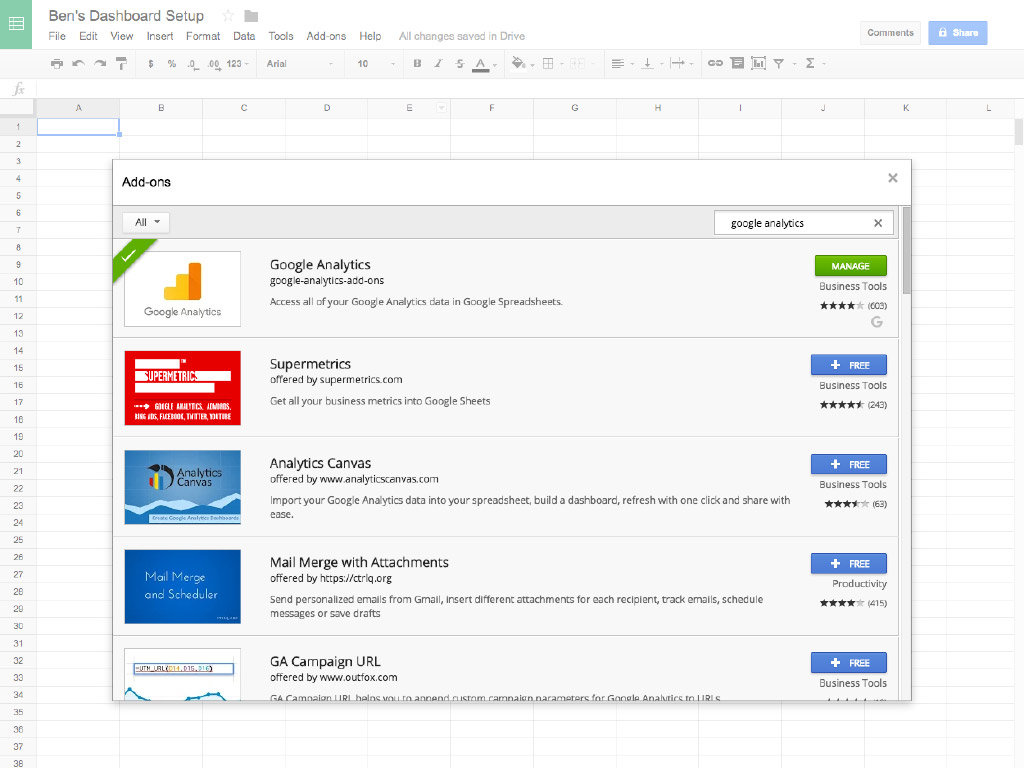
#3 Using the Google Sheets add-on
Next up, we have the Google Analytics add-on for Google Sheets. This is a little bit more technical. It’s the next level up. Using the add-on you can pull data from one or more Google Analytics accounts and then represent the data once it’s inside Google Sheets. You can use all of the data visualization options available within Sheets.
#4 Filtering data within dashboards
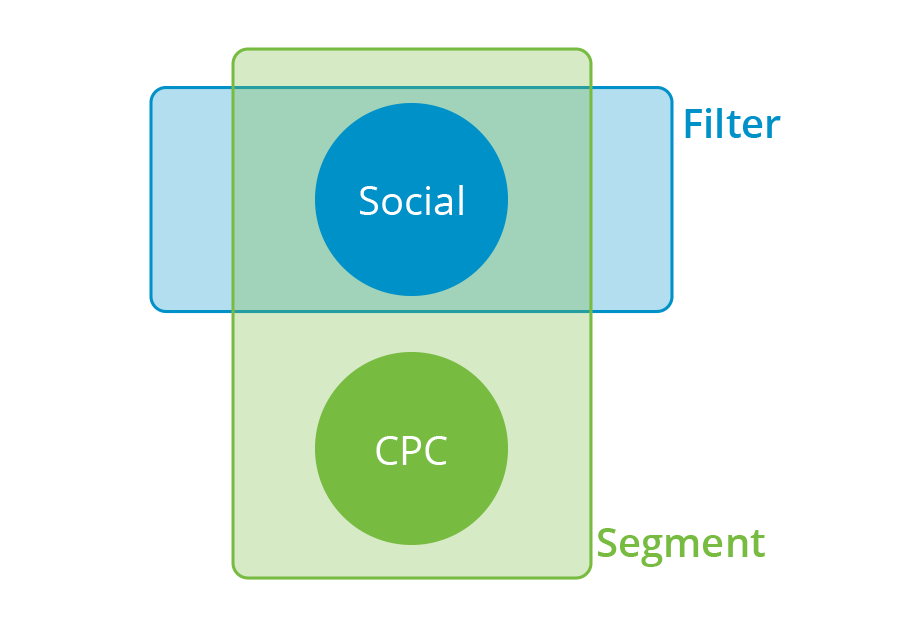
There are two ways to think about modifying the data that you are seeing within your dashboards. You can use segments, or you can also use filters. Let's have a look at the difference.
Imagine for a moment that someone comes into your website, and the first time they find your website they've come in from a social network. Let's say they've clicked on a Tweet that links to your website.
They then leave your website, maybe a few days pass, and they click on one of your ads running on Google. Now they’ve come in from your CPC (Cost Per Click) campaign.
So far, this person has come in from social, and then from your CPC campaign.
If you just want to focus on one of these touch points, let’s say the traffic source of Twitter, then I'd recommend starting with a filter because the filter will narrow the focus on that individual channel.
On the other hand, if you really want to see the whole picture, including all the different touch points, then I'd recommend using a segment because this will include all the different touch points for that particular person.
#5 Combining multiple data sets within a dashboard
Combining multiple data sets is becoming more important as most of us have different pieces of data in separate platforms. We have our web analytics data inside Google Analytics, but then you might have data in your email platform, in PayPal or even in other Google Sheets. Since we’ve already looked at Google Sheets, this is what I’m going to cover here.
Combining data is more technical than the other topics we’ve covered so far, but it’s an elegant solution and is something that we can all achieve. (And the nice thing is you don’t need to learn how to manage a database to get up and running quickly.) So I recommend making use of Google Sheets.
Let’s say we want to combine data from two or more Google Analytics views. We can use the Google Analytics add-on for Sheets and pull the different sets of data into the one Sheet. We can then combine the data.
Wow! We’ve covered a lot of ground! We started off looking at how we can create dashboards directly inside Google Analytics. Then we looked at how we can use Google Data Studio and Google Sheets before looking at filtering our data and combining multiple data sets. I hope you’ve found some new ideas and techniques that you can apply to your own dashboards!
Have any questions about creating dashboards or any of these techniques? Let me know! I’d love to hear from you!
Comments