Setting Up Custom Google Analytics 4 Dashboards for Actionable Insights
Loves Data
Google Analytics 4 (GA4) offers a powerful set of features for tracking and analyzing your website's performance. Among these features, custom dashboards stand out as an essential tool for visualizing and sharing key metrics. With the ability to create and customize dashboards tailored to your specific needs, GA4 helps you turn raw data into actionable insights. In this article, we'll walk you through the steps to set up custom dashboards in GA4, enabling you to monitor your most important data at a glance.

Creating a Custom Dashboard in GA4
You will need editor or administrator-level permission to create custom dashboards in Google Analytics. If you don’t have the correct level of permission, you can view existing reports, but you won’t be able to create new ones. Here are the steps to create a dashboard:
- Access Your GA4 Property: Start by logging into your Google Analytics account and navigating to your GA4 property.
- Navigate to the 'Reports' Section: In the left-hand menu, click on ‘Reports’ to access the reporting features of GA4.
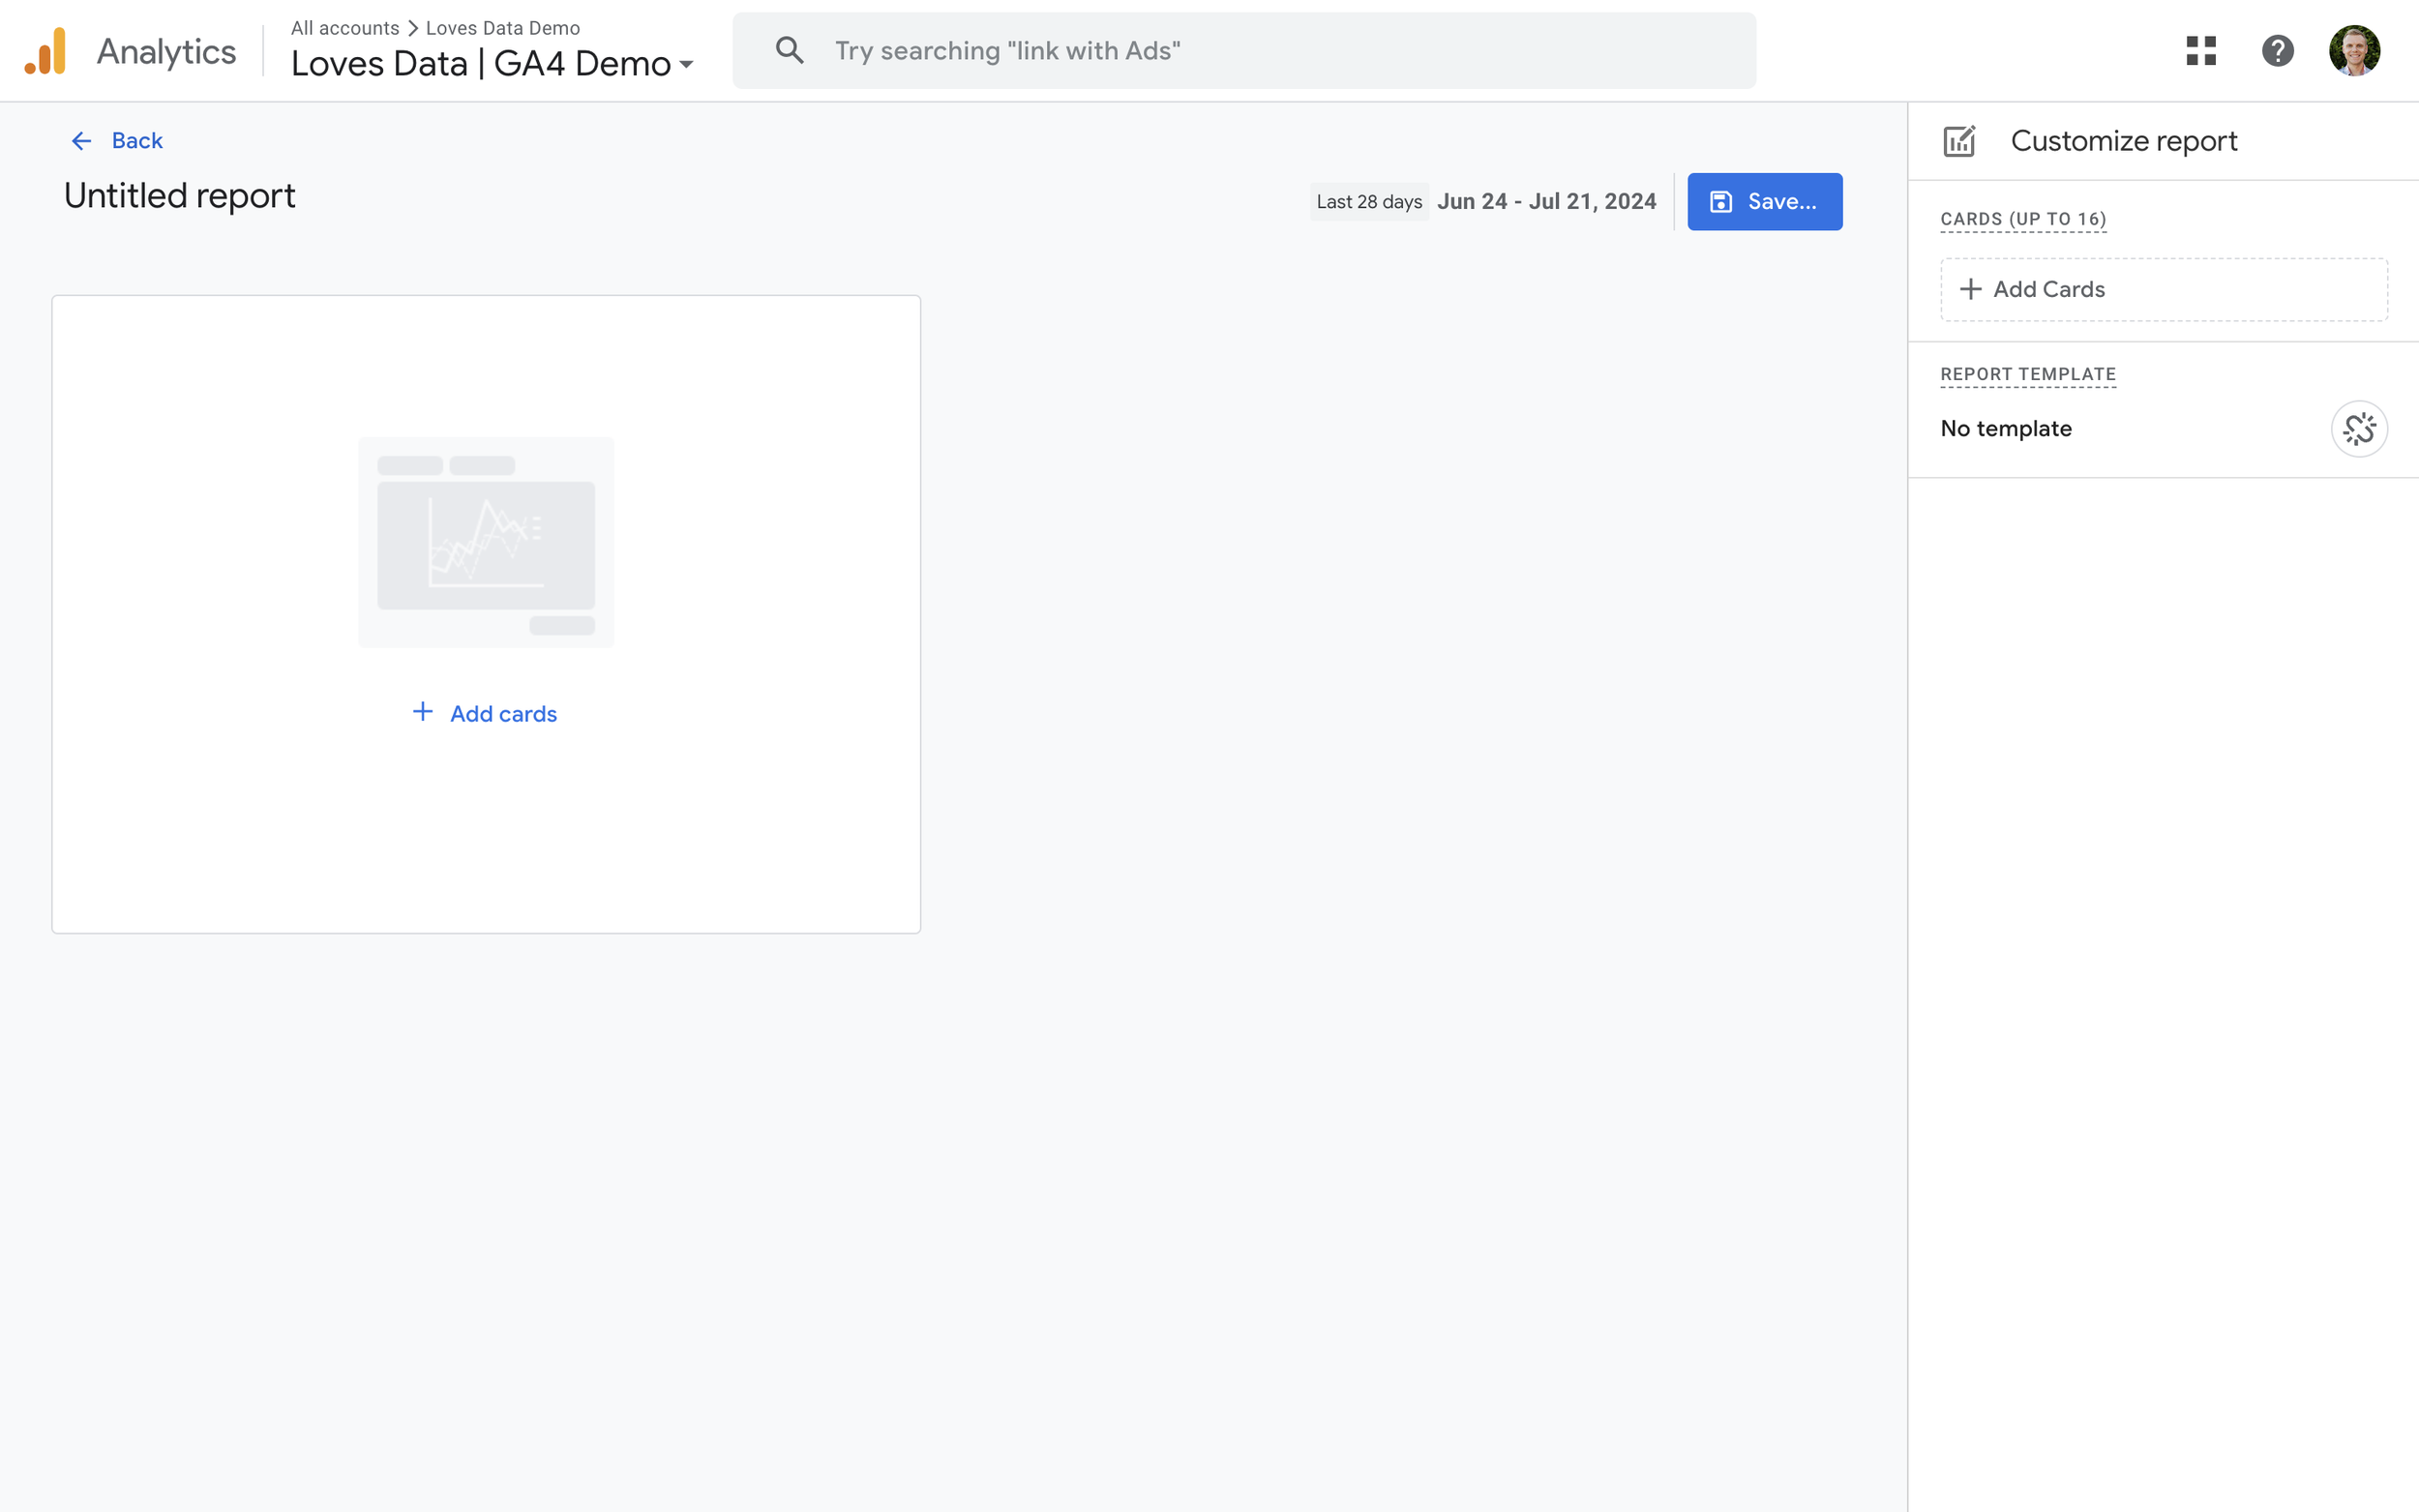
- Create a New Dashboard: Click on the ‘Library’ at the bottom of the Reports menu, then select ‘Create New Report’. Selecting ‘Create Overview Report’ allows you to create a dashboard-style report in GA4.
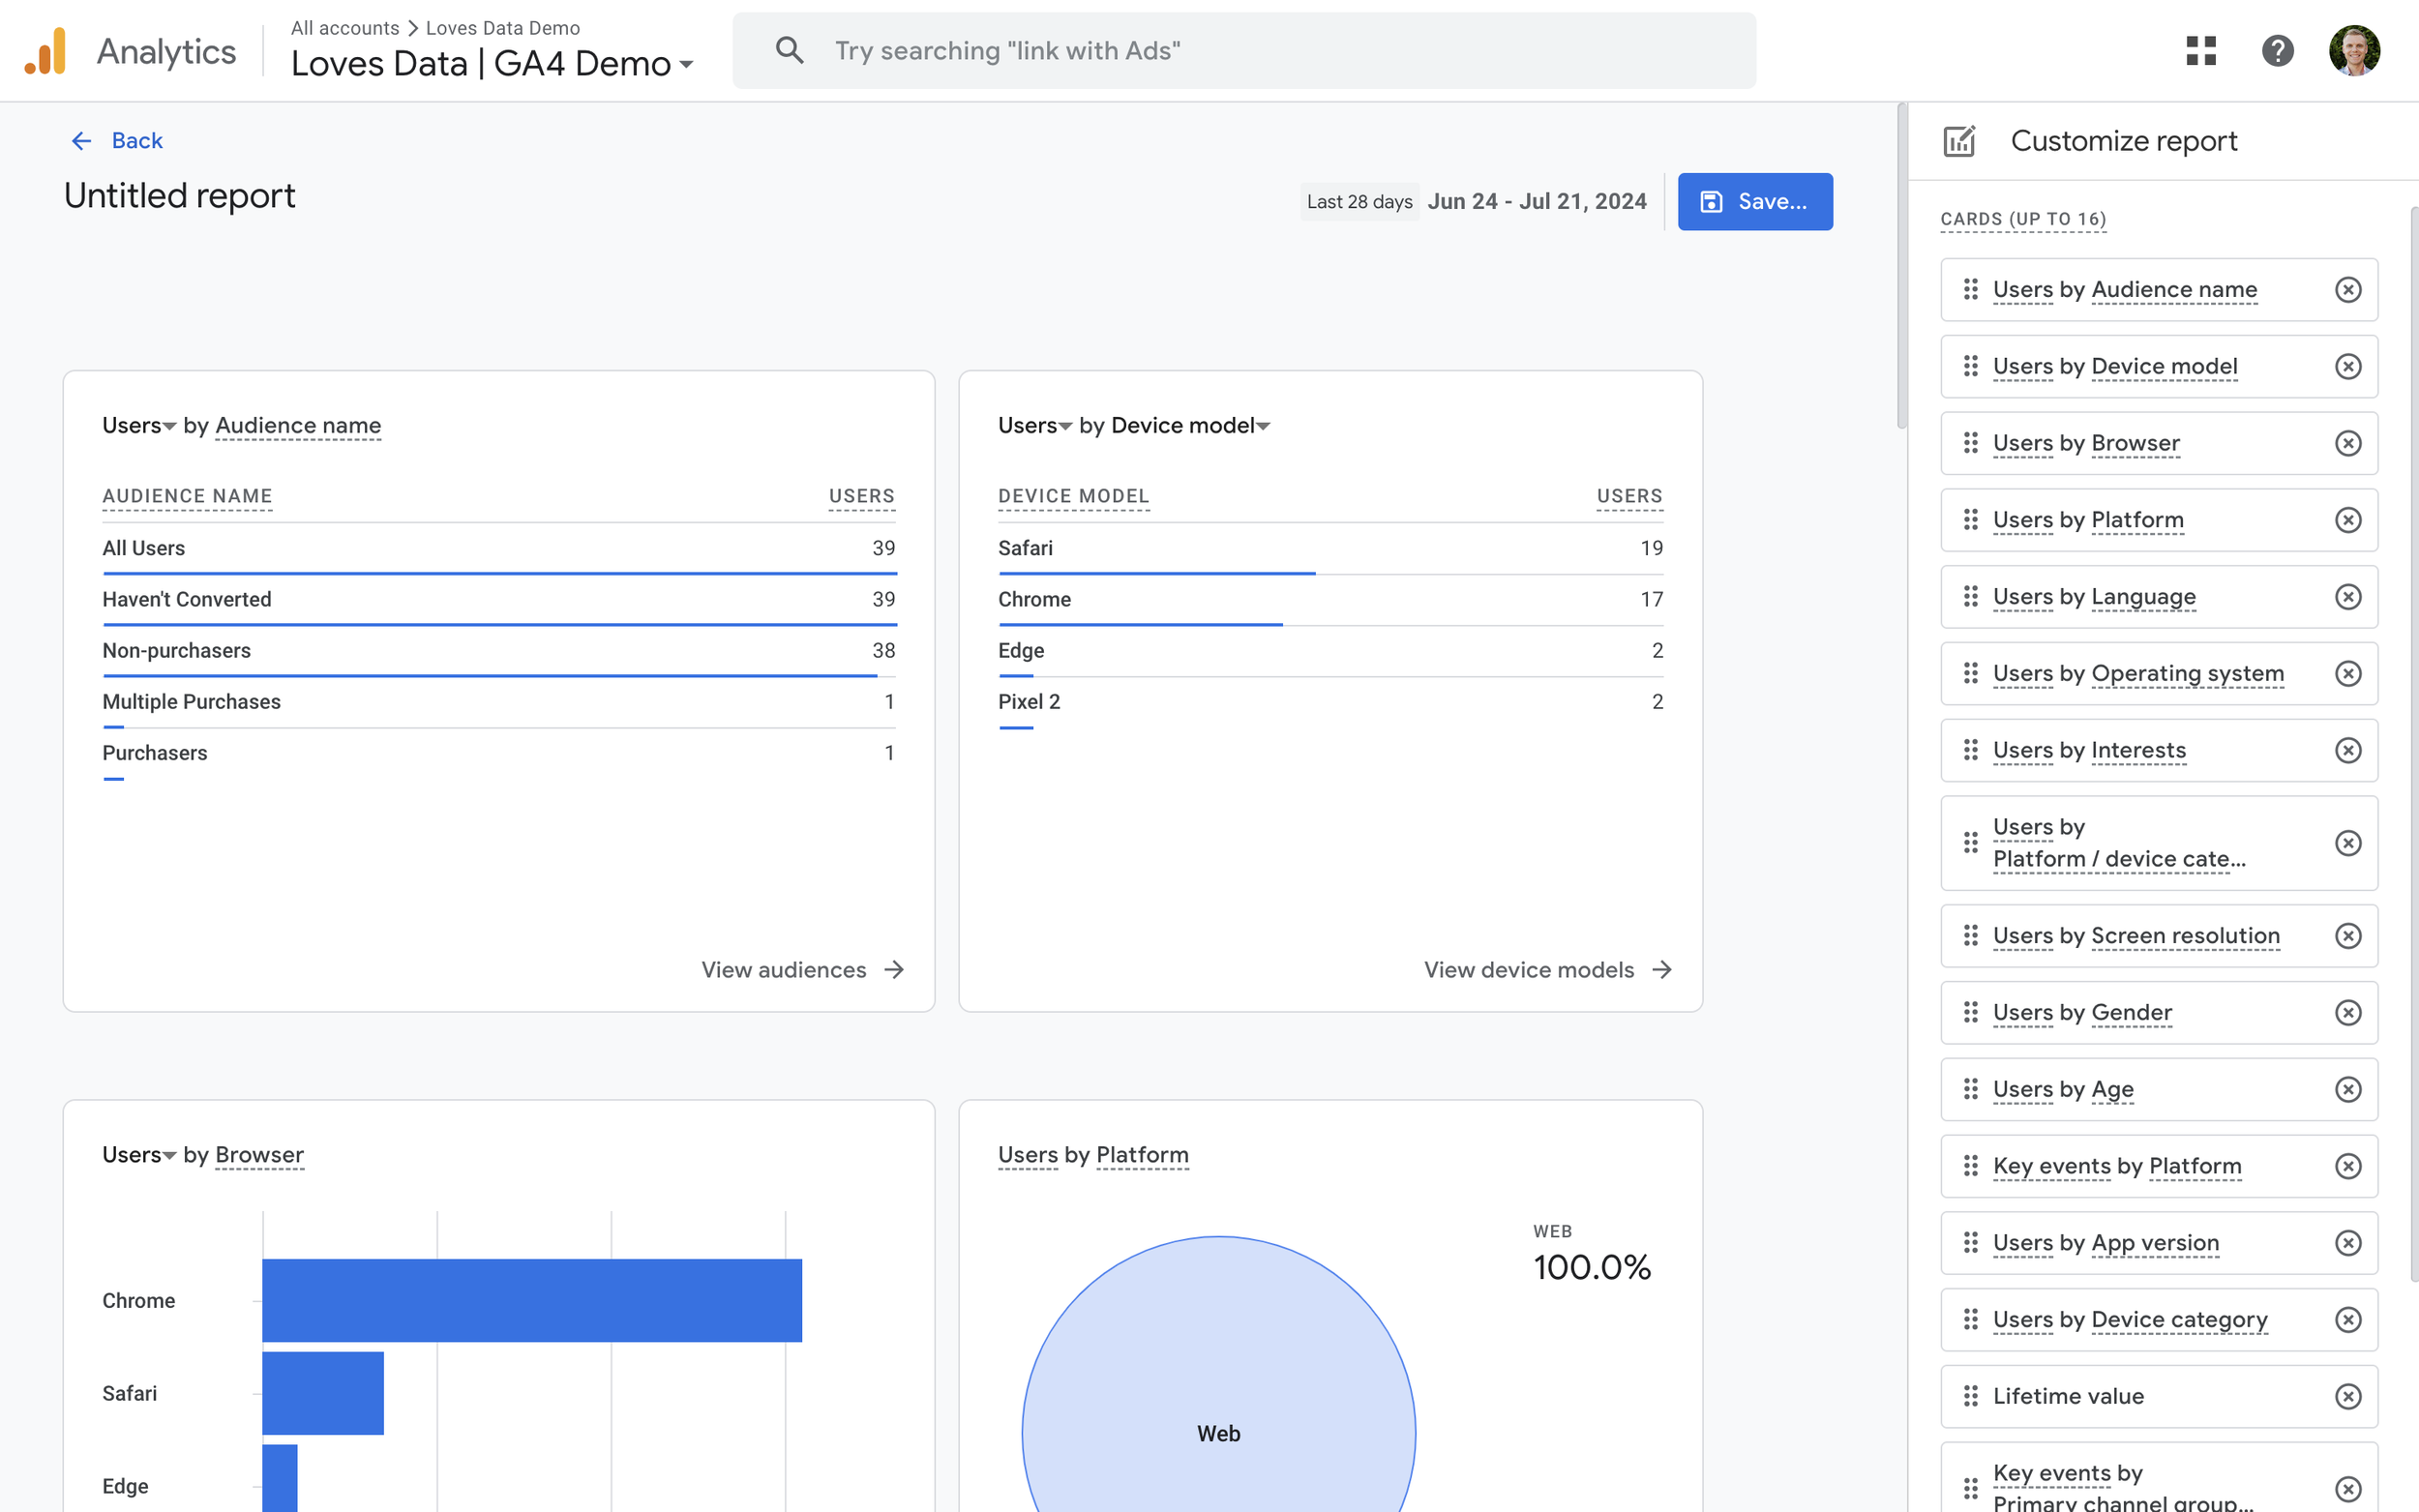
- Add Cards: Customize your dashboard by adding up to 16 cards. There are a range of pre-configured cards to choose from, and creating a ‘Detail’ report before creating the dashboard lets you create additional cards. Each card can display different metrics, such as user acquisition, engagement, monetization, and retention. You can use the drop-down on each card to change the default metric it presents. You can also choose cards that present different charts, including tables, bar charts, donut charts, and maps, to represent your data visually.
- Reorder Cards: Once you’ve added cards to your dashboard, you can reorder them by dragging and dropping them using the ‘Customize Report’ panel on the right.

Customizing Your Dashboard
Once you’re viewing the dashboard you’ve created, GA4 allows you to customize the presented data. Here’s how you can customize the data in your dashboard:
- Apply Comparisons: Choose from pre-defined comparisons to compare the performance of different types of traffic segments and users.
- Set Date Ranges: Adjust the date range for each widget to compare performance over different periods.
- View Detail Reports: Clicking the link at the bottom of a card in the dashboard will take you to a detailed report for more in-depth analysis options.
Sharing Your Dashboard
One of the key benefits of GA4 dashboards is the ability to share them with your team. Here's how you can share your custom dashboards:
- Share with Team Members: Once you’ve created a dashboard, edit an existing ‘Collection’ or create a new one to add your dashboard to the main reporting menu. Anybody with access to the GA4 property can view dashboards included in a ‘Published’ Collection.
- Schedule Emails: You can schedule your dashboard to be automatically emailed to particular people using the ‘Share’ option.
- Export Reports: You can also export your dashboard reports as PDFs, CSV files, or export the data to Google Sheets.
Private vs. Shared Dashboards
GA4 distinguishes between private and shared dashboards, allowing you to maintain control over who sees your data. Private (unpublished Collections) are only visible to other administrators or editors, while anyone with the appropriate permissions can access shared dashboards (included in published Collections). This separation ensures that sensitive data remains secure while still enabling team-wide visibility for key performance indicators.
Advanced Customizations and Integrations
Beyond the basics, GA4 offers advanced customization options and integrations to enhance your dashboards:
- Custom Reports: Create detailed custom Exploration reports that drill down into specific aspects of your data.
- Third-Party Integrations: Integrate GA4 with other tools, such as Looker Studio, to create even more sophisticated visualizations and reports.
Conclusion
Google Analytics 4's custom dashboards provide a flexible and powerful way to visualize and share your website's performance data. By setting up and customizing dashboards, you can ensure that you and your team have quick access to the metrics that matter most. Whether you’re tracking user behavior, conversion rates, or campaign performance, GA4 dashboards help you turn data into actionable insights, driving better decision-making and improved business outcomes.

Comments