Understanding Google Analytics Benchmarking Metrics
Loves Data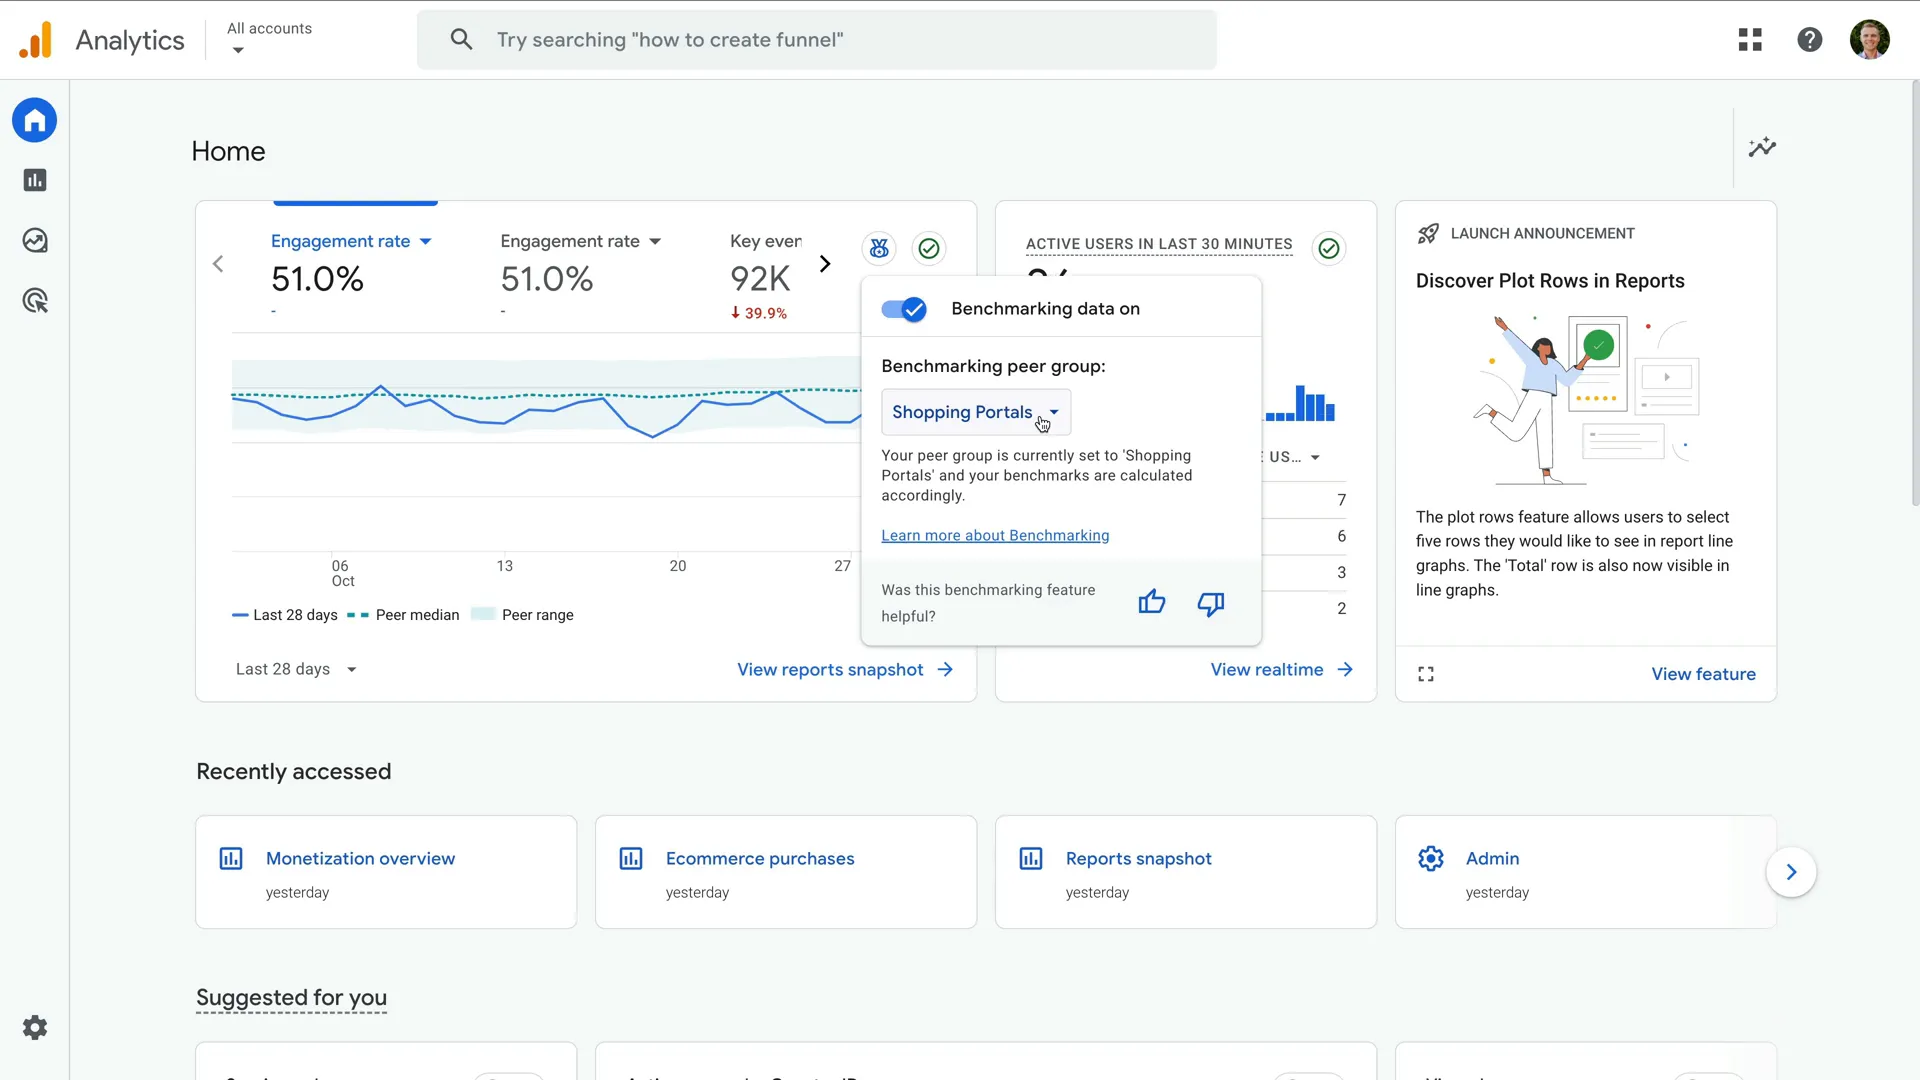
Google Analytics allows you to compare your website against Google’s benchmarks with a handy benchmarking feature. If you want to know whether your site is above or below average for benchmarking metrics, you can enable and customize this feature in your Google Analytics property. In this blog post, we’ll explore what the benchmarking feature in Google Analytics is, how it can be used, and where you’ll be able to find it.
Table of Contents
- What is Benchmarking in Google Analytics?
- Step 1: Finding Benchmarking
- Step 2: Selecting a Metric
- Step 3: Choosing a Benchmark Metric
- Step 4: Understanding Benchmark Data
- Step 5: Changing Peer Groups
- How Benchmarking Data Can Help Your Business
- Frequently Asked Questions (FAQ)
What is Benchmarking in Google Analytics?
Google Analytics benchmarking lets you compare the performance of your website against other websites. You can choose from a range of benchmark metrics to see how your performance compares against different industry verticals. This lets you confirm if your preforming better, worse, or the same as the benchmark.
Highlights of the benchmarking feature include:
- Range of Benchmark Metrics: You can benchmark a range of key metrics including acquisition, engagement, retention, and monetization metrics.
- Data Privacy: Your data remains private. Benchmark data is aggregated and only becomes available when minimum thresholds are met.
- Peer Groups: Benchmarks are based on data from similar businesses in your industry, offering relevant comparisons. You can switch between different industry verticals, called ‘Peer Groups’ to compare performance.
- Daily Updates: Benchmark data is available by day, so you can compare metrics on a daily basis.
Step 1: Finding Benchmarking
To start, log in to your Google Analytics account and navigate to the ‘Home’ report. Look for the benchmarking icon in the top right corner of the overview card (it looks like a small medal icon).
You will need to ensure your Google Analytics property is opted-in to benchmarking for the feature to be available in your reports. To do this, navigate to ‘Admin’ and select ‘Account Details’ (which is available under ‘Account’). You will then need to ensure the ‘Modeling Contributions & Business Insights’ option is enabled.
Step 2: Selecting a Metric
To access the benchmarking data, you'll need to add the benchmark metric to the overview card. To do this, select one of the existing metrics on the card, then you can select ‘Benchmarking’ to view the available metrics.
Step 3: Choosing a Benchmark Metric
Once you’ve selected a benchmark metric, the chart will update to include benchmarking data. This gives you a visual representation of your website’s performance relative to the benchmark.
There are over 30 benchmark metrics available in Google Analytics. Some highlights include:
- For websites focused on conversions: user key event rate and session key event rate
- For ecommerce websites: purchases per user, average purchase revenue, and ARPU
- For understanding engagement: engagement rate, average session duration, and new user rate
Step 4: Understanding Benchmark Data
Let’s say you select the ‘Engagement Rate’ benchmark metric, the chart will display your website’s performance it in comparison to the engagement rate benchmark.
The dotted line in your chart represents the median engagement rate within your peer group, giving you a reference point for how your website compares to others in your industry.
The shaded area around the median line reflects the interquartile range, or middle 50% of performance data. It excludes the top and bottom 25 percent (outliers). This ensures that the benchmarking data is meaningful by removing the influence of extreme values.
The solid line in the chart shows your website's data, allowing you to quickly compare your performance against the median and range.
Step 5: Changing Peer Groups
To adjust the benchmark comparison, you can click the benchmarking icon and choose a different peer group. This lets you compare your website’s performance against different industry verticals. You might find that your website fits within multiple categories, so switching peer groups lets you see any differences in the benchmark metric.
How Benchmarking Data Can Help Your Business
Benchmarking data is powerful because it contextualizes your performance, revealing strengths and areas for improvement. Let’s consider a few example scenarios:
- Low New User Rate: If your new user rate falls below the 25th percentile in your peer group, it’s a sign that your acquisition strategies need improvement. You might consider investing more in targeted ads, enhancing SEO, or boosting content marketing efforts.
- High Engagement Time: On the flip side, if your average engagement time per session is higher than the 75th percentile, this signals strong user interest in your content. This is a good time to focus on increasing conversions by adding more strategic CTAs or personalized offers.
- Optimizing Monetization: If your ARPU (Average Revenue per User) is lagging behind your peers, you can explore strategies like upselling, loyalty programs, or targeted promotions to increase revenue per user.
These insights can significantly enhance your decision-making, enabling you to make data-backed changes to your marketing strategies, website design, or product offerings.
Frequently Asked Questions (FAQ)
What metrics can I benchmark?
You can benchmark various metrics. These include:
- New user rate
- Average engagement time per session
- Average engagement time per user
- Average session duration
- Engagement rate
- Engaged sessions per user
- Event count per user
- Events per session
- Session key event rate
- Sessions per user
- User key event rate
- Views per session
- Views per user
- Bounce rate
- Daily active users / Monthly active users (DAU / MAU)
- Daily active users / Weekly active users (DAU / WAU)
- Weekly active users / Monthly active users (WAU / MAU)
- Add to carts per user
- Average revenue per user (ARPU)
- Average revenue per paying user (ARPPU)
- Average purchase revenue per user
- Checkouts per user
- First-time purchaser rate (FTP rate)
- First-time purchasers per new user
- Paying monthly active users / Daily active users (PMAU / DAU)
- Paying weekly active users / Daily active users (PWAU / DAU)
- Total ad revenue per user
- Transactions per purchaser
- Transactions per user
How is the benchmarking data collected?
Benchmarking data is aggregated from other Google Analytics properties which have opted-in to anonymously share data. This ensures privacy and security are maintained.
What should I do if I don't see the benchmarking feature?
If you’ve already checked that the ‘Modeling Contributions & Business Insights’ option is enabled, then the feature might not be available in your property yet. Benchmarking is a new feature that is still rolling out, so you might need to wait until it becomes available.
Final Thoughts
By comparing your performance using the benchmarking feature in Google Analytics, you can enhance your reporting and analysis. While benchmarking on its own is not particularly actionable, using benchmark metrics with your other reports can add valuable context. For example, you can use benchmarks to validate unexpected increases and decreases in traffic and confirm if trends are only impacting your website or affecting other businesses in your industry.
To learn even more about leveraging your Google Analytics reports, please take a moment to check out our Google Analytics 4 Course.


Comments