Advertising Workspace in Google Analytics 4
Loves Data
The new Advertising Workspace in Google Analytics 4 (GA4) includes reports dedicated to your inbound marketing and advertising activities in the GA4 interface. It includes insights for your campaigns, along with any other paid and organic traffic sources. The reports emphasize attribution, including the ability to compare attribution models and view touchpoints leading to conversions.
IMPORTANT: The Advertising Workspace (and other updates) are currently rolling out to GA4 properties, so if you don’t see these reports now, they will be there soon.
You will find additional insights into the relationship between your marketing channels and user journeys using the Advertising Workspace in your Google Analytics 4 property. The reports available in the workspace will help you better understand your ROI (return on investment) across channels, inform how you allocate (or experiment) your advertising budget, and more.
Attribution in the Advertising Workspace
The Advertising Workspace reports in GA4 focus on attribution. If you’re just getting started, attribution is about how credit is assigned to the various marketing channels people engage with, leading to conversions. And an attribution model is a rule, a collection of rules, or in some cases, an algorithm that determines how credit is assigned when people engage with multiple marketing channels.
All of the standard reports in Google Analytics (found under ‘Reports’ in the main navigation) use the same attribution model. By default, this is the last-click attribution model. This means that when you are looking at the standard reports, and there is a conversion or conversion rate, then the last identified channel used to reach your website receives all of the credit for the conversion.
In Google Analytics 4, there are currently six default attribution models. These include the last click model, the first click model, the linear model, the time decay model, the position-based model, and the Google Ads last-click model.
If you’re also using Universal Analytics, you will find some slight differences in the attribution models – there are two last-click models. There is the last non-direct click model and the last interaction model. Plus, the option to create customized attribution models. While I’m not sure if custom attribution models will be heading to GA4, Google has mentioned that a data-driven model is coming soon.
If you would like to learn more, then my dedicated post covers each of the attribution models in Google Analytics.
You need to check three things to get the most out of the Google Analytics 4 Advertising Workspace reports. First, you will need to ensure you’ve configured conversions (or implemented ecommerce tracking). Then you will need to ensure your GA4 property is linked to your Google Ads account. And finally, you will also need to ensure you’ve applied campaign tags to all of your inbound marketing. Here are some resources to help you check these three critical steps are up and running:
- Google Analytics 4 conversion tracking (YouTube video)
- Configure conversions in Google Analytics 4 (blog post)
- Google Analytics 4 ecommerce tracking (YouTube video)
- Tracking Shopify with Google Analytics 4 (YouTube video)
- Link Google Analytics 4 to Google Ads (YouTube video)
- Tracking campaigns in Google Analytics (YouTube video)
- Using Google Analytics campaign tags (blog post)
Once you’re tracking conversions (or ecommerce transactions) and you’re tracking campaigns (including Google Ads), then you will be able to make use of the reports in the Advertising Workspace. You will be able to see how people engage with your different marketing and advertising efforts.
Advertising Workspace Reports
Reports in the Google Analytics 4 Advertising Workspace are slightly different from the regular Google Analytics 4 reports, so take some extra time to familiarize yourself with the reports. And the workspace is available to anybody who has access to your GA4 property. The report can help you answer questions like:
- What were the effects of paid and organic channels on conversions?
- How long do marketing channels take to drive conversions?
- How many touchpoints were in the path to conversion?
- What the most common user journeys that lead to conversions?
- How much revenue do particular conversion paths generate?
The Advertising Workspace reports lets you choose which attribution model (or models) you want to apply to the metrics. This means that you can switch models and apply multiple models to understand and compare performance. And the models you apply won’t change the data used for your reports.
The Google Analytics 4 Advertising Workspace currently has three reports, but I’m guessing more reports will be added in the future. Let’s look at each of the reports that are currently available.
Advertising Snapshot
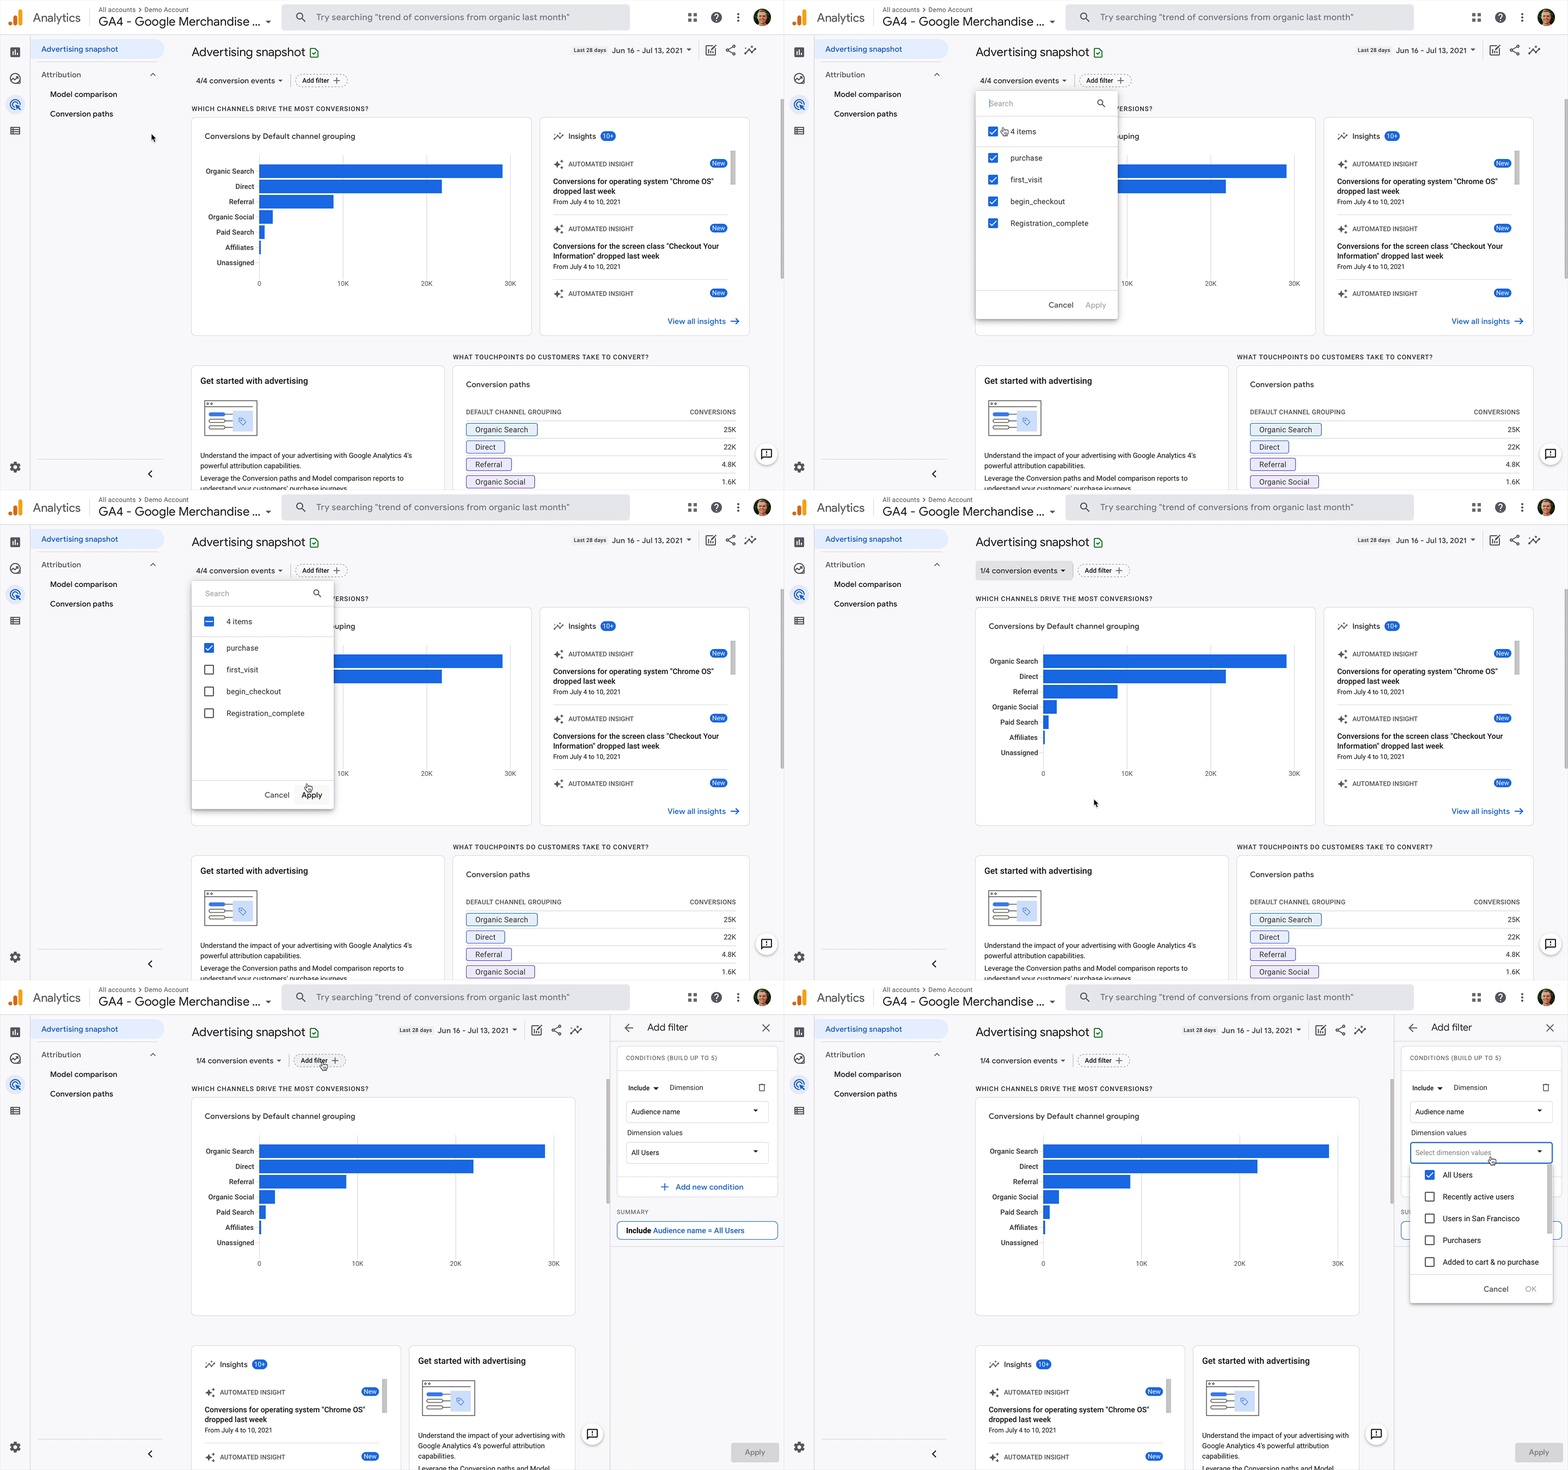
The Advertising Snapshot report includes automated insights using Google’s machine learning, and it also lets you compare two attribution models to see the change in conversions as a percentage. In most cases, you will quickly want to dive deeper into the dedicated reports that we will look at in a moment.
For more detail, you can use the following two options to adjust what is (and isn’t) included in the report:
- Conversion Events: You can choose if you want all of your conversions to be used for the report or select one or more conversions to narrow the report’s focus. For example, if you have multiple conversions configured in Google Analytics 4, you might only focus on leads or only focus on purchases.
- Filters: You can apply filters to include certain events or user segments. For example, you can apply audiences you’ve already created to narrow the focus of the report.
It’s important to highlight that the Advertising Snapshot and the other Advertising Workspace reports only include data from 14 June 2021 onwards. This means you will want to wait until you’ve built up enough historical data, so the reports are more useful.
Model Comparison
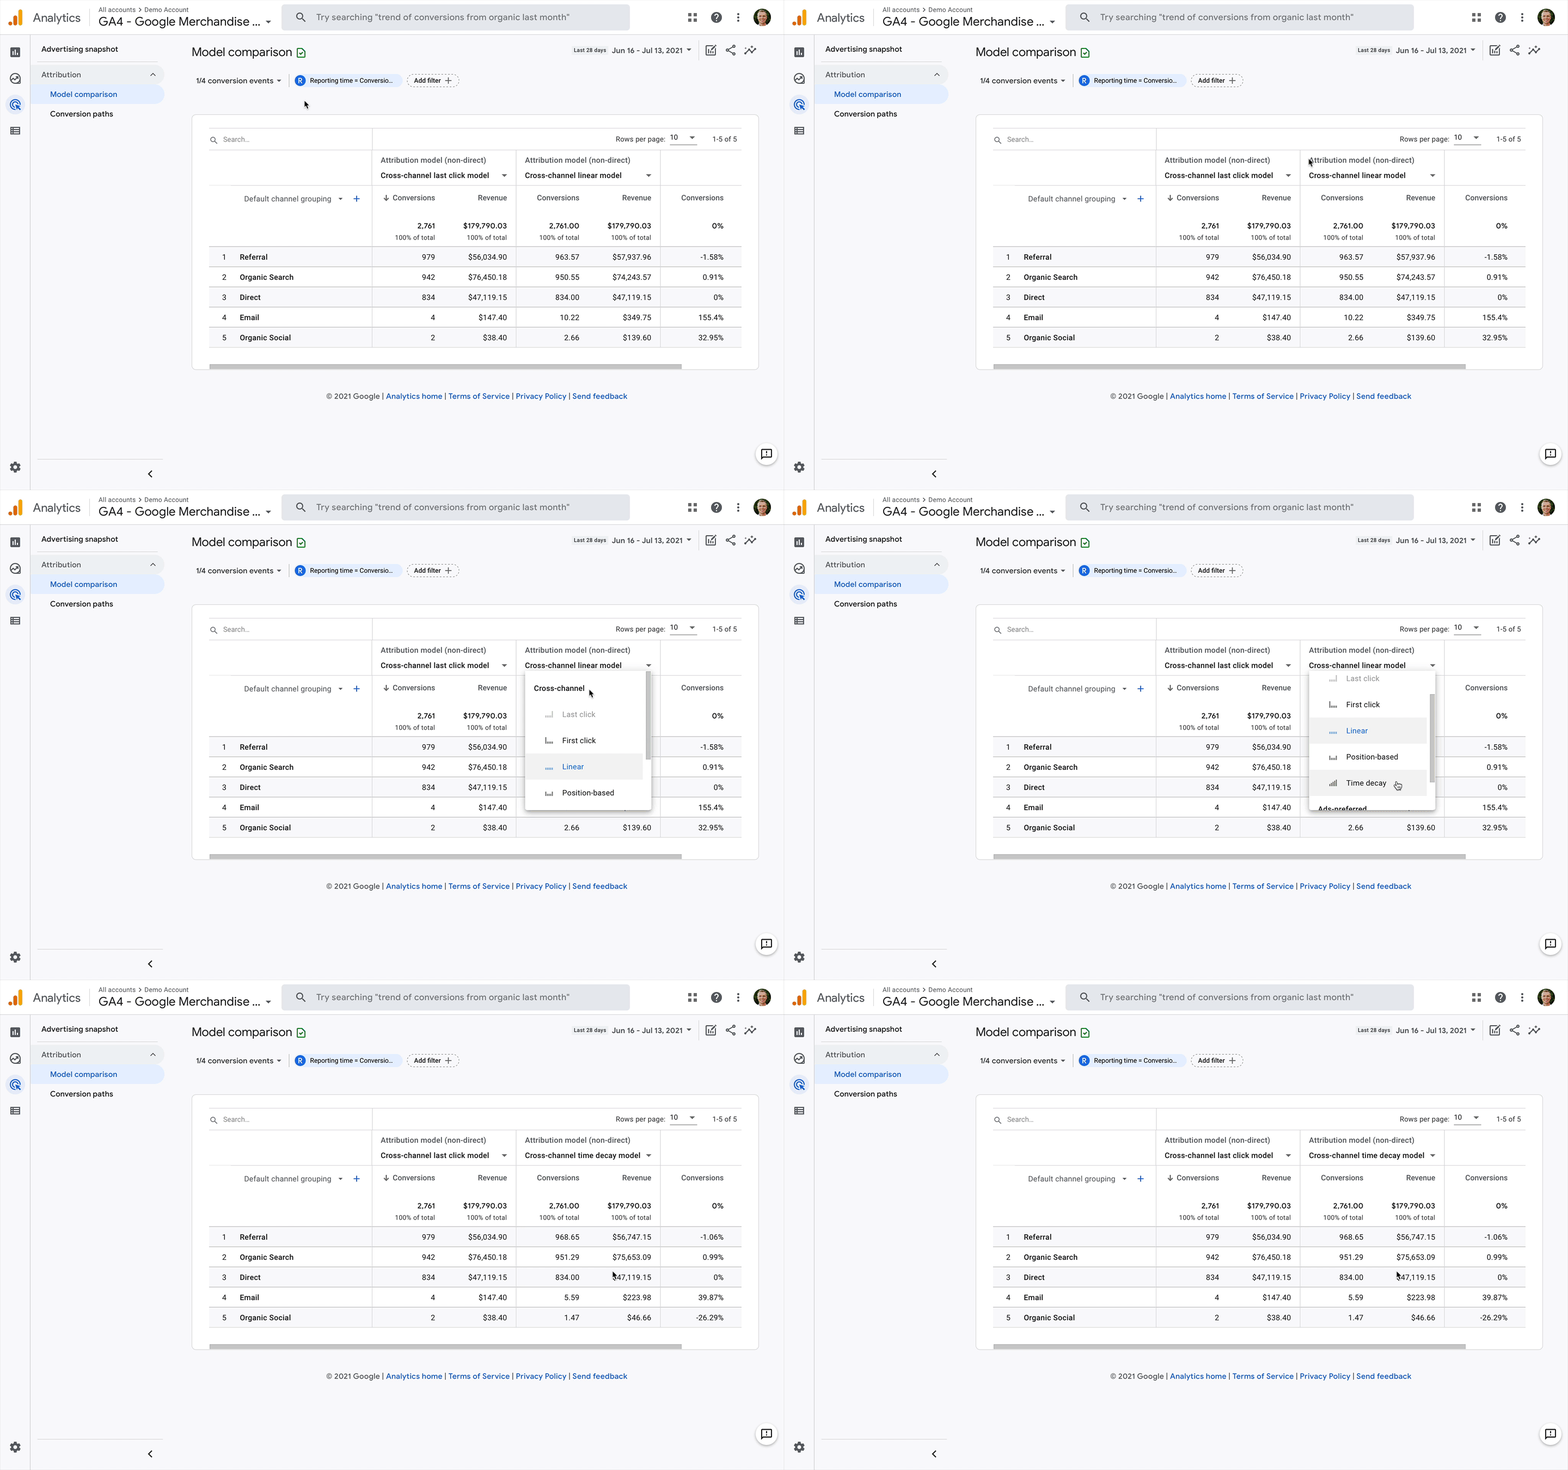
You can compare attribution models using the Model Comparison report. The report lets you select two attribution models, which then show you the number of conversions and revenue associated with your marketing channels for each attribution model. The report also shows you the percentage change between the models to see if one model over or under-reports conversions and revenue compared to the other model.
You can select the models you would like to use for the report above the table:
The report also includes the following customization options:
- Conversion Events: This lets you choose if you want all of your conversions to be used for the report, or you can select one or more conversions.
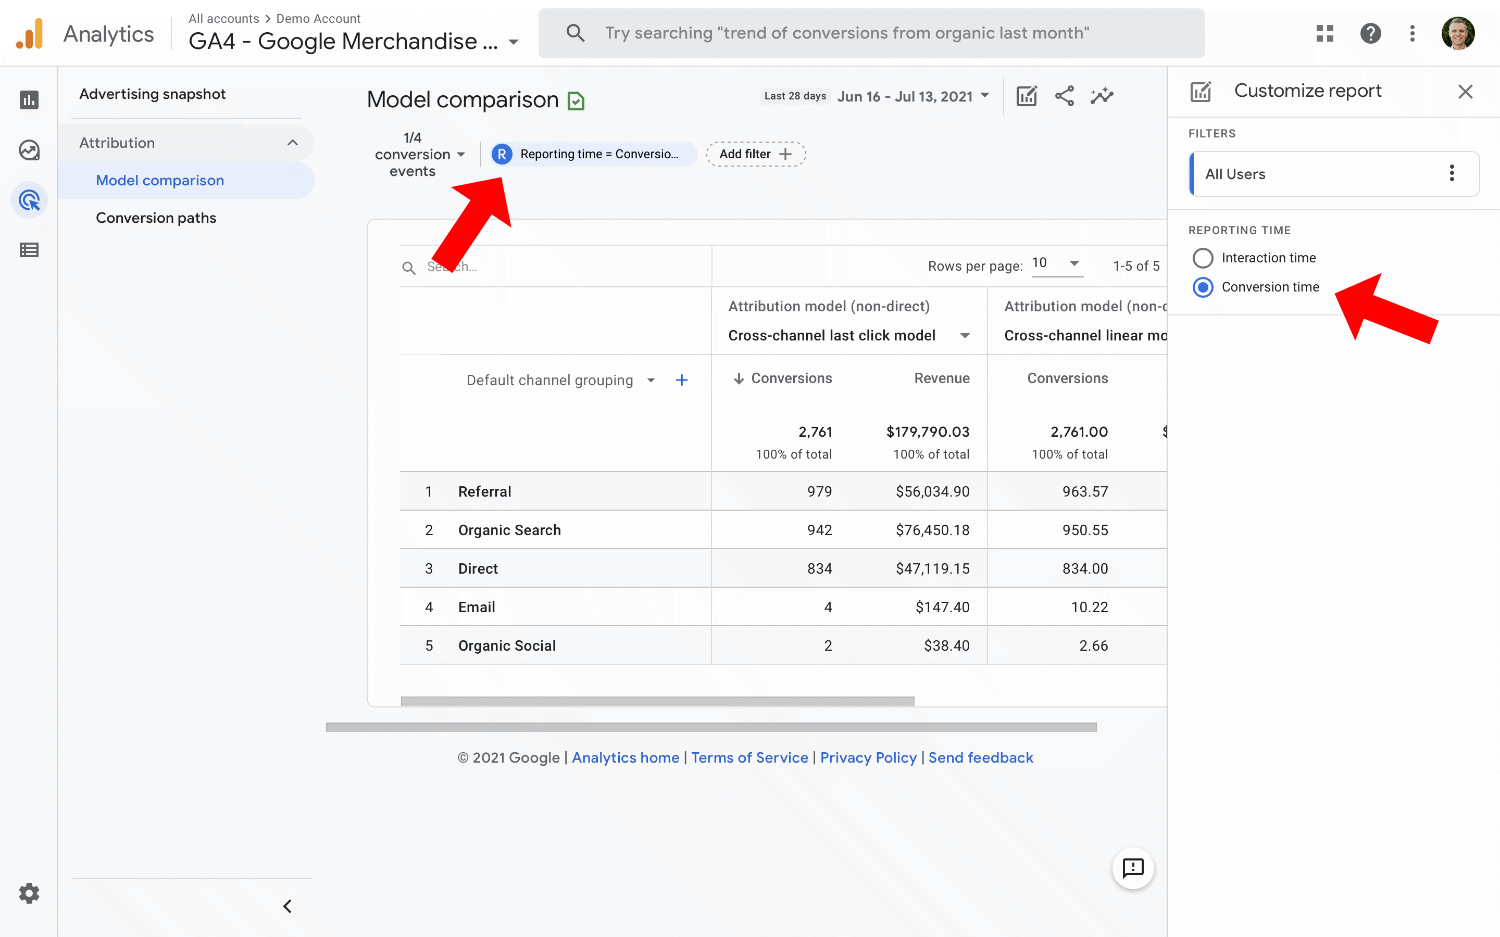
- Reporting Time: You can switch between ‘Conversion Time’ and ‘Interaction Time’. Choosing ‘Conversion Time’ means that events will be included based on the lookback window while choosing ‘Interaction Time’ means that events need to occur within the date range selected for the report.
- Filters: You can apply filters only to include particular events or users.
Conversion Paths
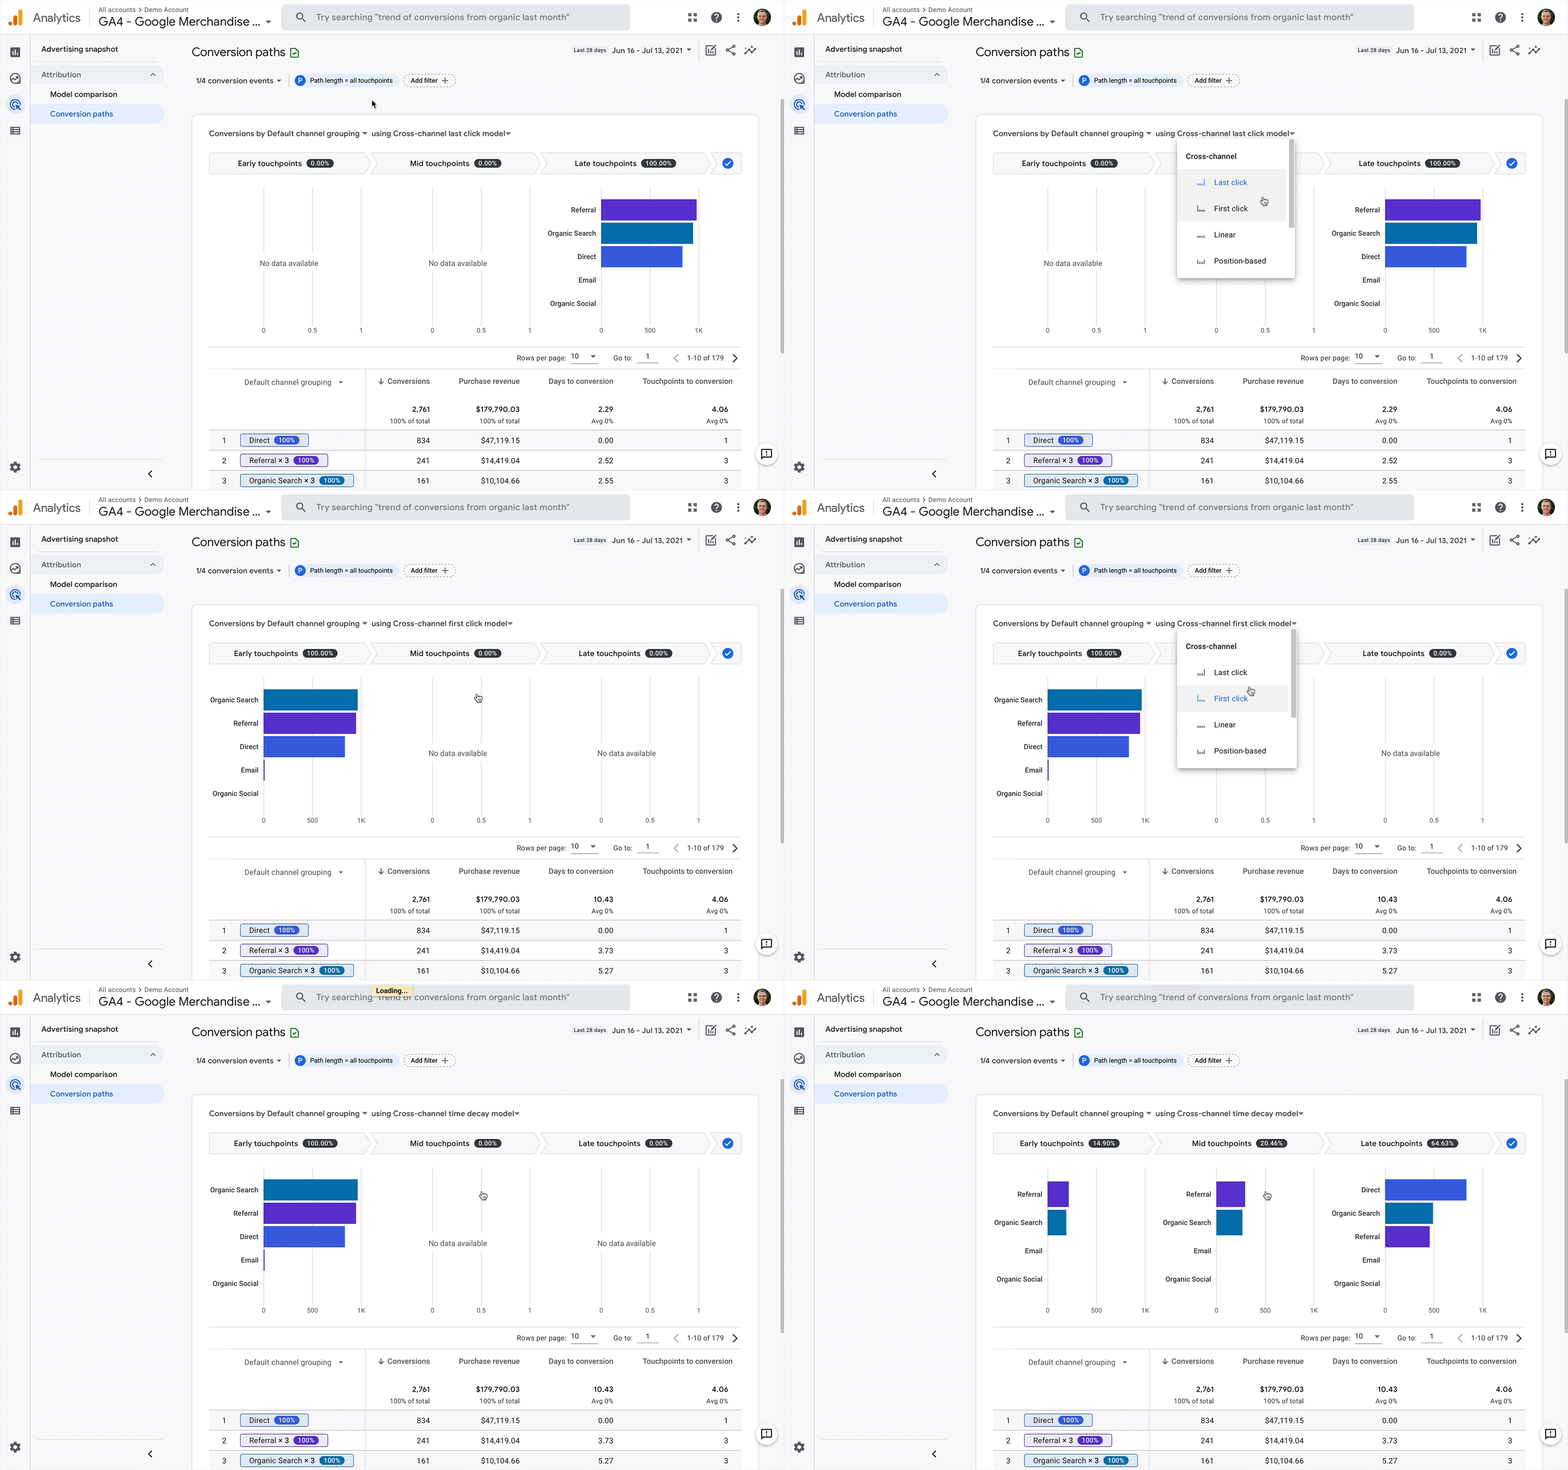
The Conversion Paths report shows you the touchpoints users engage with before they convert.
At the top of the report, there is a visualization that shows you marketing channels based on their position in the path to conversion. You will see channels that create initial awareness on the left, and on the right, you will see channels that close conversions.
You can change the attribution model to update the visualization at the top of the report. Select the attribution model using the drop-down.
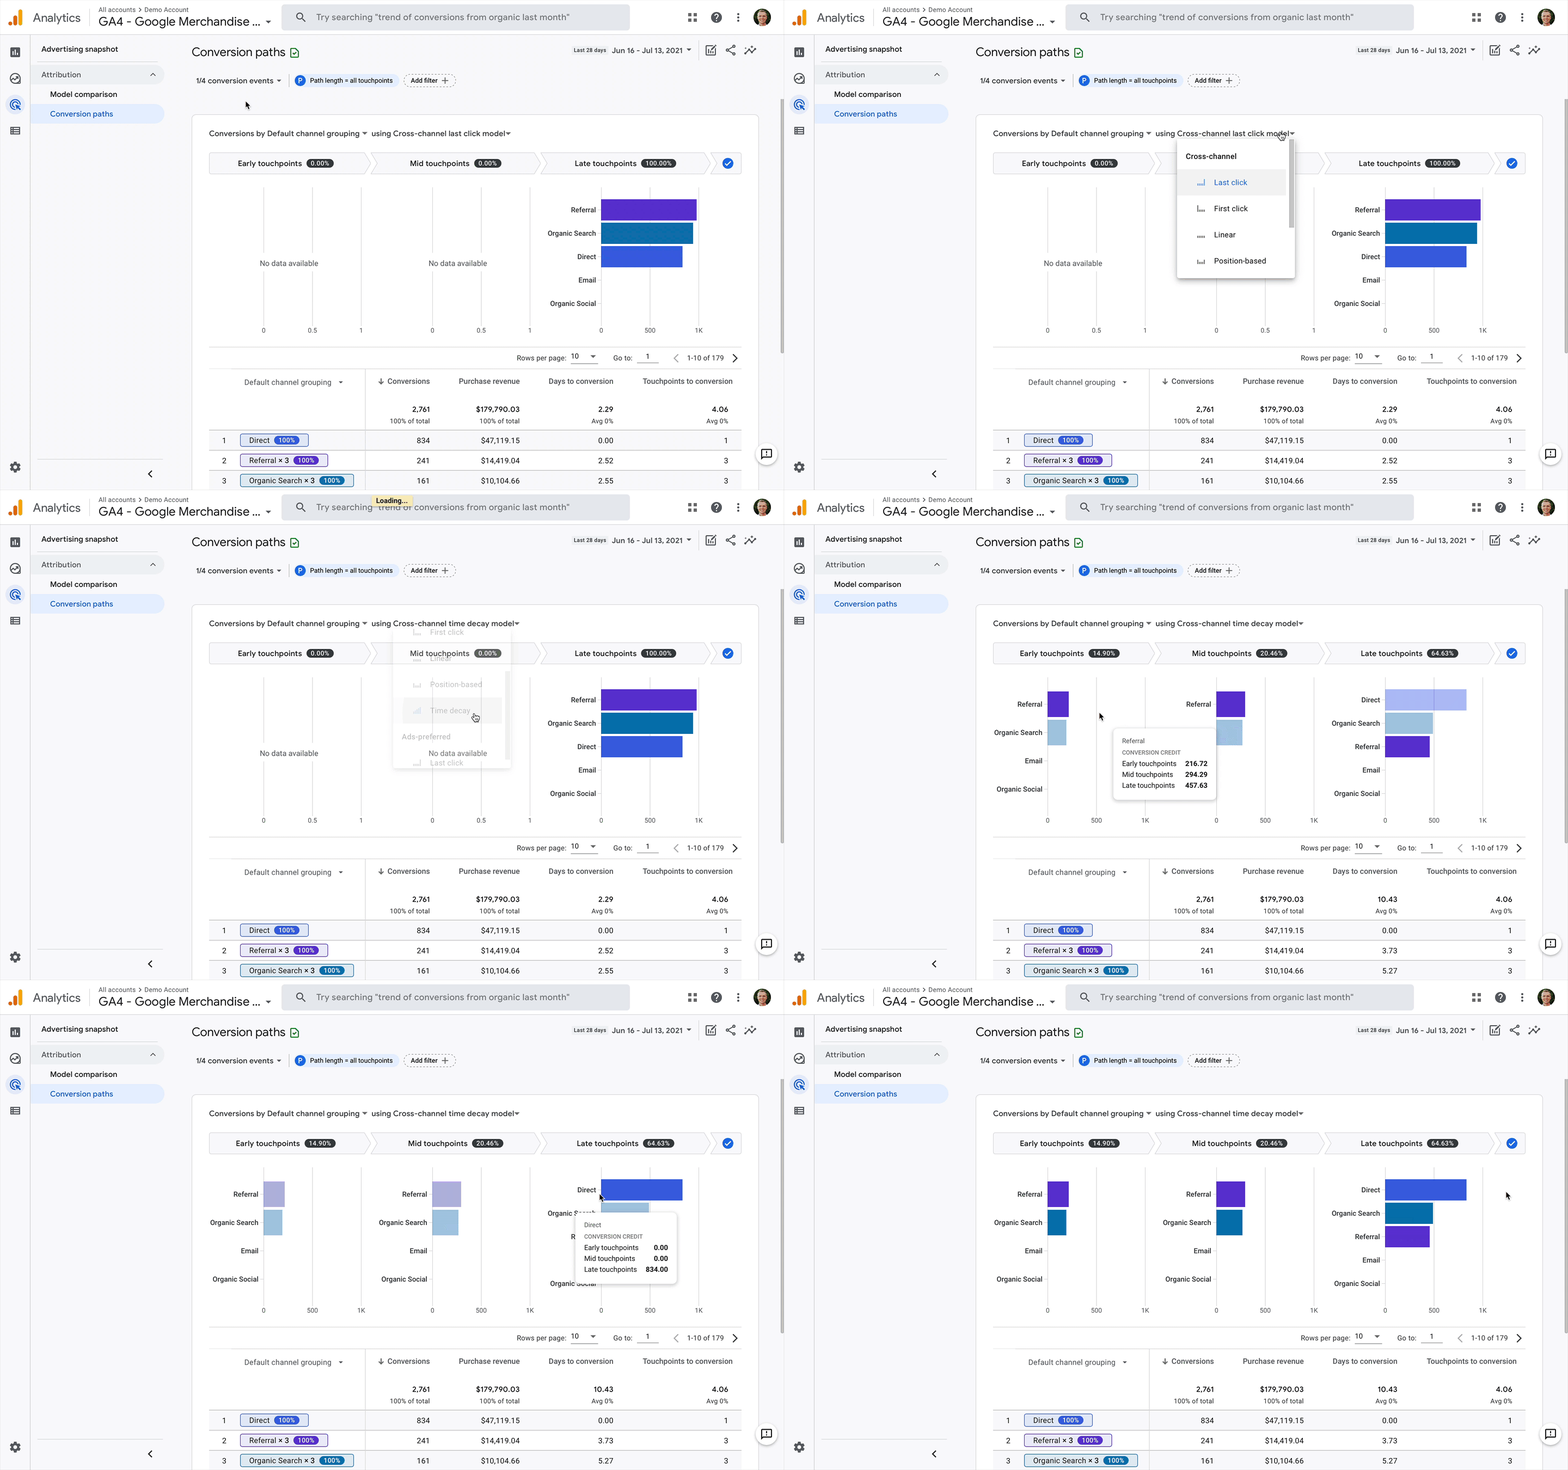
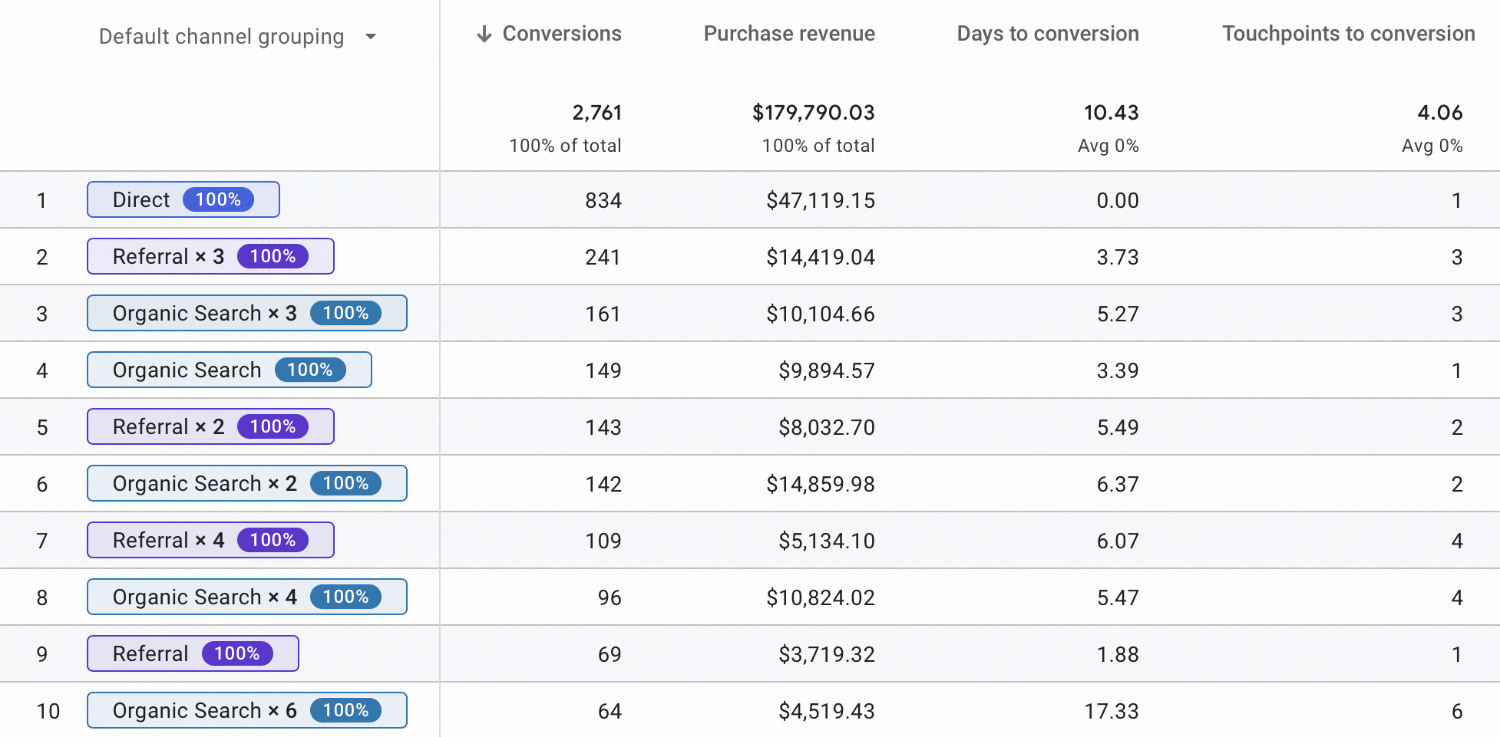
Moving down the report, you will see a visualization showing you the different conversion paths. You will notice some channels have multiple touchpoints. This is indicated by a multiplier (for example, “x 2”, “x 3”, “x 4” and so on). This tells you how many times people engaged with the particular channel, so “x 2” means that someone engaged twice with the marketing channel before converting.
Customization options for the report include:
- Conversion Events: This lets you choose if you want all of your conversions to be used for the report, or you can select one or more conversions.
- Path Length: You have the option of selecting the number of touchpoints to include in the report. By default, all path lengths and touchpoints are included.
- Filters: You can apply filters only to include particular events or users.
Apart from conversions and revenue metrics, the report also includes the number of days to conversion, and the number of touchpoints for each path.
Conclusion
The Advertising Workspace in Google Analytics 4 is your go-to place for deeper insights into the relationships between your marketing channels and how they’re driving conversions. From the automated insights in the snapshot to analyzing your paths to conversion, the reports build on the flexibility of GA4’s data model. I’m sure we will see additional reports and features added to the Advertising Workspace as Google Analytics 4 continues to evolve and mature.




Comments