Flow Visualization in Google Analytics
Loves Data
flow-visualization
Google Analytics has a new feature called ‘Flow Visualization’ to help you understand how people navigate your website. You can see Flow Visualization within the Visitors and Conversion reports. It allows you to see navigation paths on a dynamic chart.
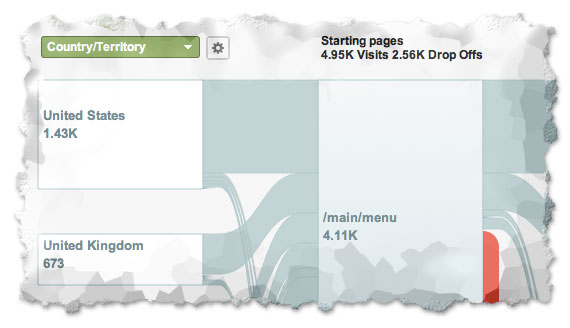
Here is an example of the Flow Visualization report and its components:
flow-nodes-connections
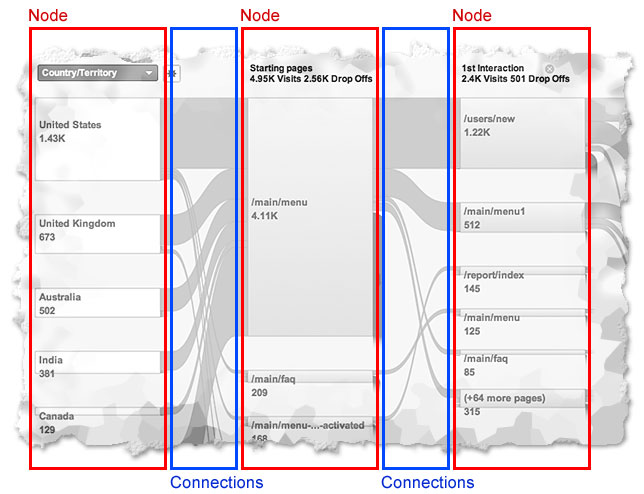
What are nodes? Nodes can represent two things:
1. The first column is a dimension that allows you to analyze how particular types of visitors navigate through your website e.g. selecting ‘Country’ shows you navigation paths for your visitors by country, selecting ‘Source’ show navigation paths for how visitors found your website.
2. To the right of the first column are the nodes which show single pages or groups of pages users have viewed within your website.
What are connections?
The connections (between the nodes) represent the navigation paths users have followed. The size of these connections is relative which means you can compare traffic volume for particular navigation paths at a glance.
Visitors Flow
The Visitors Flow report shows the different paths visitors take to navigate your website. If you have used the Navigation Summary Feature in Google Analytics and didn’t have the level of detail you required, you will like Flow Visualization because it shows all your visitor flow paths beyond the individual page.
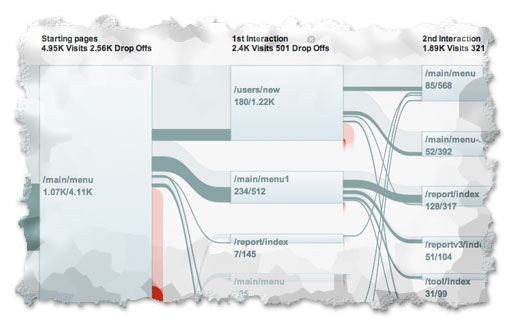
The Flow Visualization chart is interactive; allowing you to highlight different navigation paths to see flow for those sections without losing sight of the overall navigation picture.
path-flow
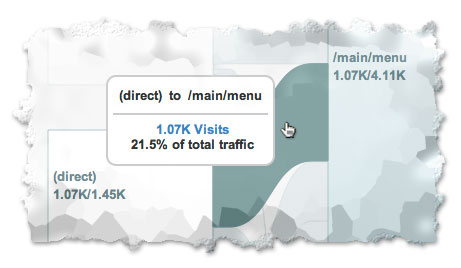
The Flow Visualization chart also displays percentages of traffic traveling between pages as well as raw numbers. This was not possible in the Navigation Summary report. Now you can see the actual number of visitors dropping off at particular points!
goal-flow-path
Goal Flow
Goal Flow is fantastic! You can apply Advanced Segments to visitor conversion paths. This was not possible with the standard Funnel Visualization report. Goal Flow allows you to apply the default Advanced Segments and your own Custom Segments to understand how particular segments of traffic navigate through your Conversion steps.
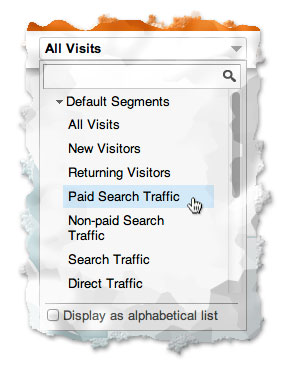
goal-flow-advanced-segments
The one thing missing from the Goal Flow report is the ability to scroll horizontally. This means if you are looking at the report on a smaller screen for example, you have to use the arrows to navigate left and right which makes it difficult to see the entire flow chart.
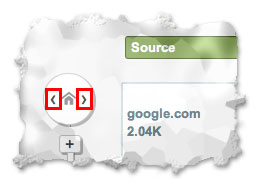
goal-flow-navigate
Watch our video on using the Flow Visualization reports:
Enjoyed the video? Checkout more Google Analytics videos on our YouTube channel.
Comments