Exit Pages in Google Analytics 4
Loves Data
Understanding user behavior is super important, especially if you’re trying to improve and optimize your website. Two key metrics that marketers need to pay close attention to are ‘Exits’ and ‘Exit Rate’.
Knowing where users leave your website can provide valuable insights to help improve user experience and identify opportunities to boost conversions and conversion rates. In this blog post, we’ll take a look at exit pages in Google Analytics 4 (GA4) by exploring what they are and how to analyze them.
Let’s get started!
What Is an Exit Page?
An exit page is the last page someone views on your website before they leave and their session ends. It is their last stop on your website prior to closing the browser tab or moving to a different site.
For example, if someone arrived on your website’s home page, browsed for a bit, and then left via the contact page, the contact page would be their exit page.
Or if you have an ecommerce website and someone visits a specific product page and then closes the page without purchasing anything, the product page is their exit page.
How to Find Exit Pages in Google Analytics 4
The standard preconfigured reports in Google Analytics don’t include the ‘Exits’ metric, and currently (as of January 2024), it’s not possible to add the metric to the standard reports. However, you can report and analyze exits by creating an exploration report.
Follow these steps to build a custom exploration report to identify your top exit pages:
- Log into Google Analytics and open your GA4 property.
- Navigate to ‘Explore’.
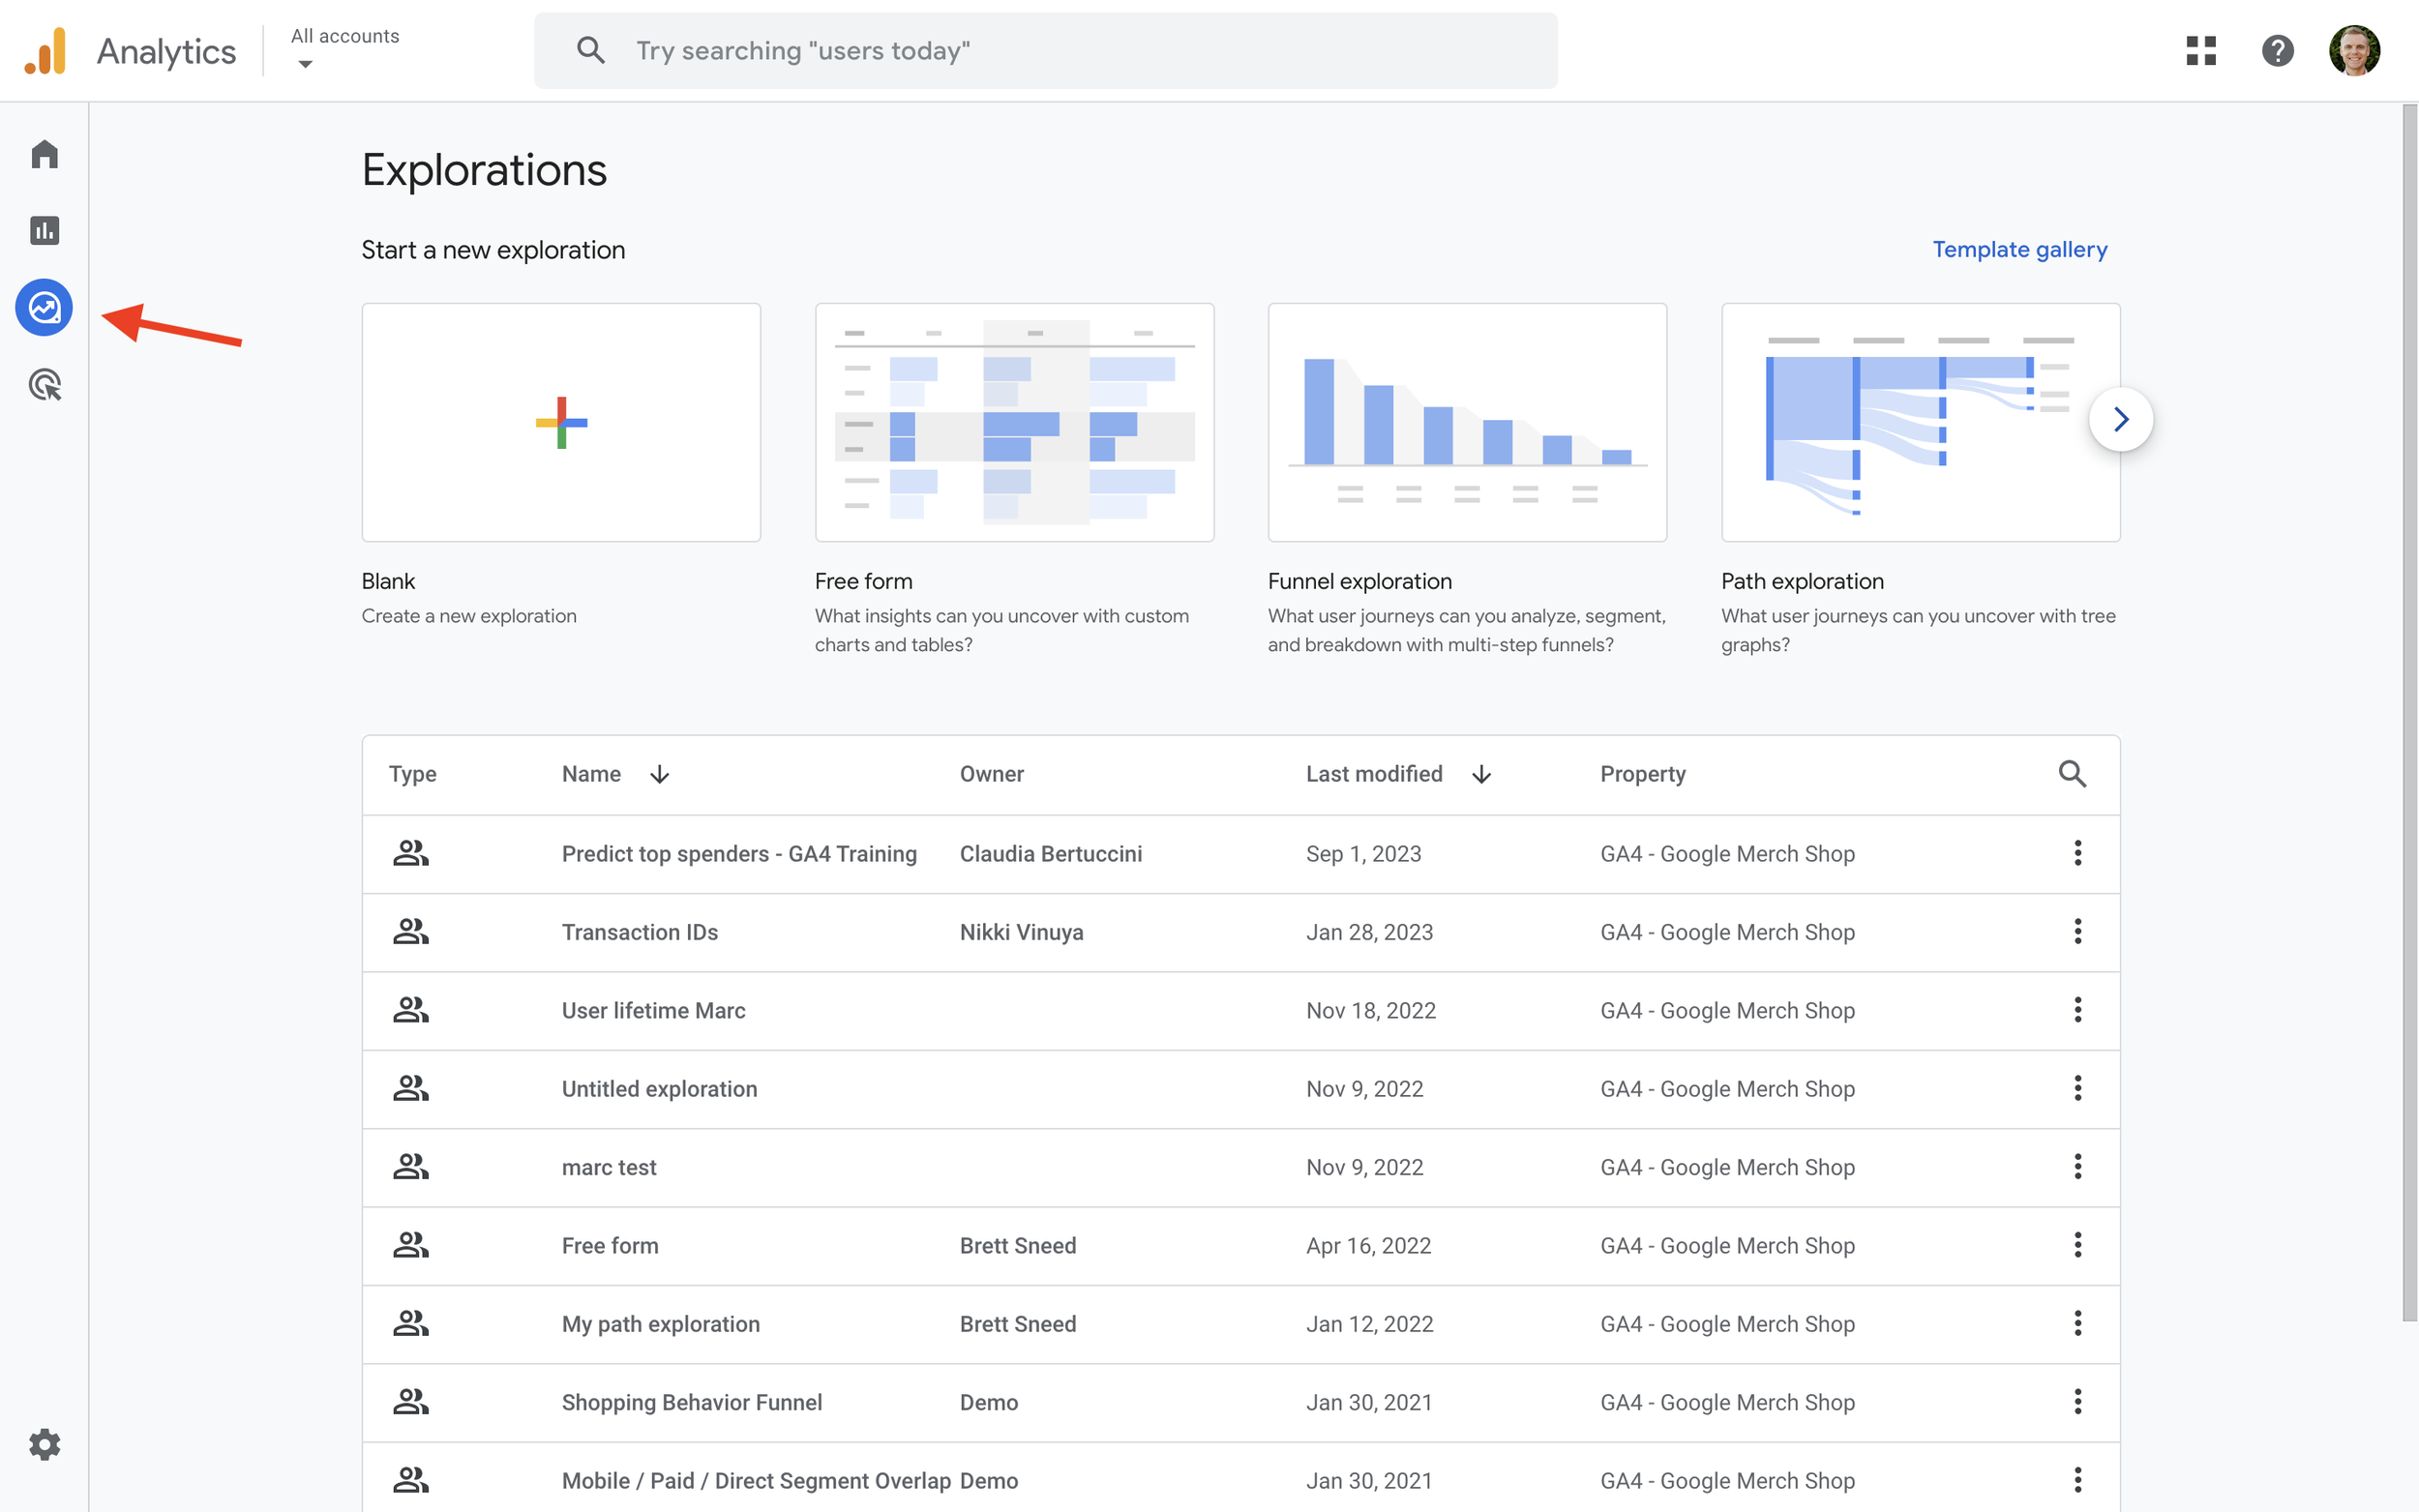
- Click on ‘Blank’ to create a new exploration report.
- Click the plus sign next to ‘Dimensions’.
- Select ‘Page path and Screen Class’. You could also select one of the other dimensions if you prefer, like ‘Page Path + Query String’, ‘Page Location’, or another dimension.
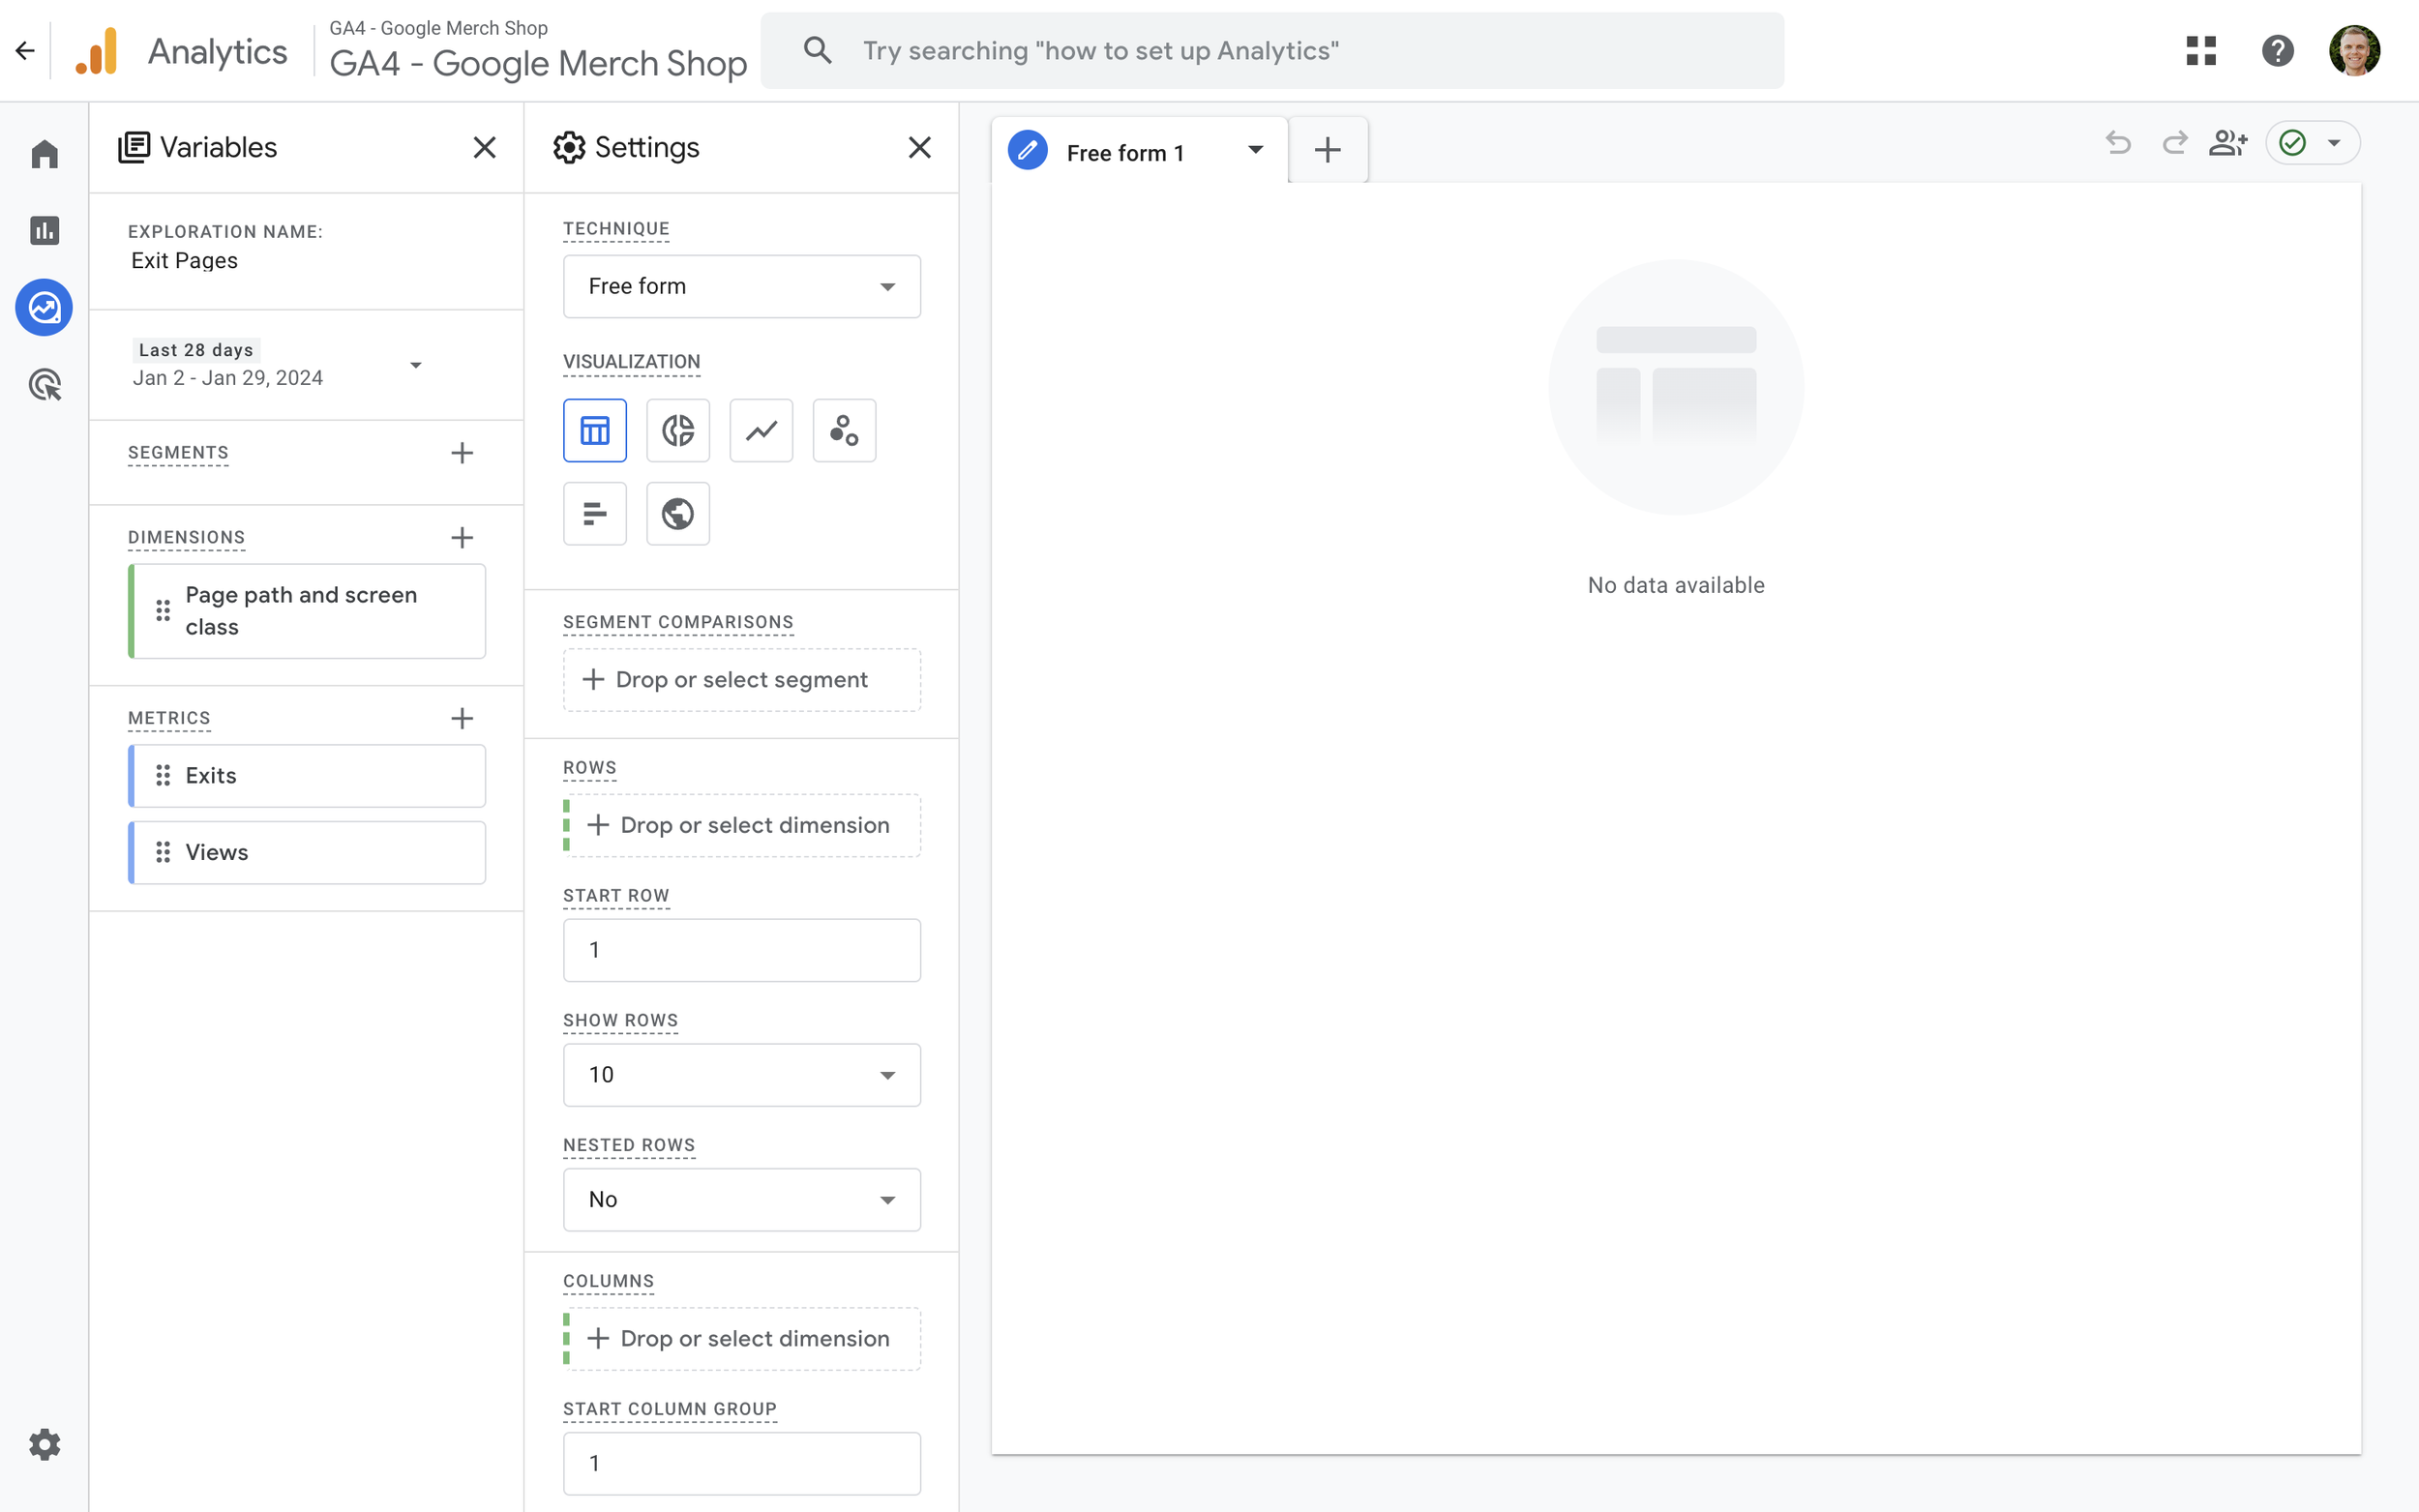
- Click ‘Import’ on the top right corner.
- Click the plus sign next to ‘Metrics’.
- Select ‘Exits’ and ‘Views’.
- Click ‘Import’ on the top right corner.
- Double-click the dimension and metrics to add them under ‘Rows’ and ‘Values’ (or drag them under ‘Rows’ and Values’ to add them to the report).
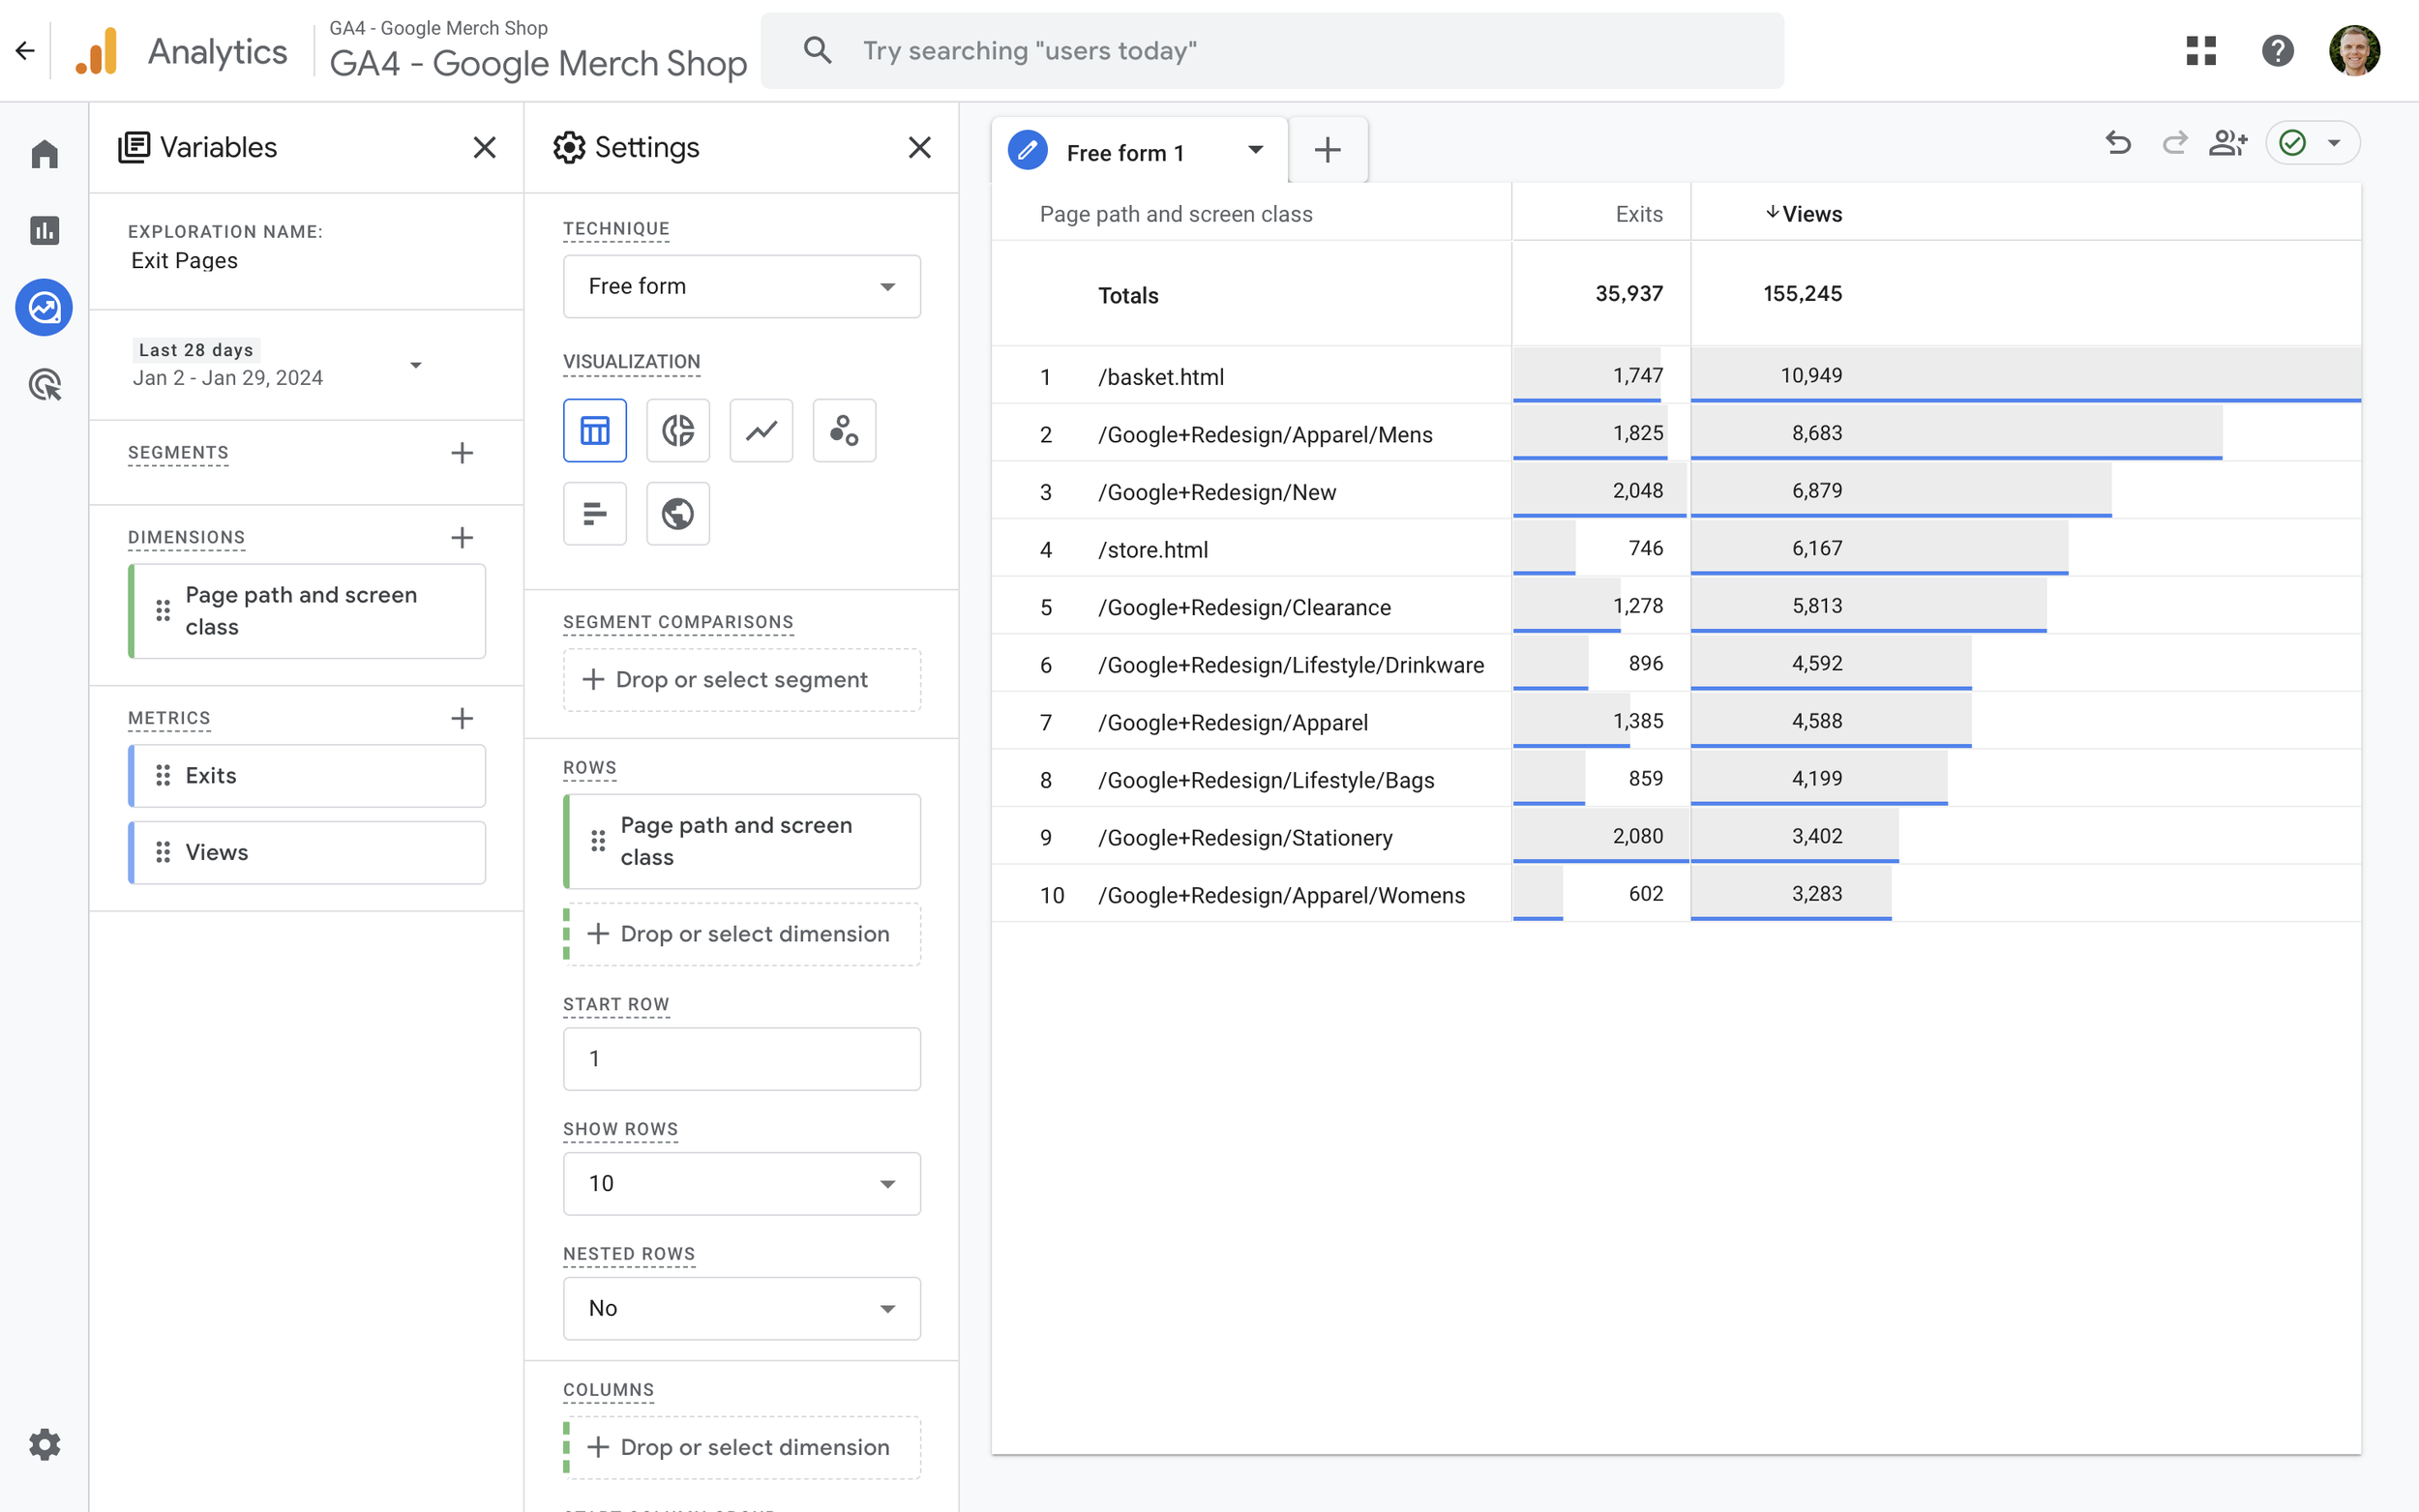
You can now view pages along with the number of times they were viewed (under the ‘Views’ column) and the number of times those pages were exit pages (under the ‘Exits’ column).
Exit Rate in Google Analytics 4
Currently (as of January 2024), there is no ‘Exit Rate’ metric in Google Analytics 4 (GA4), so until it’s added, we will need to calculate exit rate outside of our reports. And while some other articles mention being able to calculate exit rate using Looker Studio (previous Google Data Studio), this simply isn’t possible. This is because the ‘Exit’ metric we’ve already discussed isn’t currently available using the GA4 API, which is what Looker Studio uses to pull data into your reports.
The other option that comes to mind is using a calculated metric for exit rate. However, this leads to another dead-end as calculated metrics don’t let us use the ‘Exits’ metric either. So until Google adds the exit rate metric to our reports, adds ‘Exits’ to the GA4 API’, or lets us use ‘Exits’ in calculated metrics, we’re stuck.
This means the only option available right now is to export ‘Exits’ and ‘Views’ using an exploration report and manually calculate the exit rate for our pages. Doing this allows us to understand the most popular exit points on your website. And to calculate the exit rate for each of our pages, we need to use the following formula:
Exit Rate = Exits / Views
Once you’ve calculated exit rate, it tells you what percentage of users left your website after seeing a given page. A high exit rate on a specific page can indicate problems that you should probably address, like poor-quality content or a confusing user interface. However, there are times when a high exit rate will be expected for certain types of pages. We will talk more about this in a moment.
How to Report Exit Rate
The best method currently available (as of January 2024) is to follow the steps we covered previously to create an exploration report that includes your pages, along with ‘Exits’ and ‘Views’. Then you will need to follow these additional steps to calculate exit rate using Google Sheets:
- Check that the correct date range is selected.
- Click the download icon on the top right corner.
- Select ‘Google Sheets’ (or ‘CSV’ if you will be using other software to calculate the exit rate).
- Click ‘Import The Data’
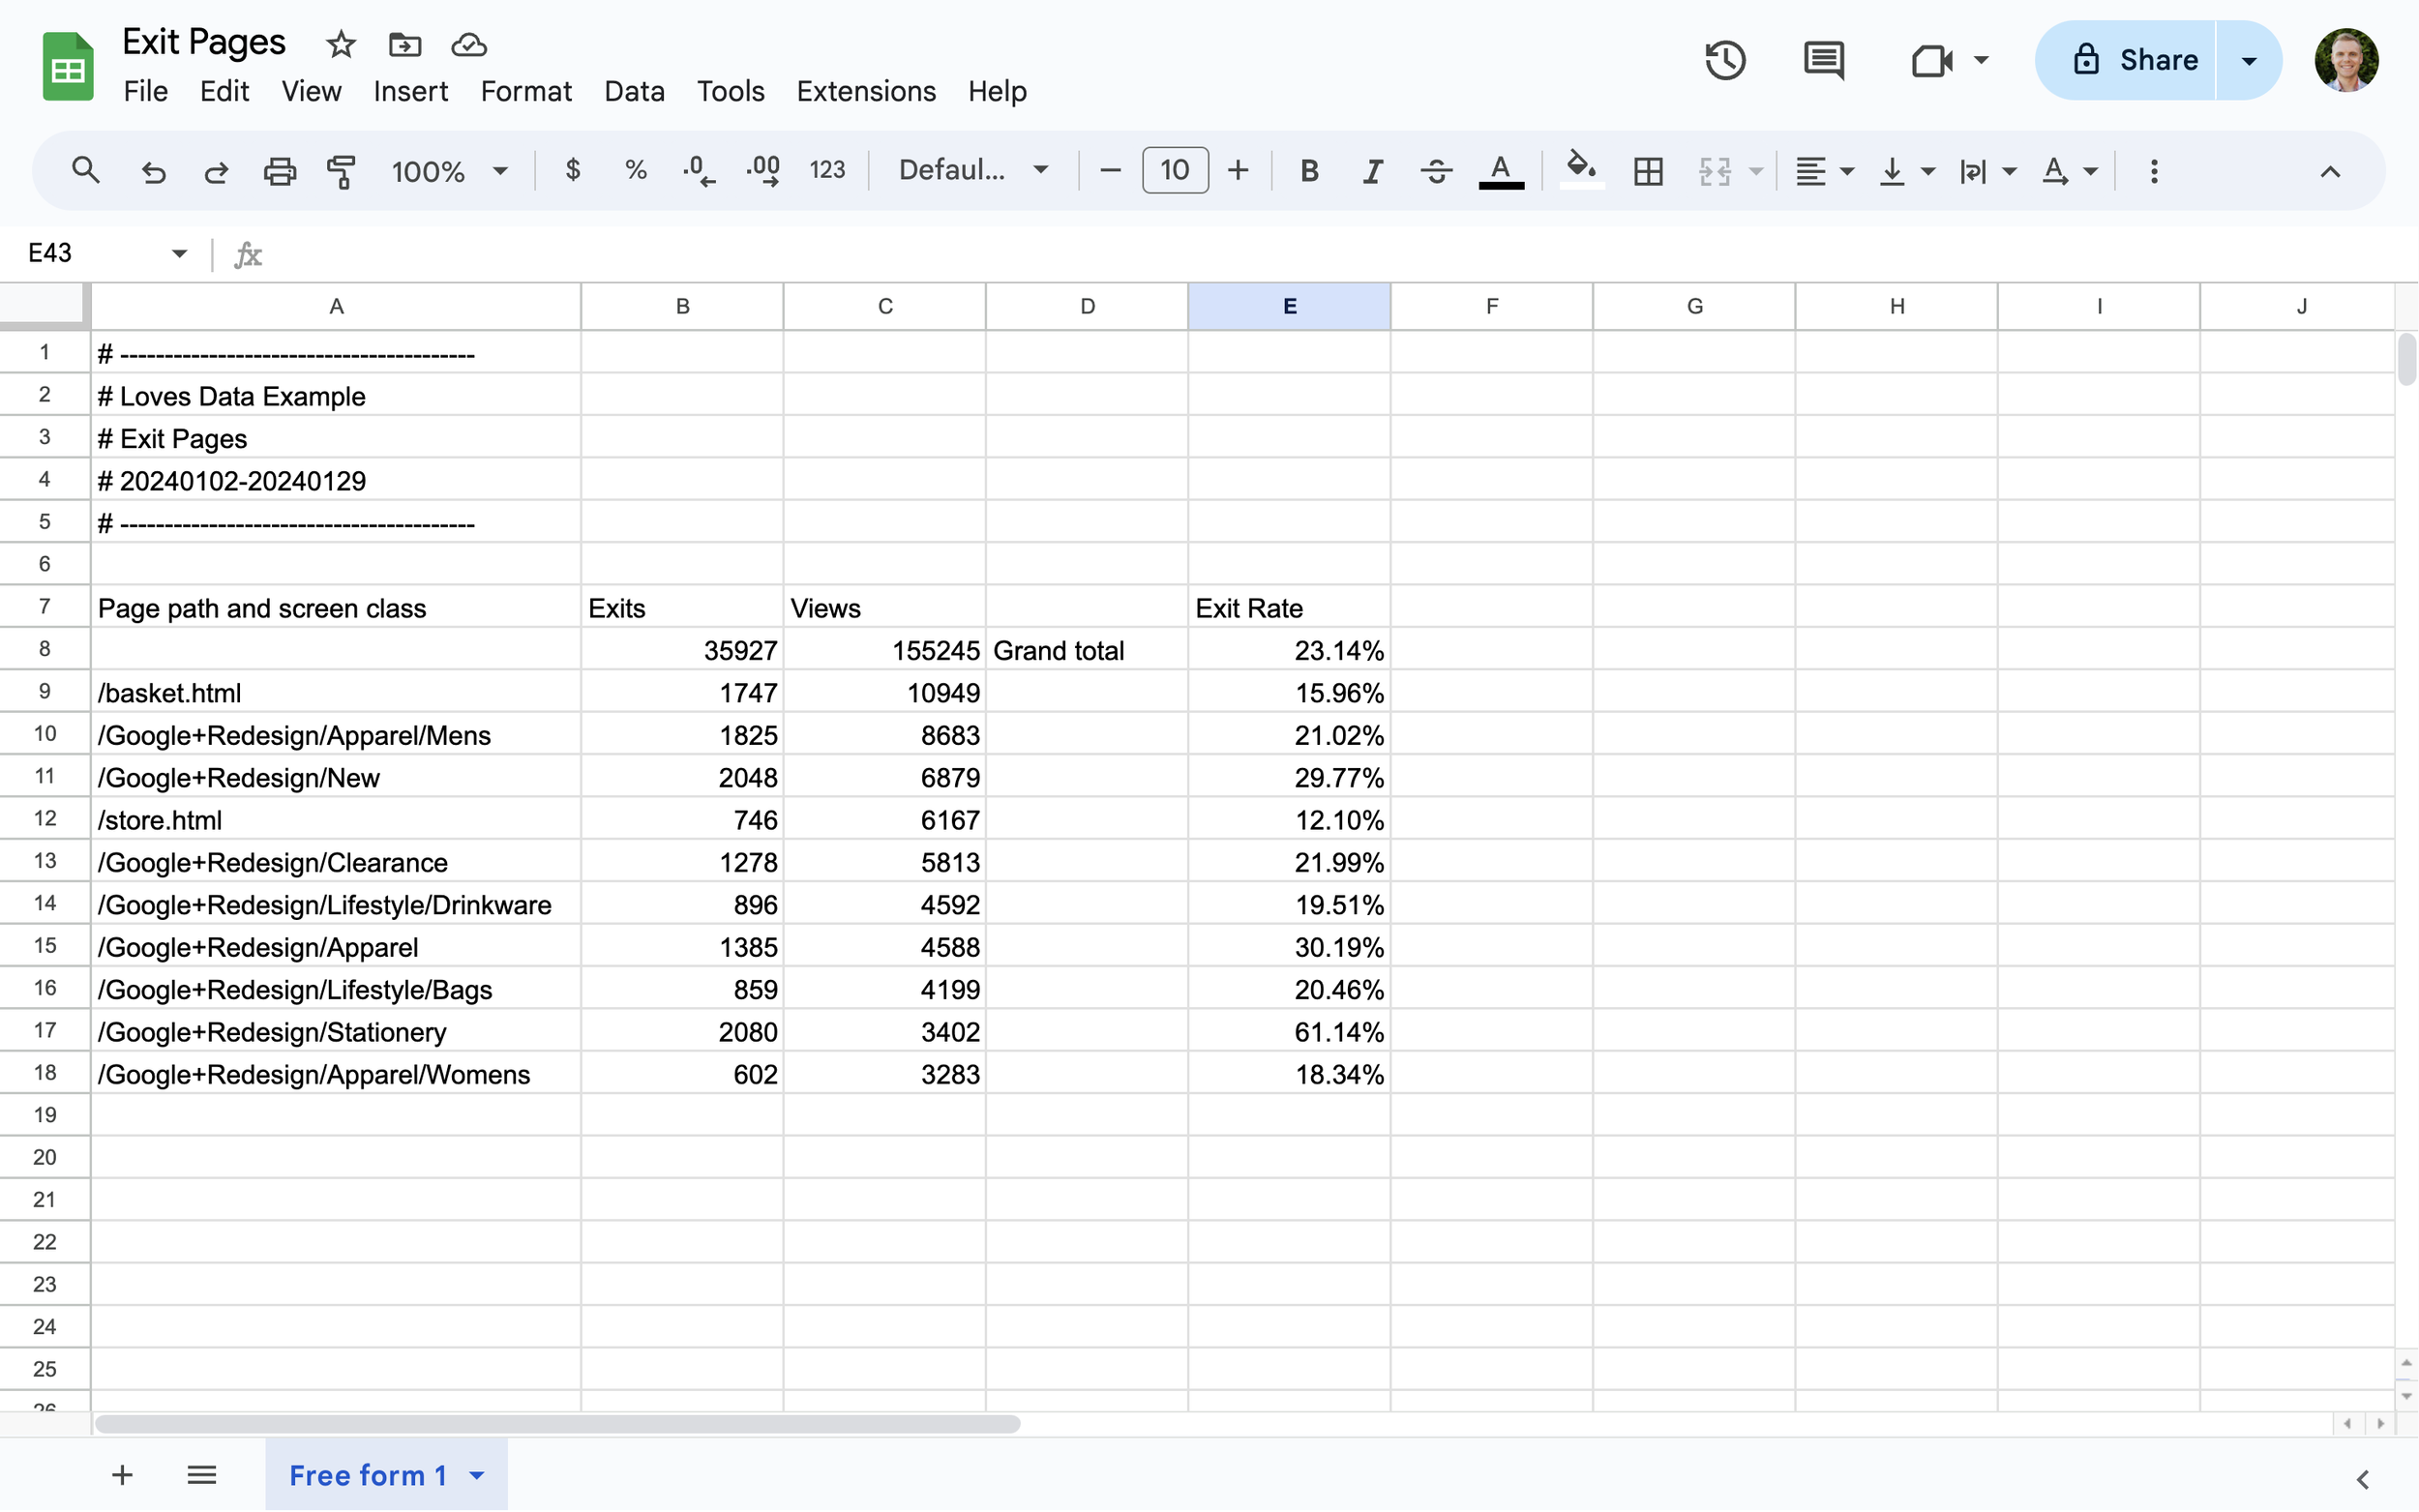
- Use a new column to calculate exit rate. Here’s an example of the formula you could use if ‘Exits’ are in column B and ‘Views’ are in column A:
=SUM(B8/C8)
- Finally, you can adjust your new ‘Exit Rate’ column to present the value as a percentage.
Exit Rate vs Bounce Rate: What’s The Difference?
It can be easy to confuse bounce rate and exit rate, but these are two completely different metrics.
Bounce Rate is a metric that shows the percentage of single-page sessions (where a user leaves your website without interacting with the page). In other words, only one page was visited before the user ‘bounced’ from the website. The entrance page and exit page are the same.
Exit Rate, on the other hand, focuses on users who have engaged with pages and then leave your website. In other words, bounce rate focuses on the initial interaction, while exit rate looks at where users leave your site. This is regardless of the number of pages viewed.
Is a High Exit Rate a Bad Thing?
High exit rates are not necessarily a bad thing. It all depends on the context and the purpose of the page. Some pages will have a high exit rate because they are endpoints in a user journey.
For example, a thank you or confirmation page that users view after completing a lead form or purchase. It is expected to have a higher exit rate because users are more likely to leave the site after they’ve already found what they want and converted.
However, if you find high exit rates on pages that shouldn’t be exit points, this could indicate certain issues that you should address. For example, if your product pages or important landing pages have a high exit rate, it could indicate issues with content, navigation, or usability.
When you’re looking at the exit rates on your website, it is important to consider the role of the page and its position in the user journey. A high exit rate on a page that shouldn’t be an endpoint can indicate potential for improvement.
Why Track Exit Pages?
Now that we know how we view exit pages in GA4, you may be wondering whether this is important or not. Here are some compelling reasons why it’s a good idea:
- Identify Vulnerabilities: Monitoring exit pages helps identify weak points on your website that cause users to leave. This information can help you optimize pages and avoid visitors falling out before they make a conversion.
- Improving User Experience: You can enhance the overall user experience by addressing potential issues on exit pages. This can lead to higher user satisfaction and longer visits.
- Increase Conversions: Reducing exit rates on key product or checkout pages for ecommerce websites can directly affect conversion rates and revenue. If you see, for instance, that people are leaving your website when they get to the billing page, you can take measures to simplify the payment process for customers.
- Content Optimization: By analyzing exit pages, you can find content that doesn’t resonate with your audience. This ensures that you only provide content that users will engage with. If a visitor cannot find what they were looking for on your website, they will simply exit.
- Improved Navigation: Studying the exit pages on your site can help you identify roadblocks that users may encounter. If users tend to log out after experiencing specific navigation challenges, you can make improvements to increase usability.
Conclusion
In Google Analytics 4, exit pages can provide additional insights about user behavior and the effectiveness of your website. Any website owner or digital marketer must aim to understand exit pages, how to analyze exit rates and the difference between exit rate and bounce rate. Even if a high exit rate on some pages could be expected, it's crucial to use this information to find areas that can be optimized and improved.
You can keep users interested and boost conversion rates by using the strategies we’ve covered in this blog post. Exit pages are automatically tracked in Google Analytics 4, and the information you get from this can help you improve your website, content, and marketing efforts over time.


Comments