Data Visualization Mastery with Looker Studio
Loves Data
The ability to visualize and effectively communicate complex data sets is a vital skill in today's data-driven world. Looker Studio, previously known as Google Data Studio, offers an intuitive platform for creating interactive, easy-to-understand visualizations that empower informed decision-making across your organization. With our guidance, you can master the art of data visualization, harnessing Looker Studio's capabilities to transform raw data into actionable insights.
Looker Studio is a powerful, user-friendly tool that consolidates data from various sources, such as Google Analytics, Google Sheets, and SQL databases, allowing you to craft visually engaging dashboards and reports. You can turn complex data sets into clear, impactful visuals by leveraging Looker Studio's expansive library of visualizations, customizations, and interactive features. Whether you're looking to monitor key performance indicators, showcase trends, or share insights across your organization, Looker Studio has you covered with its versatile and easy-to-share reporting options.
Loves Data supports you in mastering Looker Studio, offering expert guidance to help you navigate the platform's many features and best practices for effective data visualization. From setting up data sources to designing custom dashboards, our team of professionals will ensure you develop the skills and knowledge necessary to create insightful and visually engaging reports. By partnering with us, you can confidently leverage Looker Studio's capabilities to simplify data analysis and unveil valuable insights for your organization.

Connecting Data Sources in Looker Studio: Streamline Your Data Analysis
To begin creating powerful visualizations in Looker Studio, you must first connect your relevant data sources. This process ensures seamless integration and analysis of the data that drives your dashboards and reports:
- Choose Your Data Sources: Consider which data platforms house the information crucial to your organization's decisions. Looker Studio supports a variety of connectors, such as Google Analytics, Google Ads, Google Sheets, and BigQuery, as well as SQL databases, social media platforms, and more.
- Establish Connections: Navigate to the "Data Sources" section in Looker Studio and click "Add Data Source." Follow the prompts to authenticate and connect your desired data sources.
- Combine and Blend Data: Looker Studio allows you to blend data from various sources, bridging the gaps between platforms and providing comprehensive insights. Use the built-in data blending features to create robust, multi-source visualizations.
By connecting your data sources in Looker Studio, you're one step closer to unlocking the platform's potential for insightful, data-driven visualizations.
Create Stunning and Customizable Dashboards with Looker Studio
Looker Studio offers numerous visualization and customization options that allow you to craft insightful, interactive dashboards tailored to your needs:
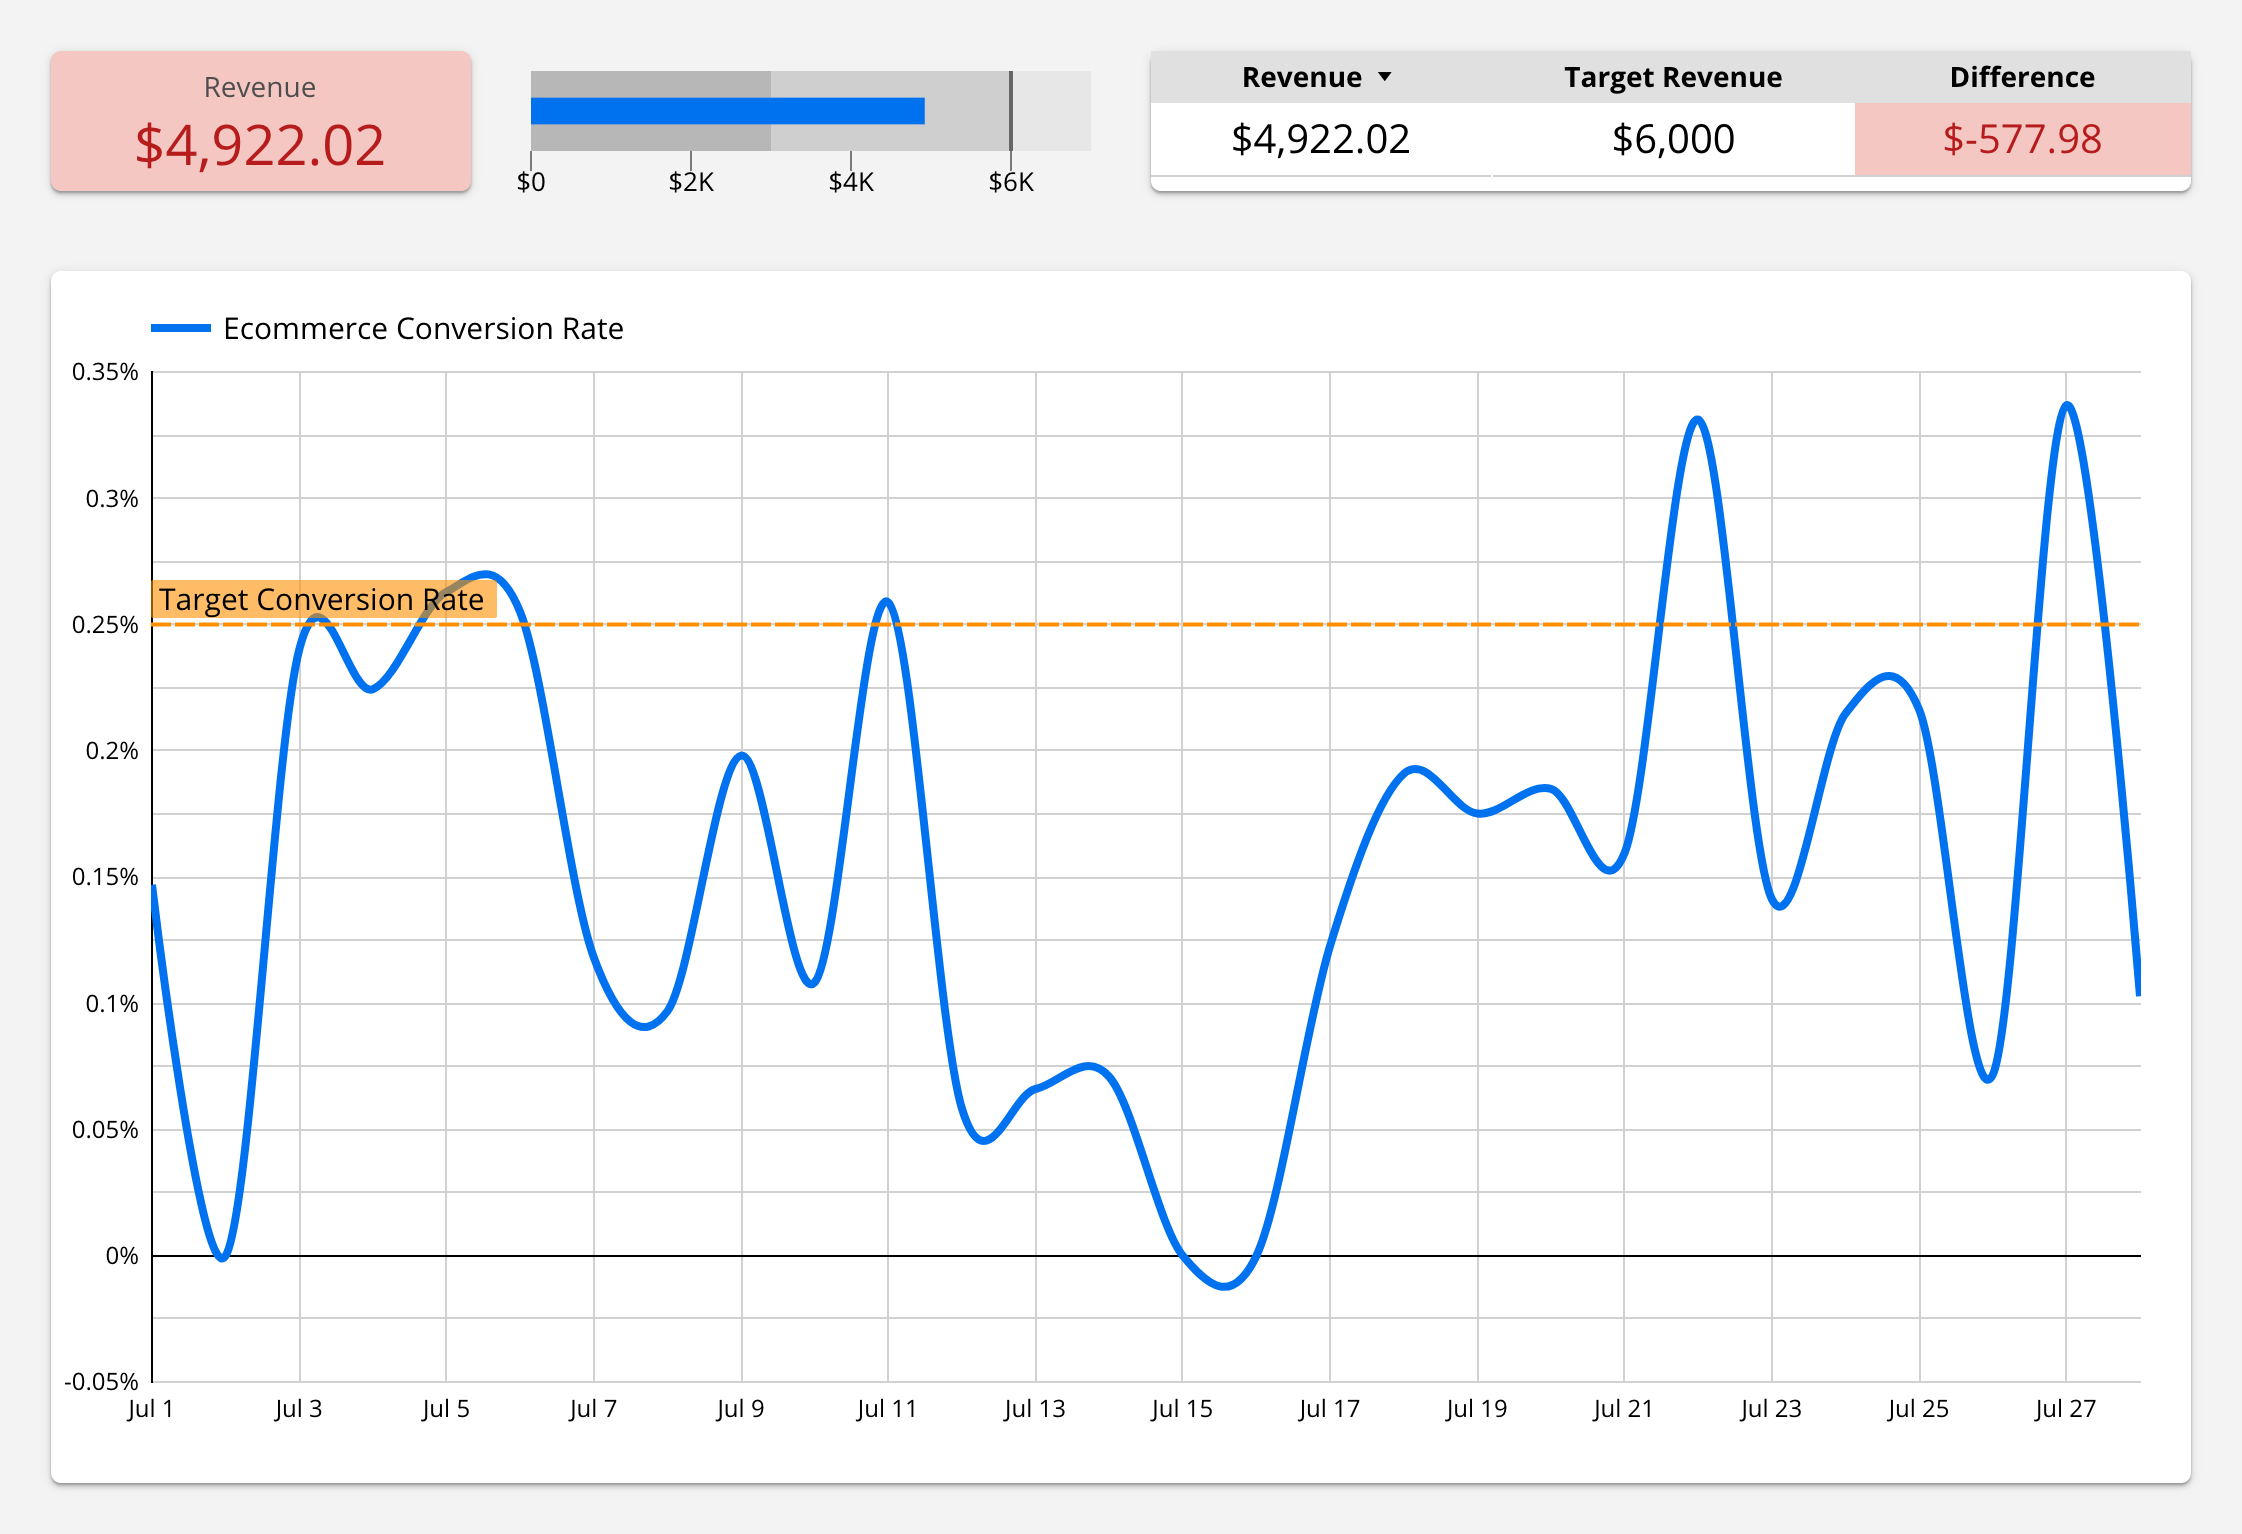
- Select Visualization Types: Choose from an array of visualization types to best represent your data, such as bar charts, line charts, pie charts, tables, and more. Utilize the best formats to clearly convey the insights you've uncovered.
- Customize Your Visuals: Customize your visualizations by adjusting colors, fonts, axis labels, and other design elements to create a cohesive, polished look that aligns with your organization's branding and style guidelines.
- Interactivity and Filters: Incorporate interactive features, such as clickable data points and real-time filters, enabling users to explore the data further and uncover the specific insights they need.
By designing visually engaging and customizable dashboards, you can hone your data storytelling and facilitate more informed decision-making across your organization.
Collaboration and Sharing: Foster Data-Driven Decision-Making Among Your Teams
Looker Studio's sharing and collaboration features ensure that your data insights have maximum impact among your teams:
- Share and Embed Dashboards: Distribute your dashboards easily with Looker Studio's built-in sharing features. Share your dashboards via unique URLs, email, or even embed them on your organization's website or internal portal.
- Collaborate on Dashboards: Looker Studio promotes collaboration by allowing multiple users to work together on creating and editing dashboards, ensuring diverse perspectives contribute to your data-driven narrative.
- Export and Schedule Reports: Export your dashboards and visualizations in a number of formats, including PDF, CSV, or Google Sheets. Schedule automated report delivery to keep your teams informed and updated on critical insights.
Empower your teams with accessible, insightful data by taking advantage of Looker Studio's collaboration and sharing capabilities.
Leverage Advanced Features and Integrations for Comprehensive Data Analysis
As you grow more comfortable with Looker Studio, delve into the platform's advanced features for even more profound data insights:
- Calculated Fields: Create custom-calculated fields to perform advanced calculations and transformations on your data, allowing for more detailed analyses.
- Advanced Filters and Segments: Utilize advanced filtering capabilities to segment your data, diving deeper into trends, outliers, and other noteworthy observations.
- Integration with Google Analytics 4: If your organization uses Google Analytics 4, you can now connect it to Looker Studio as a data source and analyze your web and app traffic using the platform's powerful visualization features.
Mastering Looker Studio's advanced features will enable you to conduct comprehensive data analyses, transforming raw data into insights that drive impact.
Transform Your Data Visualization Skills with Loves Data and Looker Studio
By mastering Looker Studio, you'll unlock the potential for compelling, data-driven visualizations that drive informed decision-making across your organization. We are here to support you in your journey toward data visualization mastery, providing invaluable guidance in navigating Looker Studio's features, best practices, and advanced capabilities.
Join Loves Data today to develop your Looker Studio skills and excel in the art of data visualization. Our team of experts will guide you as you learn to create stunning, interactive dashboards and reports that inform and engage your organization, driving data-driven success in all facets of your business. Join our Looker Studio course today!


Comments