How Does Google Data Studio Help Marketers?
Loves Data
Google Data Studio can help you make sense of your digital marketing and advertising data quickly and easily. With Data Studio, you can create simple, to-the-point reports and dashboards that are easy to share with your team and other stakeholders in your company.
Let’s learn about some of the benefits of using Google Data Studio!
What is Google Data Studio?
Google Data Studio is a free reporting and data visualization tool that can help your team save time and money. It pulls data from one or more sources, including Google Analytics, Google Ads, other Google products, and a range of third-party platforms. You can present data in easy-to-modify reports and dashboards. Data Studio also features widgets, graphs, charts, and maps to visualize your data. With its easy-to-use interface, your team can create, read, and share reports in minutes. And with a little more time and effort, you can create more complex reports, reports that include dynamic elements, and reports that clean up, modify, and combine data from multiple sources.
The Benefits of Google Data Studio
Here are some of the benefits of using Google Data Studio:
1. Get Data from Different Sources
Google Data Studio is unique and helpful because it can draw from one or more data sources. This means you can consolidate data from several critical platforms, such as Google Analytics, Google Ads, YouTube, Google Search Console, and more, into your reports.
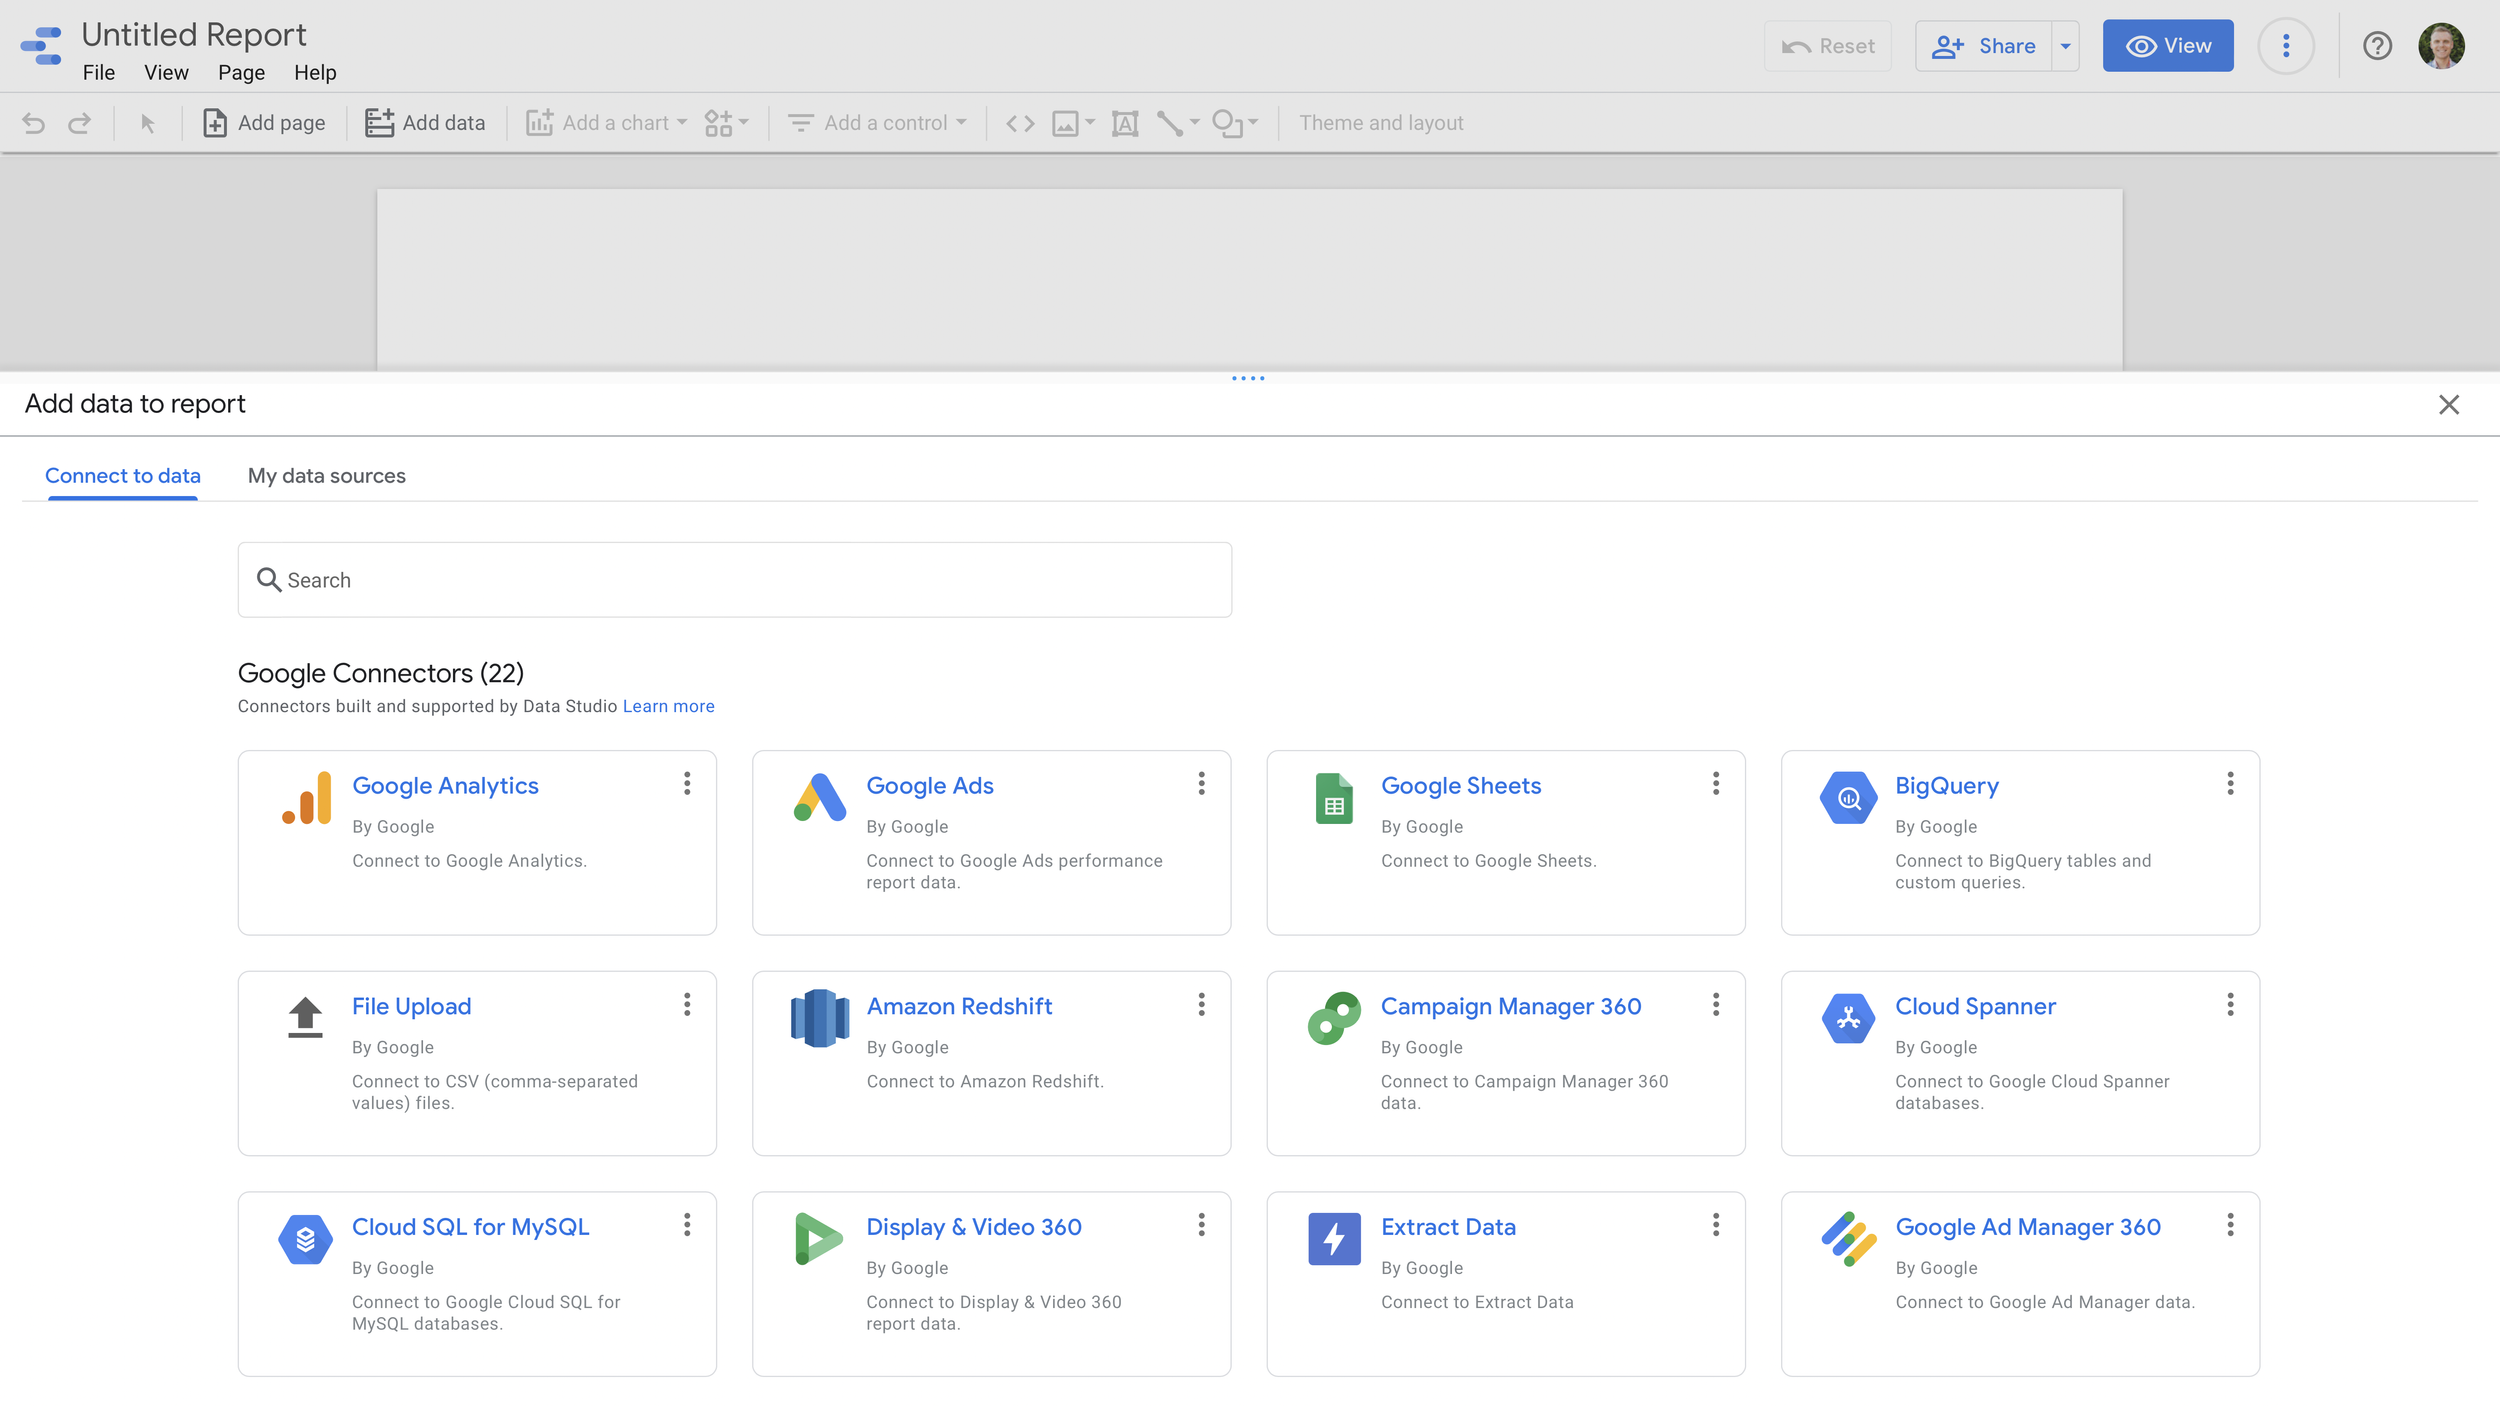
Connect one or more data sources to your reports
Data Studio’s reporting features allow you to create comprehensive reports covering all aspects of your business. This makes it easy to produce professional-looking reports that will impress your company’s decision-makers and demonstrate the value of digital marketing.
2. Convenient Sharing of Data Studio Reports
When reviewing a Data Studio report with multiple data sources, dimensions, metrics and visualizations, you might want input from your team, account managers, or other decision-makers quickly, without adding unnecessary back-and-forth. Downloading and sending files takes time, especially when you only need top-level feedback. Google has included similar sharing capabilities in Data Studio found in other tools, like Google Docs, so you can easily collaborate on reports.
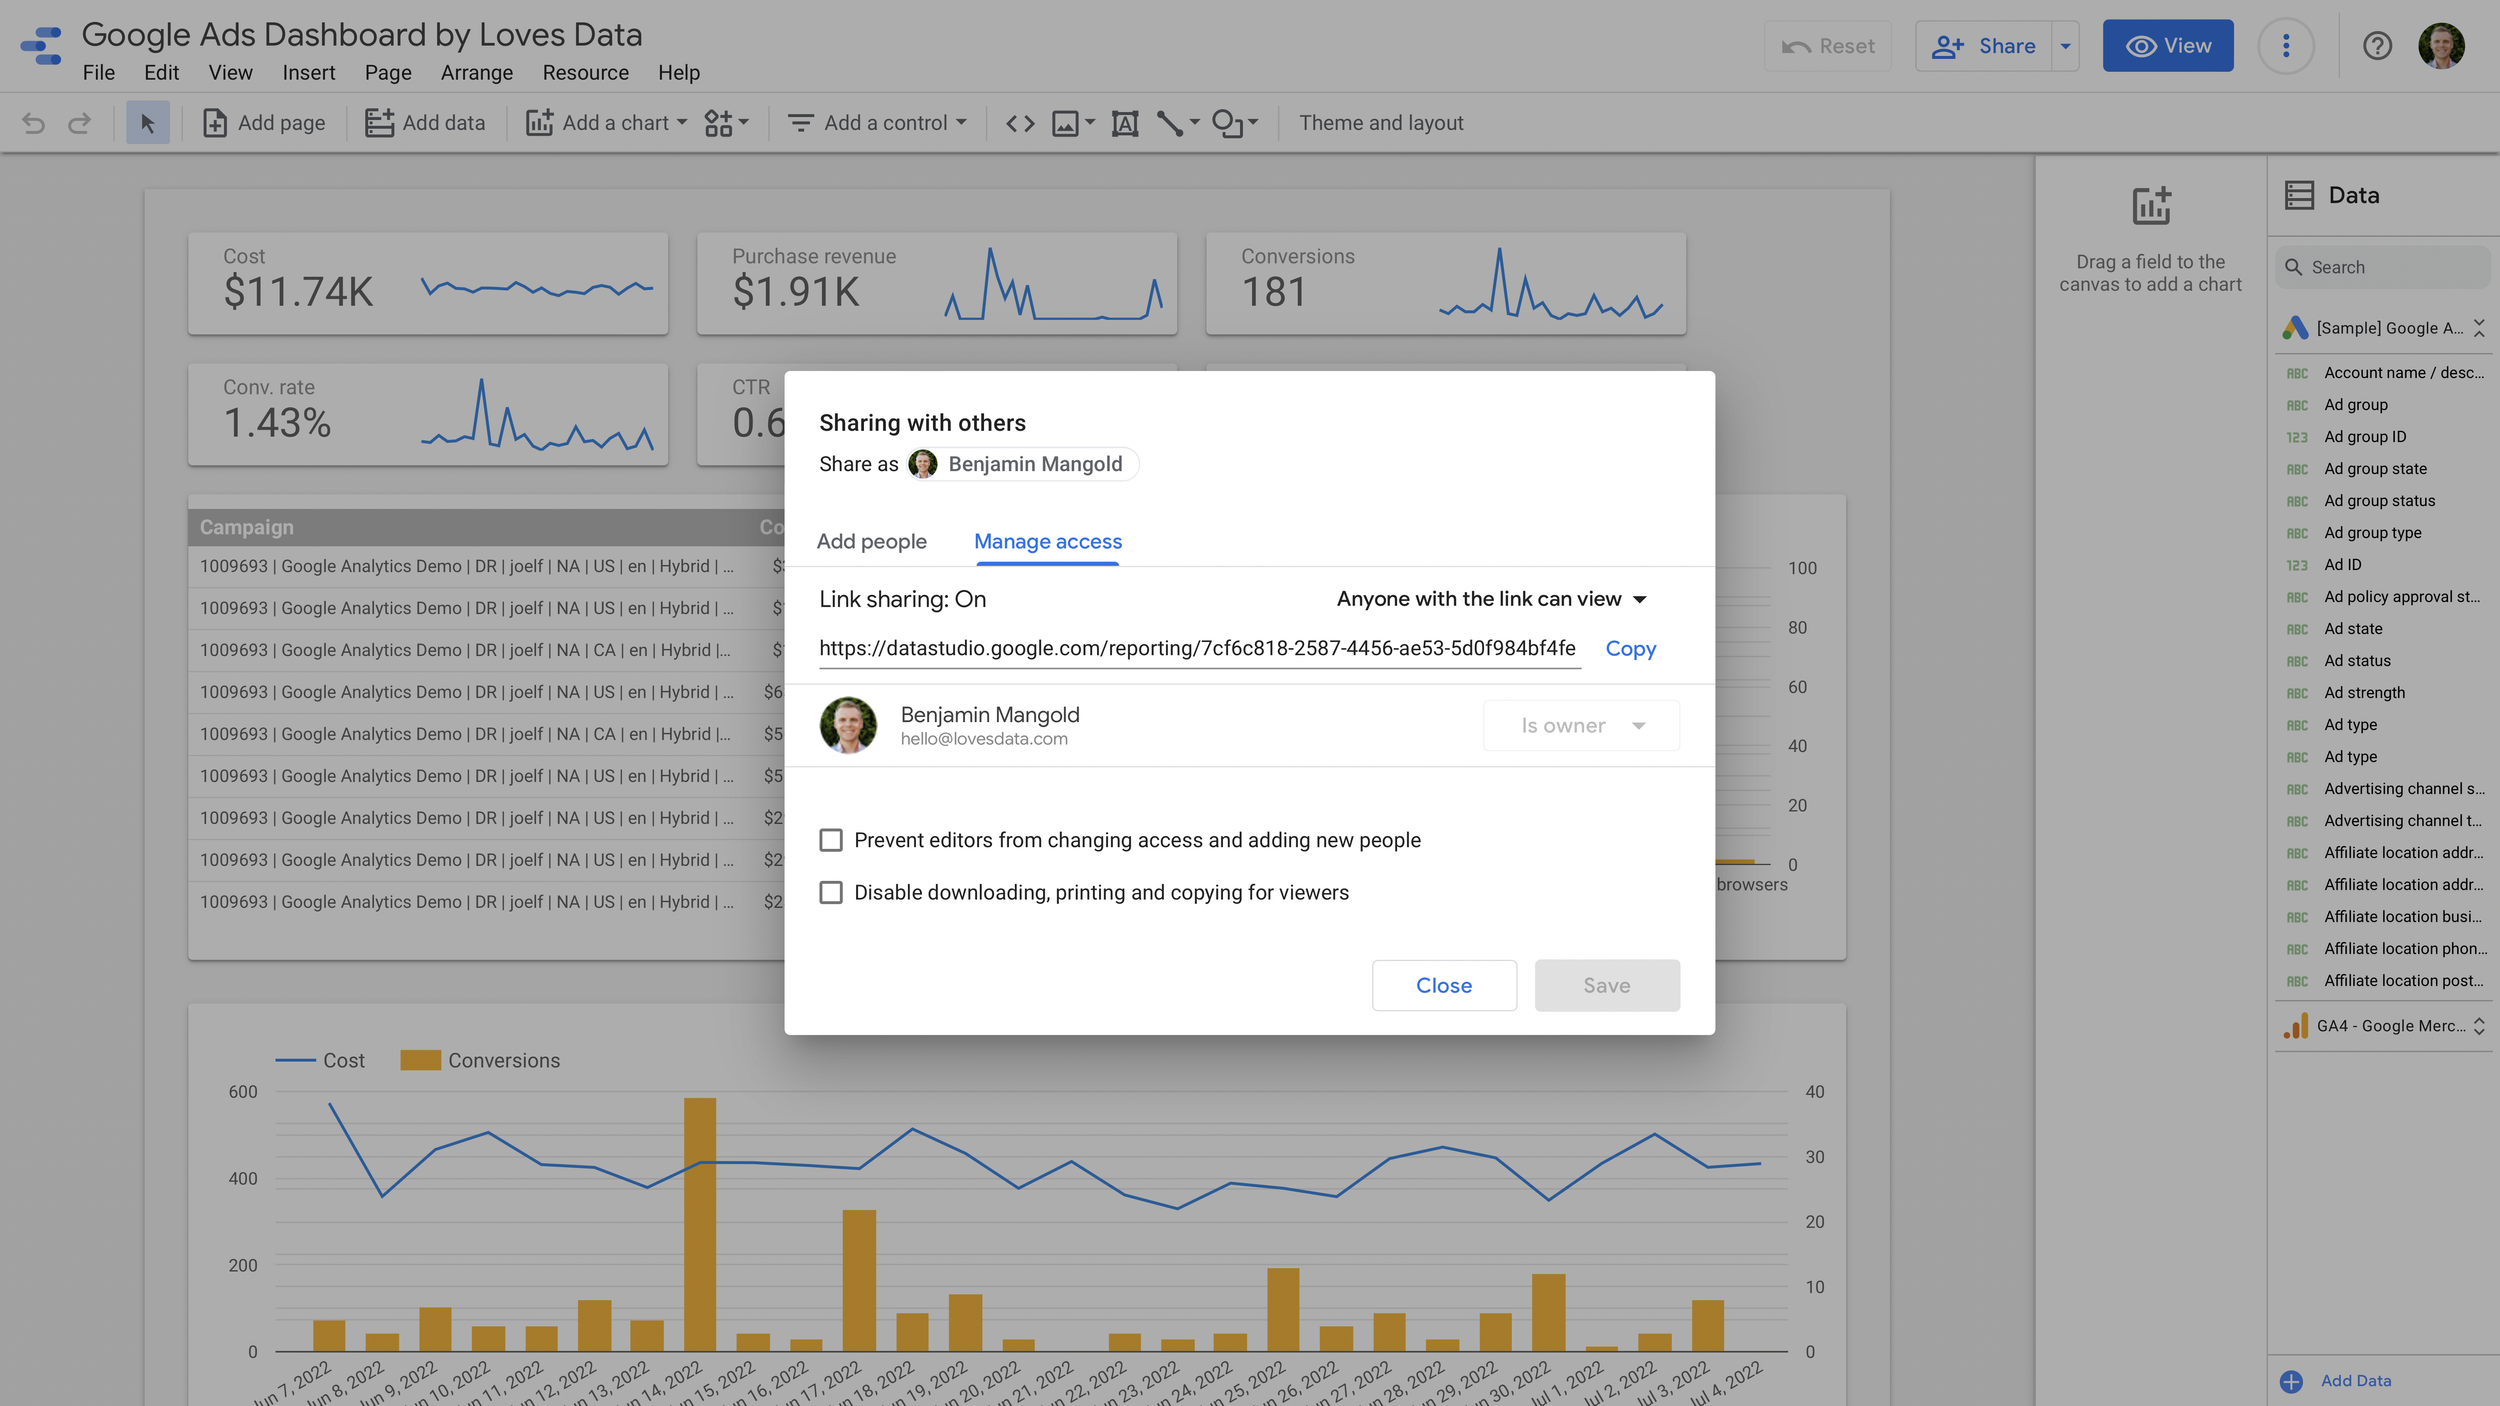
Sharing options let you control who can view and edit reports
Google Data Studio’s link sharing feature lets you control how your reports are shared, including who can view and edit reports. And if your company uses Google Workspace, you can let anybody in your organization view or edit reports if they have the link.
3. Use and Customize Multiple Charts
Google Data Studio lets you add multiple charts to your reports and provides more flexibility compared to the custom reporting options available in Google Analytics (exploration reports). You can add and customize multiple charts, including heatmaps by region, state, or country, line charts, bar charts, tables, pivot tables, and more.
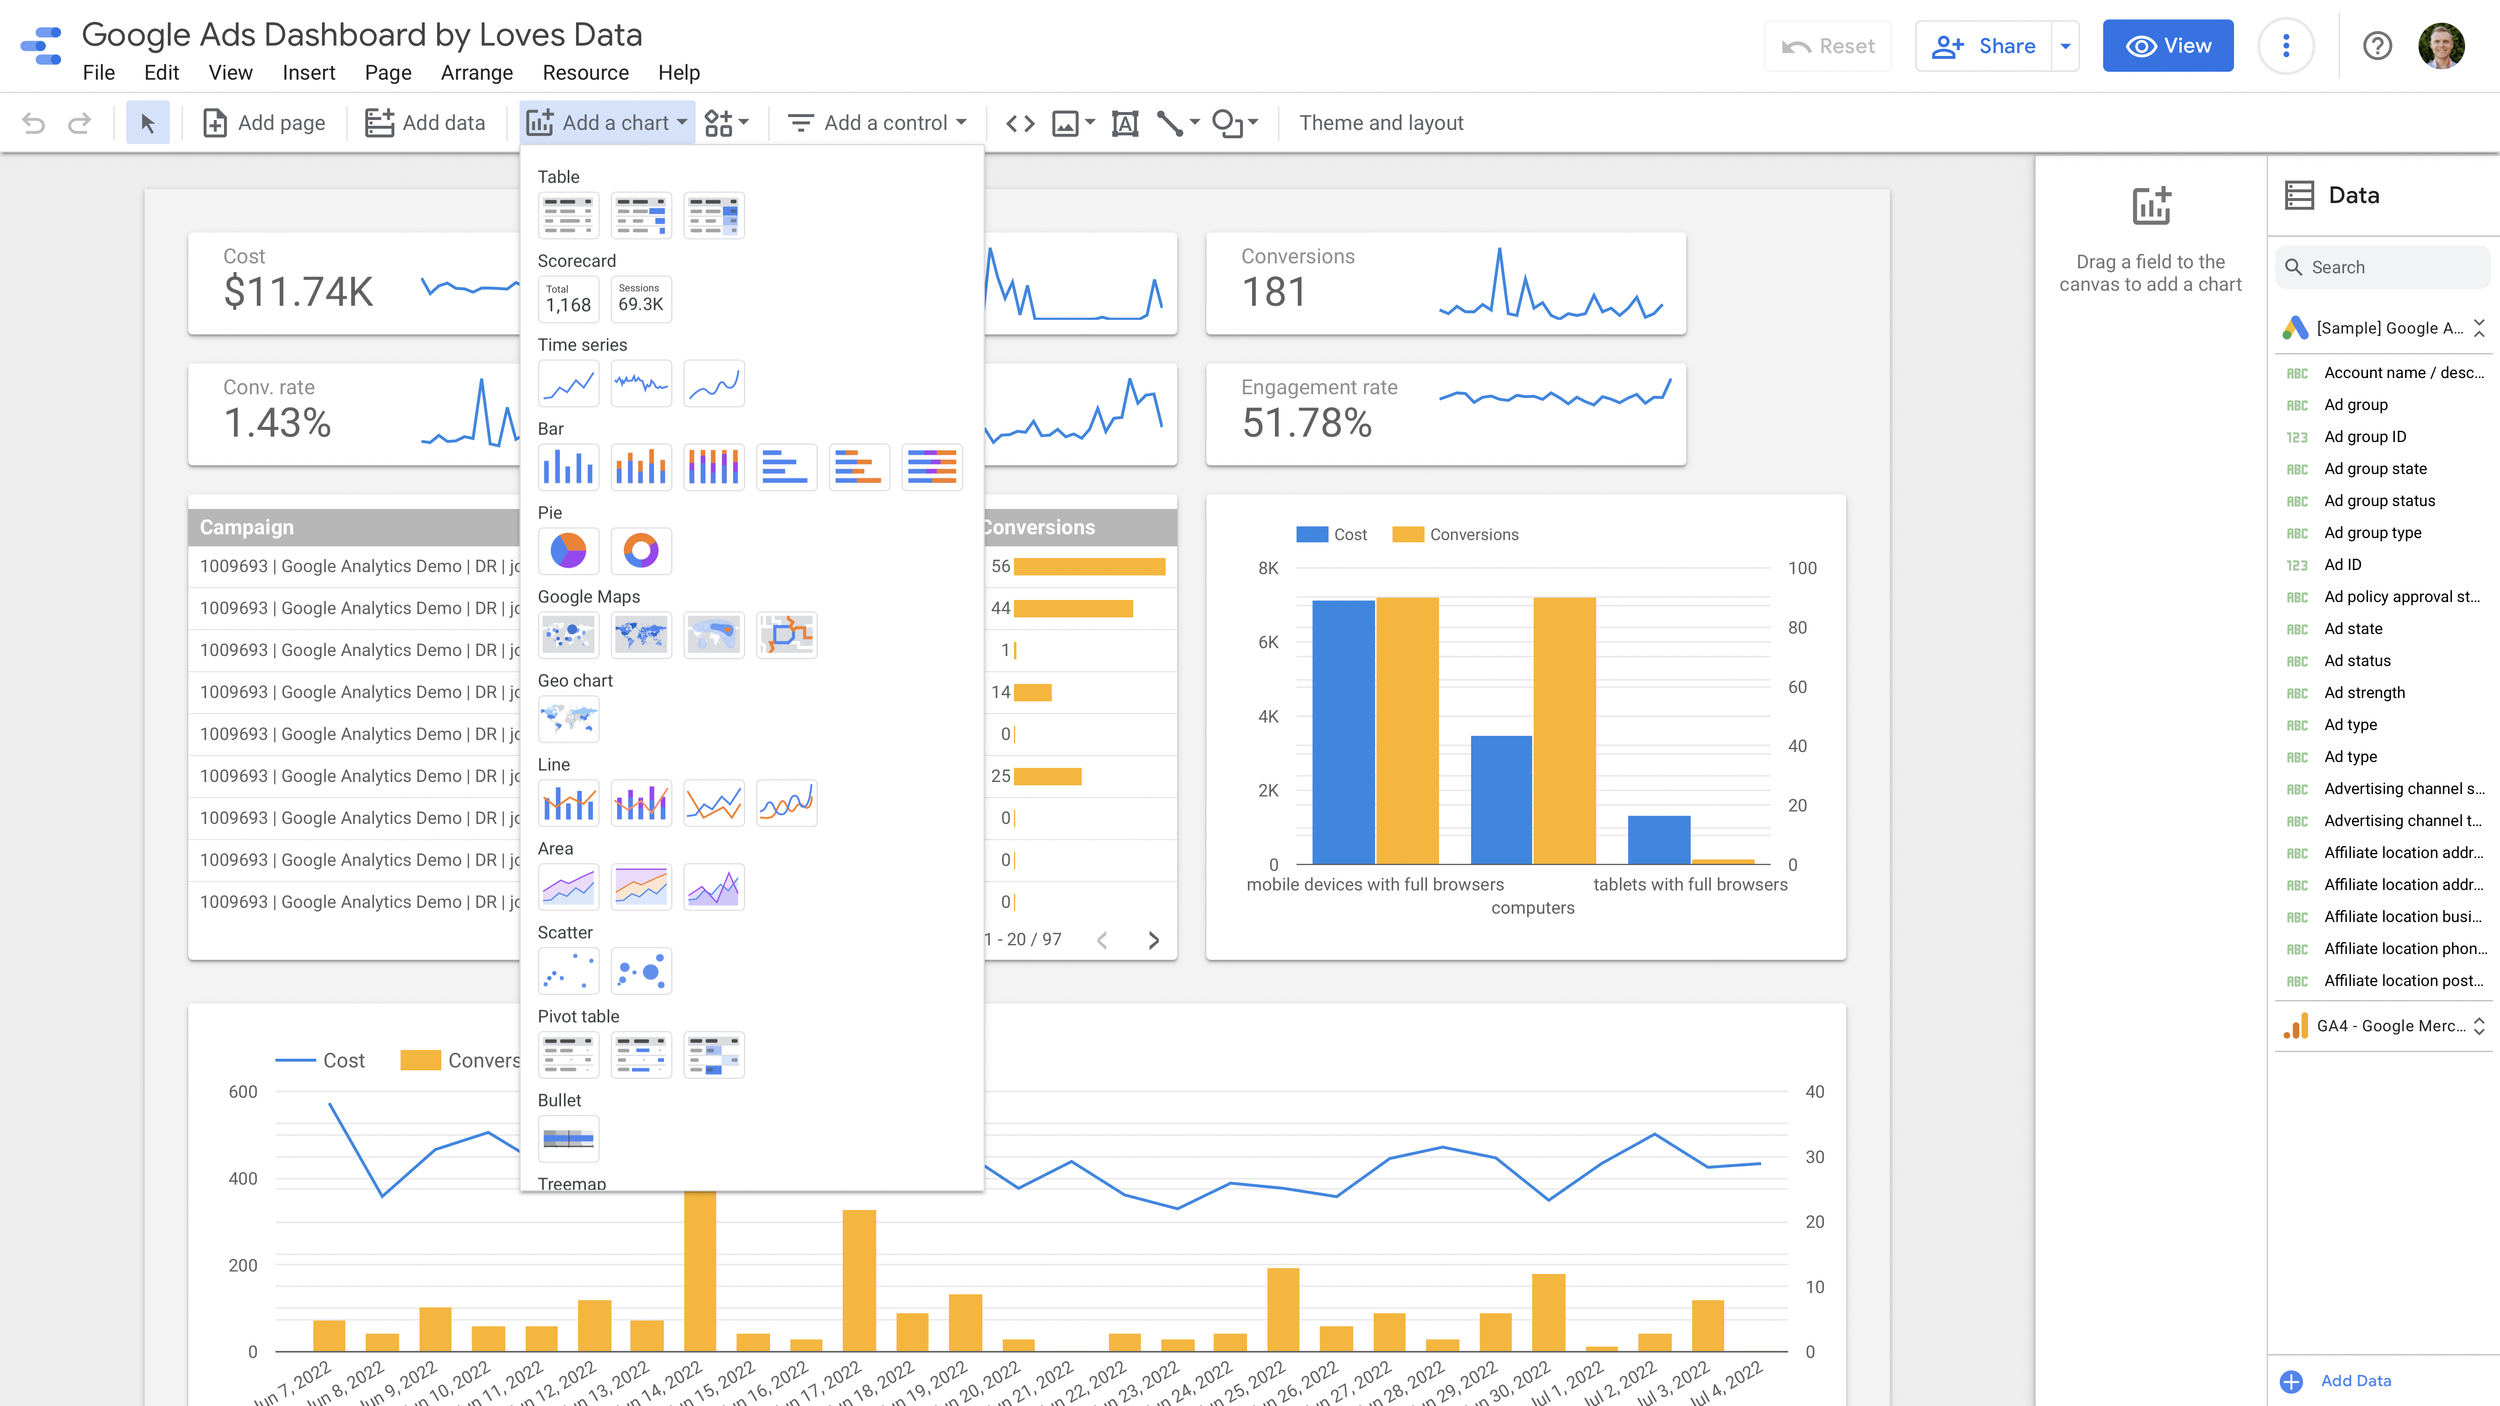
There are a range of visualization options you can use with reports
Google Data Studio gives you much control over how you design your reports and present your data. That’s one of the reasons Data Studio is becoming so popular with businesses. Apart from customizing the design of reports and styling charts, you can also customize what’s included (and not included) in charts by adding filters and adjusting how much data is included in each chart.
4. Create Meaningful Reports for Everyone
Data Studio’s flexibility allows you to create a single-page summary or 20-page report, so it adapts to your needs. You can also customize the layout of your report, including the font, colors, theme, and size, and tailor the report to be shown on-screen or printed. This gives team members and company decision-makers flexible reporting options.
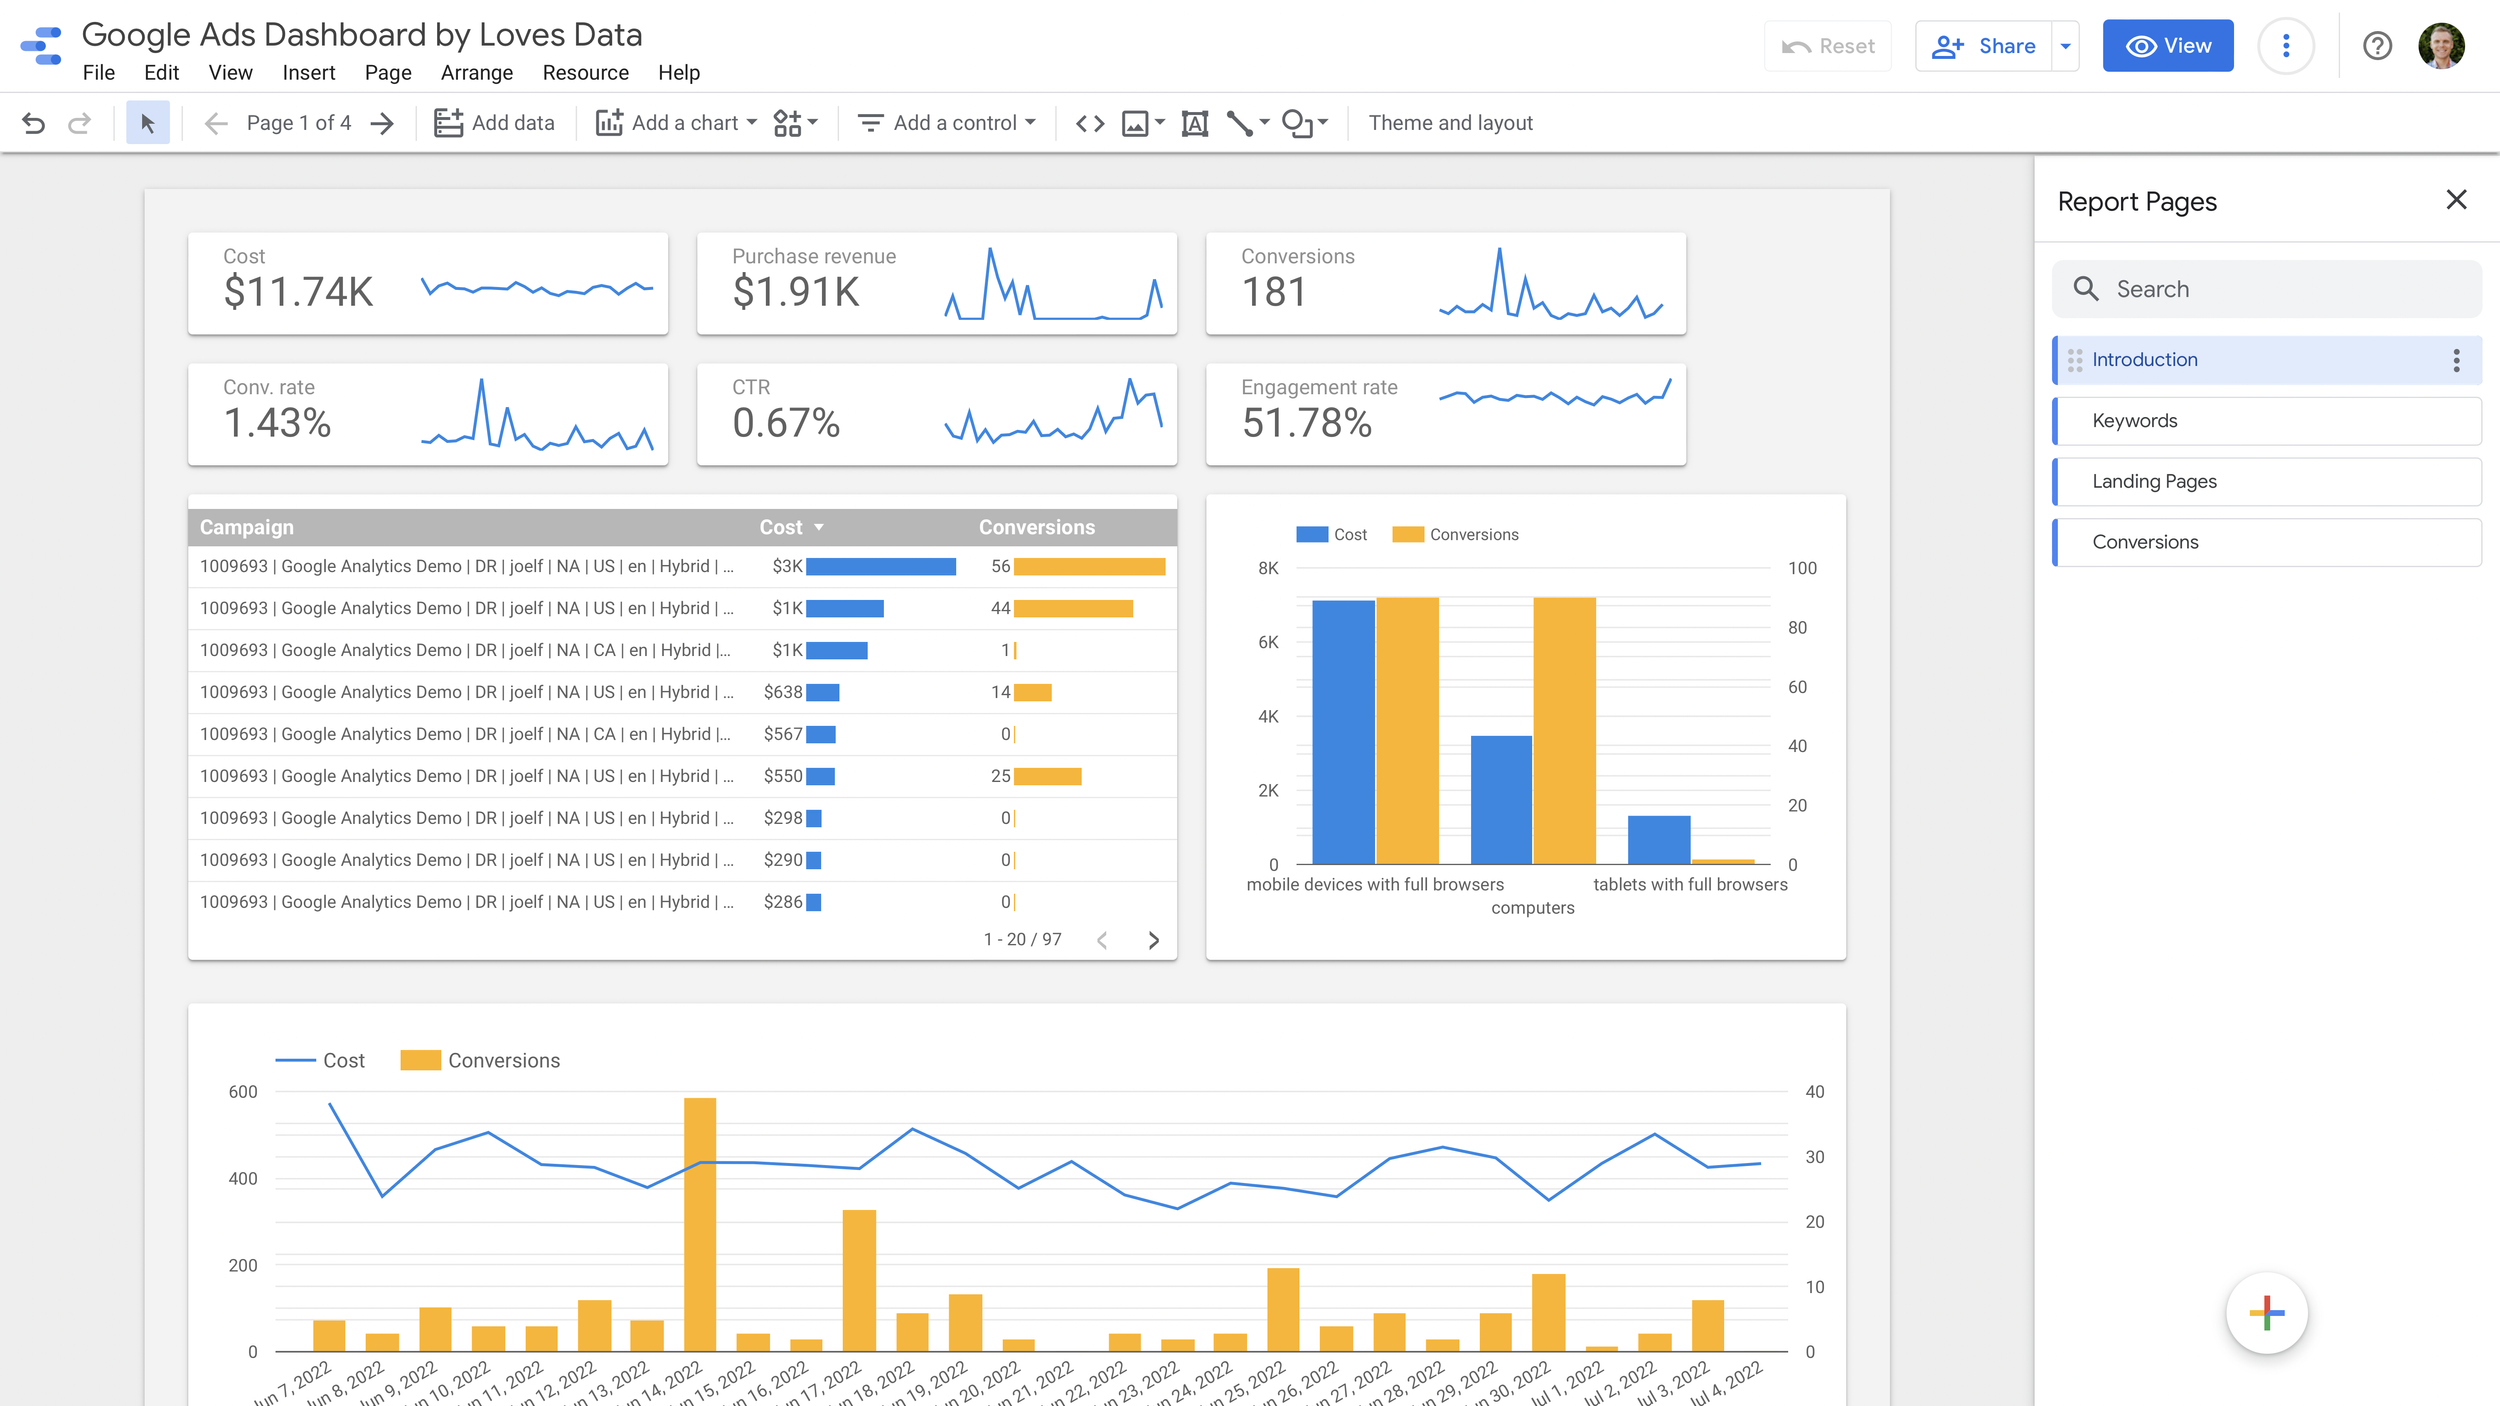
Reports can include one or more pages
5. Embed Data Studio Reports
You often want to control who can view your reports since business data is usually confidential. However, you can embed Data Studio reports on your website and share them on social networks. For example, publishing an annual report could embed charts highlighting important data on your website. You just need to make the report public and enable embedding.
Conclusion
Google Data Studio is growing in popularity and usage because it makes it easy to visualize and share data. With the right data, you can make the right decisions that will help your team improve your overall performance. It also provides additional reporting options, especially if you’re using the latest version of Google Analytics (Google Analytics 4 or GA4 for short).
Loves Data is all about getting the most out of your data. We’re about getting to the good stuff and skipping the fluff. We’re specialists in Google Analytics, Google Ads, and Google Data Studio and have consulted with some of the biggest brands and trained thousands of people to do it themselves. If you want to know more about how you can use Data Studio, check out our Google Data Studio course today! Learn how to get even more out of your reports and dashboards.

Comments