Crazy Egg: that other tool you should be using to understand and optimise your website
Loves Data

We love collecting and analysing data to understand how to optimise our websites, but sometimes we do have to look outside of Google Analytics. Here, we share some of the features and benefits of Crazy Egg, a tool that we use here at Loves Data. We’re all in favour of having a well-stocked armoury and knowing how to use it all, so in this blog we are sharing our favourite features and benefits of Crazy Egg, a popular tool for click-tracking and much more.
What is Crazy Egg?
With a small snippet of code that you can install on some or all pages of your website, Crazy Egg will comprehensively track your visitors’ behaviour and visualise it for you. Which parts of your pages are attracting attention? How much are users scrolling down your longer pages? Exactly which links are being clicked on the most and by which class of users? These are all questions that Crazy Egg will not just collate the data to answer, but will present for you in a set of easily understood visuals.
Here are some of the top features that we love:
Click heatmaps
Which parts of your webpage are hot and which are not? Crazy Egg’s click heatmaps present a static image of the webpage being tracked and overlay a visual graph of all the clicks made by all the users tracked by the software. While you can get an idea of your most clicked links with Google Analytics’ In-Page Analytics feature, the Crazy Egg heatmap shows all clicks tracked by the software, even if not on links.

Are people frequently clicking on something on your page that is just a static element? The click heatmap will tell you, so that you can work out why and improve the page. Have you tried to place the most-clicked items at the top of a list? The heatmap will validate your intentions and help you keep things in optimum order. Are there links or clickable elements that are being ignored? Now you can know, and take action to optimise or test new page designs.
You can even compare get a side-by-side comparison of two different heatmaps. This could be useful for comparing clicks across a ‘control’ and ‘variant’ page that you are running side-by-side in an A/B optimisation test.
Scrollmaps
Do you have vital calls-to-action or marketing materials on parts of your webpages that your users are not even seeing? You know the importance of keeping the important items ‘above the fold’ but where exactly is the fold for your website? With Crazy Egg’s scrollmaps you can see which parts of your pages your users are spending most of their time on, and which parts are getting less attention. Just like the click heatmaps, these are easy-to-read visualisations which will show you at a glance whether your web page lengths are optimised for the browsing habits of your users.

From 100% for white to 0% for deep blue, the scrollmap quickly reveals whether your users are scrolling to the parts of your pages that are important and seeing the content that you want them to see. And, if they are not, you now have the evidence you need to test changes.
Confetti reports
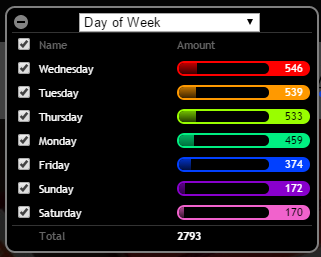
Finally, we want to highlight Crazy Egg’s novel ‘confetti’ reports. These are similar in principle to the standard click heatmaps in that they show where your users are clicking on your tracked web pages. But they go further by breaking down the clicks into different segments of users. The segmentation is not as powerful as in Google Analytics, so it doesn’t quite provide the same scope for highly bespoke subgroup analysis, but there are a number of different types of segment available.

The potential is wide-ranging. For example, of your website targets both business and leisure markets, you might wonder whether the pattern of weekday clicks differs from that of weekend clicks. With Crazy Egg’s confetti reports, you can see whether this is the case and, if so, you could test and deploy a different page design on weekends than on weekdays to capture conversions more optimally.

There are many other segmentation types available, such as new vs returning users, which country they are in, or even which search engine was used to acquire users.
Add Crazy Egg to your toolbox
Using different products to complement your main web analytics tool is great for getting different perspectives on things. After all, the more weapons in your armoury, the better equipped you can be to optimise your website. Crazy Egg is not only a fantastic product for helping identify pain points and areas for improvement in your website, we love the way it visualises everything so neatly too.
We love Crazy Egg so much, we wanted to share the goods. Our friends at Crazy Egg are offering a free 60-day trial, so you can see it in action for yourselves. Check it out and redeem the offer here.

Comments