How to import your advertising cost data into Google Analytics
Loves Data
If you’re running ads on Facebook, LinkedIn, Bing, Twitter, or any other advertising platform for that matter, you should consider bringing that data into your Google Analytics reports.
Why?
Importing this data allows you to compare the performance of your different advertising channels with ease. In a single report you can compare your advertising costs, engagement with your ads and even see if people are converting once they arrive on your website.
Here’s an example of what you’ll find if you’re running campaigns currently (and not importing your cost data)...
You can see that there’s complete information for Google AdWords because it’s easily integrated with Google Analytics. (If you’re running AdWords and haven’t linked your accounts yet, then definitely do this now, it should only take a few of minutes.)
In order to fill in the blanks for these advertising platforms we need to use Cost Data Import. This allows us to push the details about the advertising cost, the number of clicks and impressions into Google Analytics.
To import the data we need to use a ‘key’ so that the cost data is connected to the correct advertising channels within our reports. For this we need to be using appropriate campaign tagged URLs for our inbound advertising.
If you’re already familiar with campaign tags, then you can skip to the next section. If you’re not familiar with campaign tags, they basically allow you to send extra details into Google Analytics when people click through to your website from your own custom marketing initiatives.
You’ll need to define a campaign name, source and medium at a minimum. The campaign name is the overarching name of your marketing. It’s completely custom though, so you might want to use something like ‘Facebook Ads’ or ‘Spring Promotion’ – something that’s easy to understand and is easy for your to identify how those people found your website when you’re inside your reports.
The campaign source is used to understand where the message was seen. For example, you might use facebook.com for ads on Facebook, twitter.com for ads on Twitter and so on. The general rule is to use a domain name when possible.
Then there is campaign medium which should show how the message was communicated. For example, you would use cpc for search ads on Bing and social for paid ads on social networks.
For a more in-depth look at measuring your campaigns, read my post on the best ways to use campaign tagged URLs.
Now that you’re using campaign tags to measure people coming to your website from your advertising, you will need to take note of the source and medium you’re using. These will become the key used to import your cost data.
Here’s an example…
If you’re running ads on Twitter you will have a source of twitter.com and a medium of social this will now be what we use to import our Twitter advertising data against.
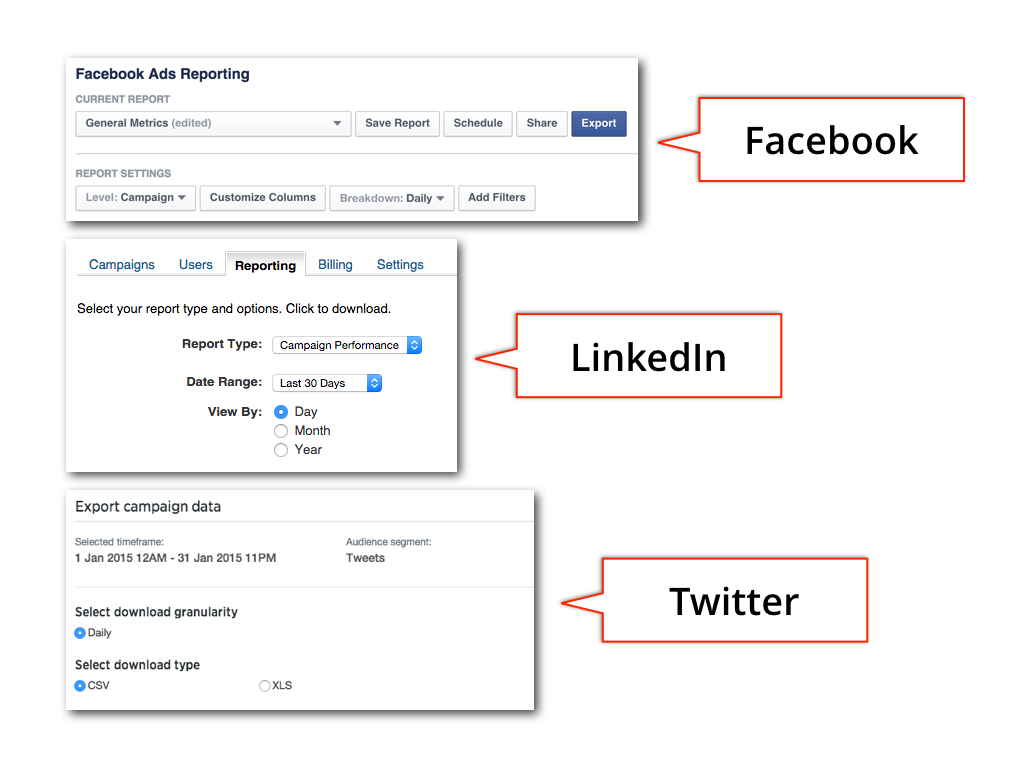
Next, we need to download our data from the advertising platforms. This can take some time if you’re doing it manually. There are solutions out there to automate this process for some platforms, including Facebook and Bing. If you’re interested in this then you might want to check out OWOX BI free and paid versions and Supermetrics Uploader paid version (affiliate link).
When you’re downloading your data manually, you’ll need to ensure you’re downloading your data broken down by day.
Next up, we need to set up Google Analytics, so we actually head into the admin section and select ‘Data Import’ under the Property column. Then click on ‘New Data Set’ and select ‘Cost Data’, name the data you’ll be importing and select the reporting views where you’d like to make the data available.
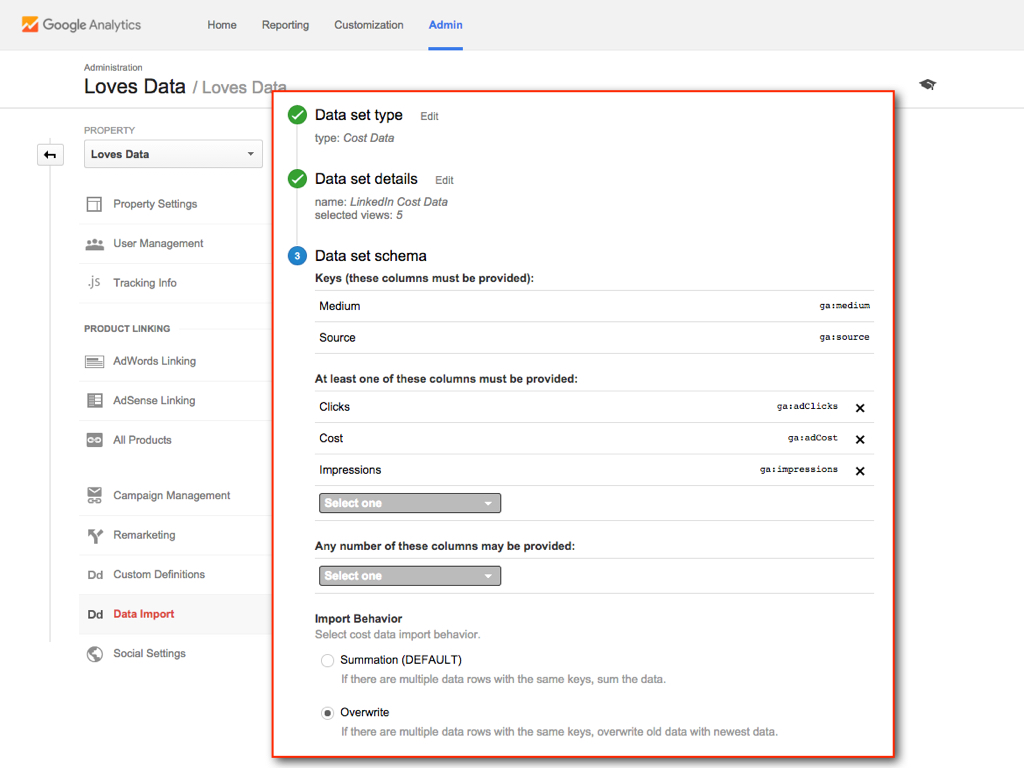
You’ll see that the import keys are pre-set to source and medium. Then you select the data you’ll be importing, you can select from Clicks, Cost and Impressions. I recommend selecting all of these as it won’t take any extra time to get all of this data into Google Analytics.
Now you can download the schema for uploading your data. This is just a fancy way to describe the column headings of the spreadsheet you’ll be importing.
Here’s an example:
Then it’s time to format the data into the spreadsheet, so ensure that you have the date on the left, then medium, source, clicks, cost and impressions.
It’s also super important to use the correct date format for ga:date – you need to use year, then month, then day. So 1 November 2016 would become 20161101 (or yyyyMMdd).
From there, we can upload our data into Google Analytics and we'll now have this cost data, along with session right within Google Analytics.
Now you know how to import your advertising data into Google Analytics, so if someone says “it would be great to see that data inside Google Analytics” you have the answer!
Finally, you can create a custom report to compare all of your advertising efforts right within Google Analytics. Here’s an example:
You can add this custom report to your own Google Analytics reporting view right now!


Comments