Comparing Conversions: Reasons for inaccurate conversion data in Google Analytics
Loves Data
Have you ever noticed that the number of conversions reported in Google Analytics doesn’t match up? In most cases these differences can be explained by attribution. In this post we’ll explore different scenarios to understand what we might see (and not see) in our reports.
Comparing conversions in Google Analytics
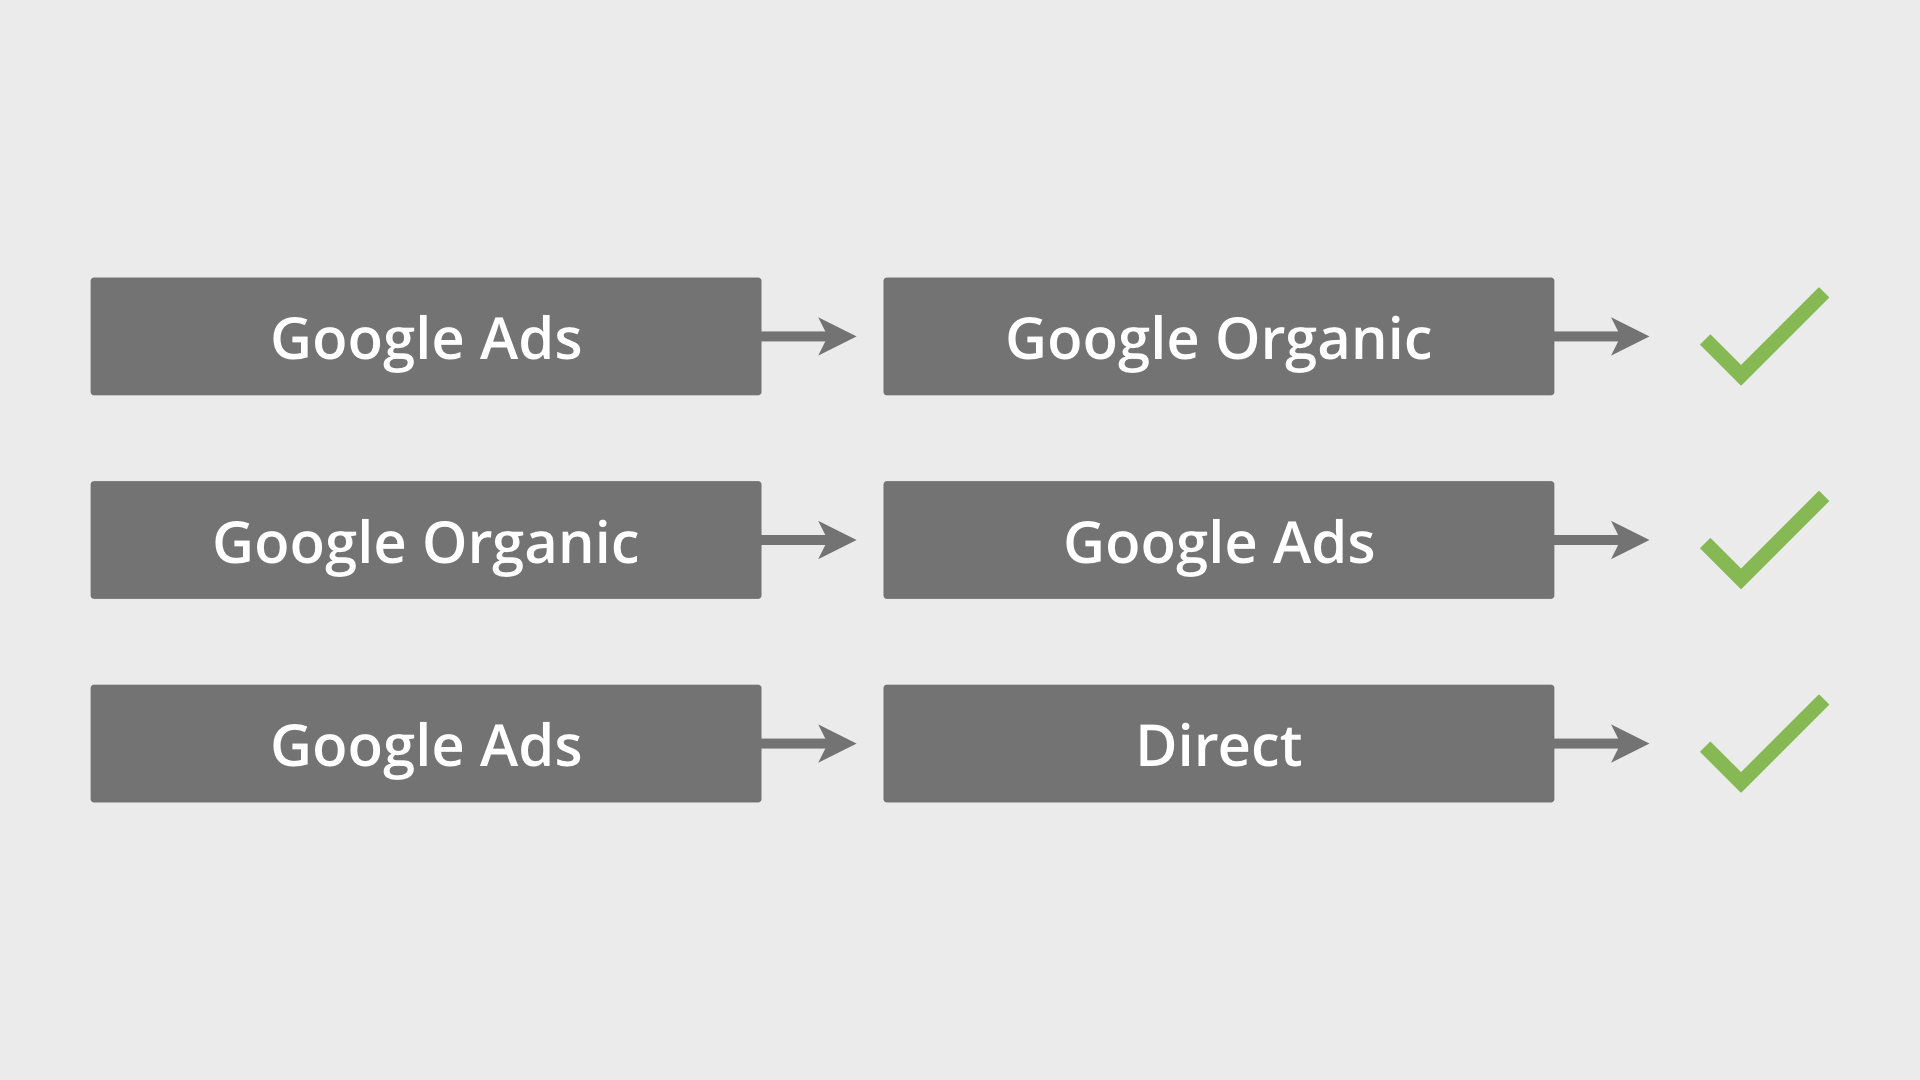
We’re going to start by looking at three different paths that include people clicking through from paid and organic results on Google. In the first path someone has clicked one of our ads to find our website, then they’ve left and come back from an organic search result before converting. In the second path someone found us in the organic search results, returned after clicking an ad and then converted. In the final path someone clicked on an ad, then later came back directly, for example by typing in our URL into their browser, before converting.
Okay, so if we looked at the standard reports, like one of the Acquisitions reports, how many conversions do you think would be attributed to each touchpoint? Let’s take a look…
| Touchpoint | Number of conversions |
|---|---|
| Google Ads | 2 |
| Google Organic | 1 |
| Direct | 0 |
In the standard reports all of the credit for a conversion goes to the last non-direct method someone used to find your website. This means ‘Direct’ is ignored in the final path and the credit goes to our Google Ads instead.
But if we were to head to the Multi-Channel Funnels reports or the Attribution report, then we’d see different figures. Why? Well, these reports will give credit to ‘Direct’ even if it’s the last touchpoint and we would see something like this…
| Touchpoint | Last click conversions |
|---|---|
| Google Ads | 1 |
| Google Organic | 1 |
| Direct | 1 |
And apart from conversions based on the last method of finding our website, we would also see the touchpoints assisting (or leading) to the conversion. So we’d actually see this…
| Touchpoint | Assisted conversions | Last click conversions |
|---|---|---|
| Google Ads | 2 | 1 |
| Google Organic | 1 | 1 |
| Direct | 0 | 1 |
Apart from seeing conversions inside Google Analytics we will also be able to report on conversions inside Google Ads. Assuming that we’re already tracking conversions, we would see this in Google Ads...
| Touchpoint | Number of conversions |
|---|---|
| Google Ads | 3 |
Google Ads will only report on conversions that occur after people click on our ads, so we’re not going to see Google organic, direct, or any other touchpoint reported for our campaigns.
Facebook Conversions in Google Analytics
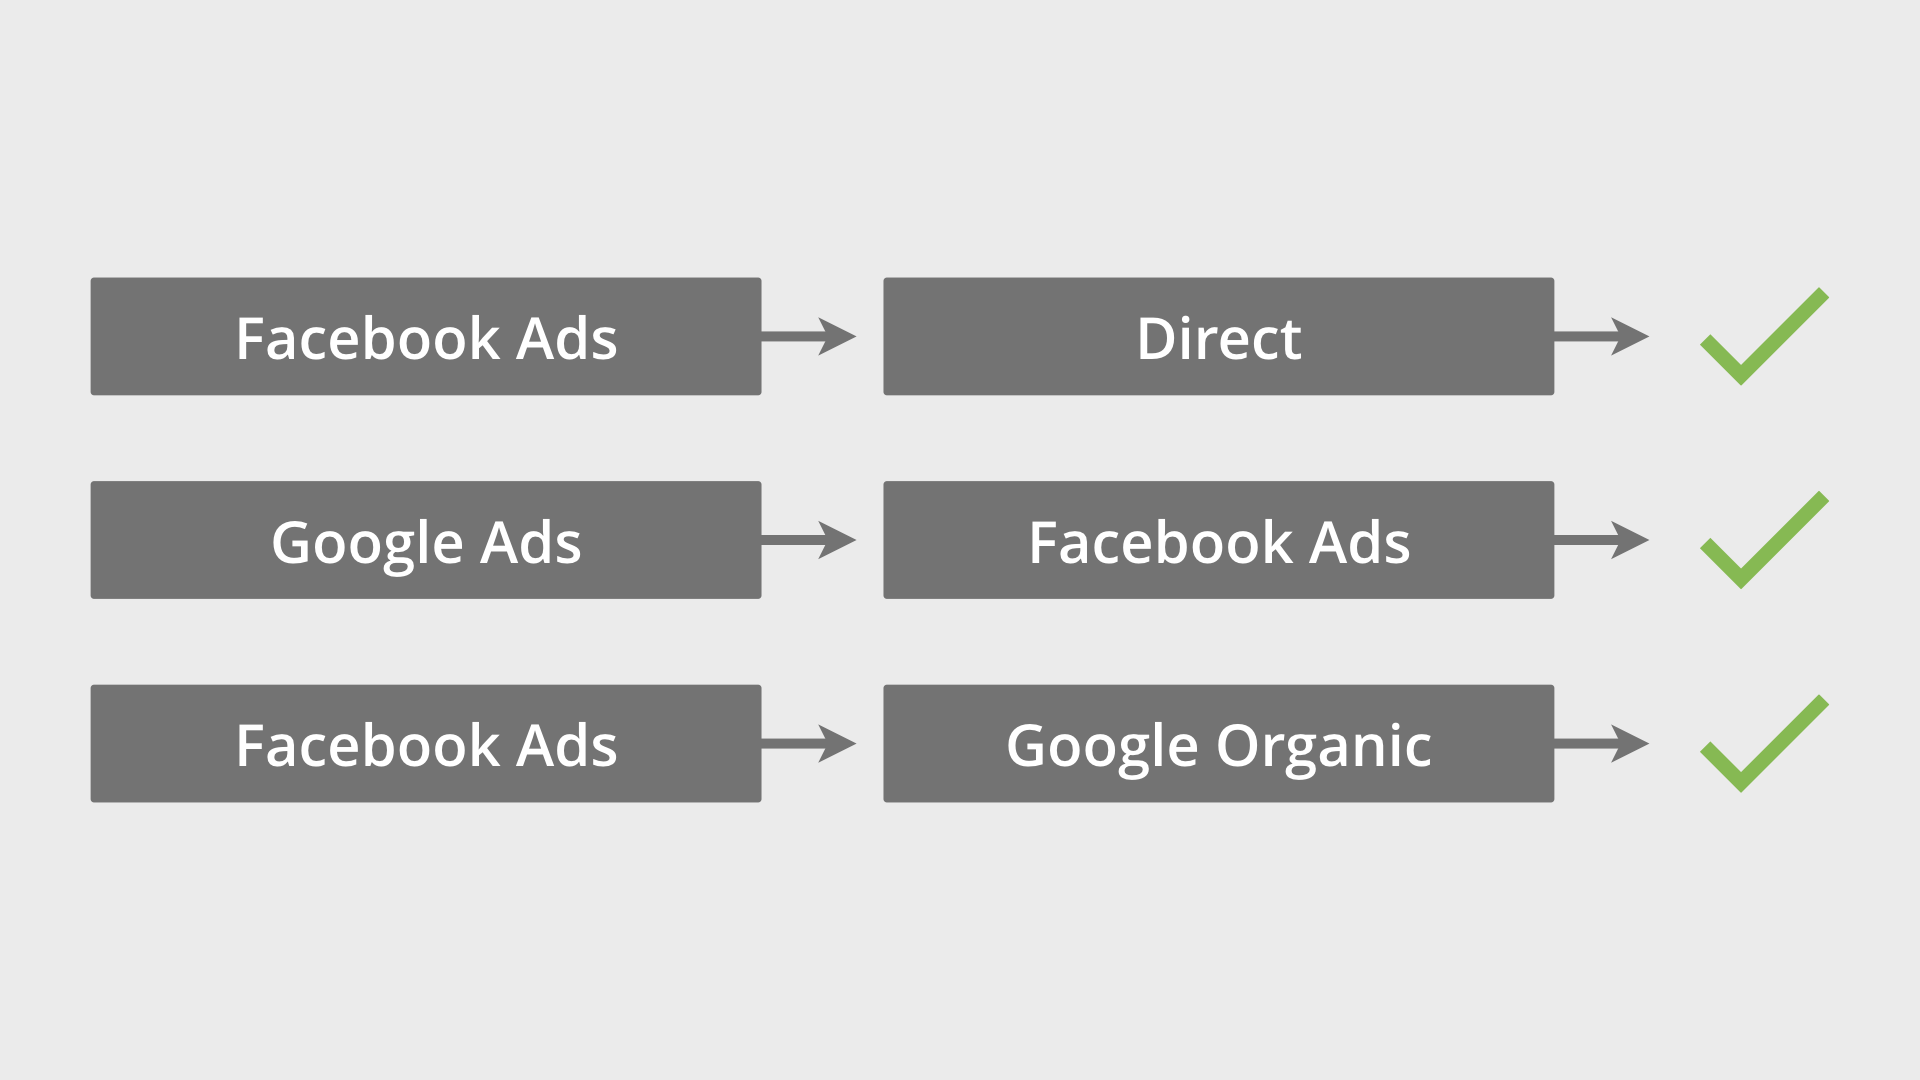
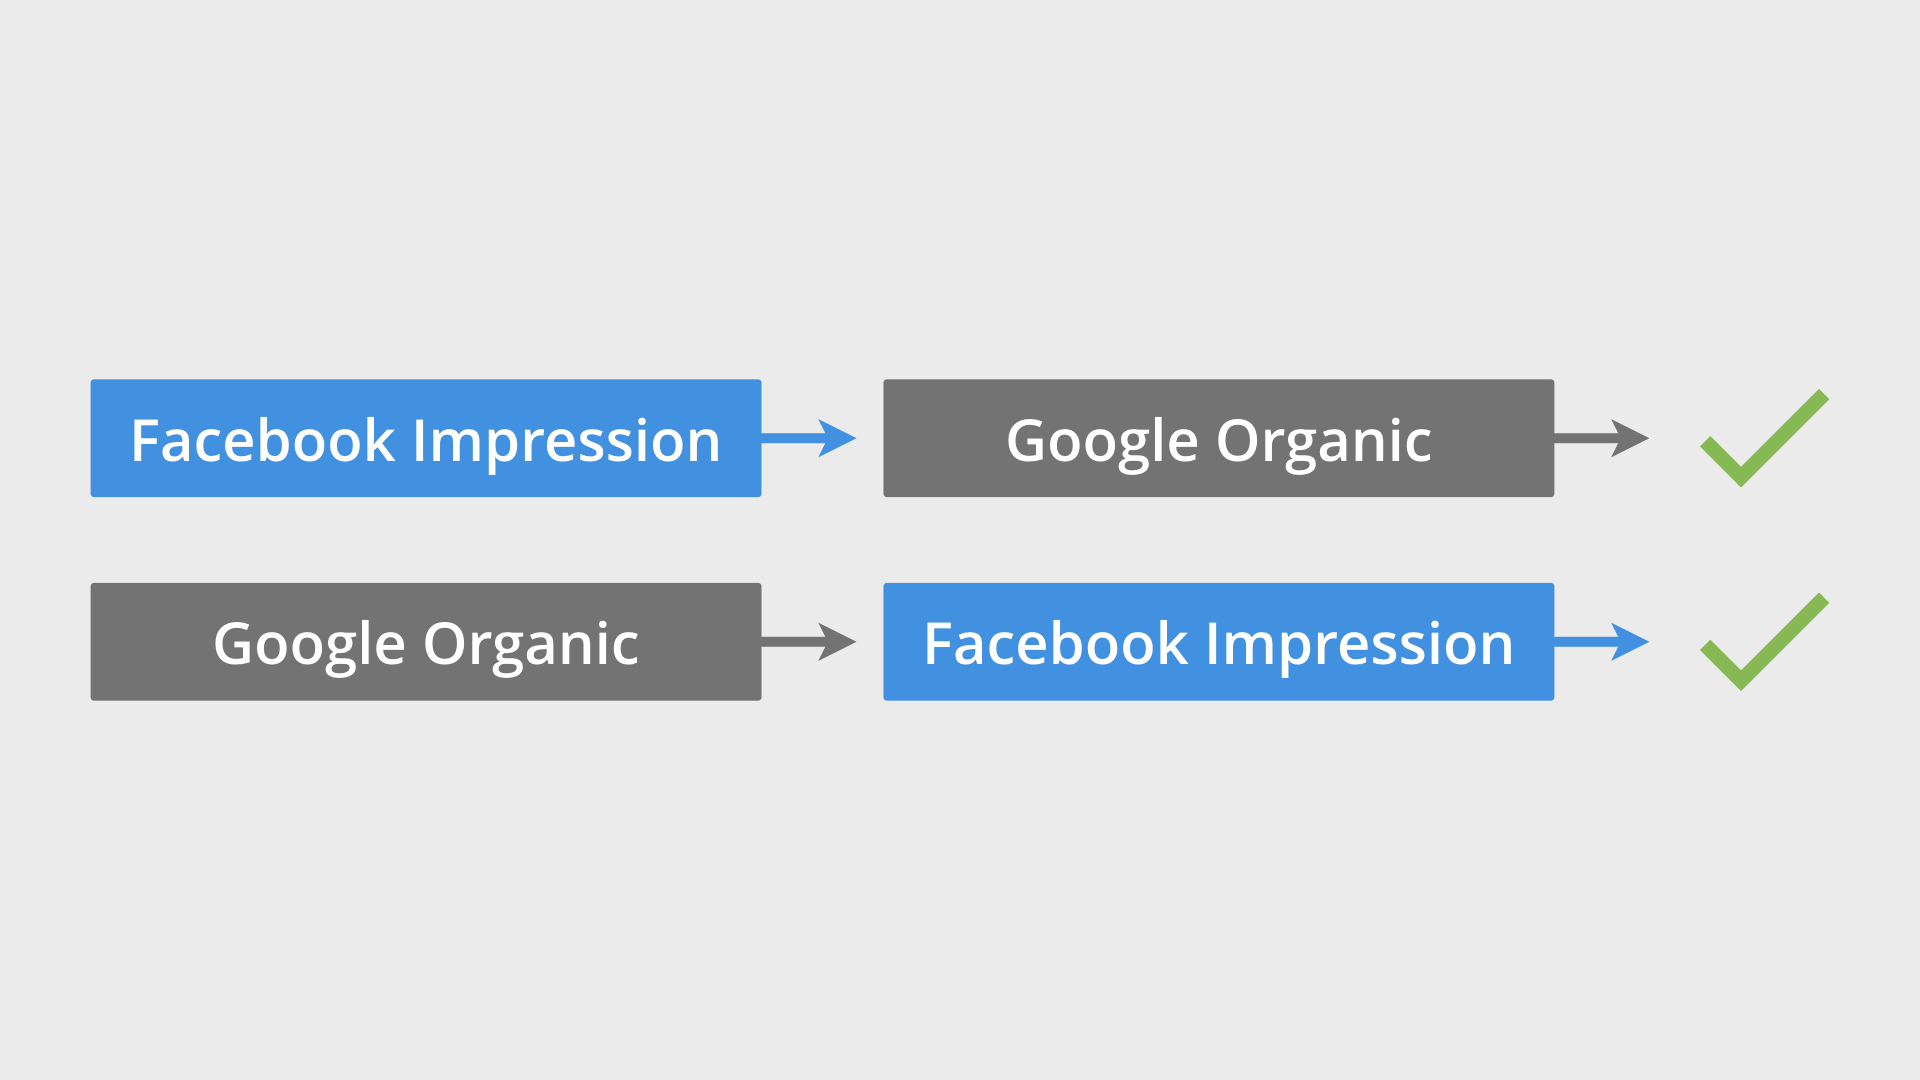
Now let’s look at some paths that include clicks from ads on Facebook. In the first path someone clicks through from Facebook and later comes directly to our website before converting. In the second path someone clicks through from a paid ad on Google, then clicks an ad on Facebook before converting. In the final path someone clicks on a Facebook ad, and later finds our website by clicking an organic search result on Google before converting.
For these paths we would see the following conversions in the standard reports in Google Analytics...
| Touchpoint | Number of conversions |
|---|---|
| Facebook Ads | 2 |
| Google Ads | 0 |
| Google Organic | 1 |
| Direct | 0 |
Again, we’re seeing that the last non-direct method someone used to find the website before converting. These touchpoints receive the full credit for the conversions. However, you might see different numbers reported in Facebook for your ads. For example, you might see a higher number of conversions reported than what you find inside Google Analytics. This can be for a number of reasons, including:
- The Facebook tracking pixel was triggered multiple times, while a goal in Google Analytics will only report one conversion per session.
- The different methodology and techniques used for data collection by each platform. Google Analytics reports on sessions and users which are typically based on browser cookies, while Facebook reports on individuals across devices.
- Google Analytics can use up to 90 days of historical data to understand the path to conversion, while Facebook uses 28 days by default.
- Facebook will count every click on your ad. For example, if someone clicks your ad, then clicks back, then clicks your ad again, you’ll see two clicks in Facebook and one session in Google Analytics.
Viewing Impression Data
Now back to Google Ads – if you’re running display campaigns, then you can include impression data in the Multi-Channel Funnels reports. This allows you to see cases where people view one of your display ads but don’t click through to your website before converting. To see this view-through impression data in Google Analytics, you’ll need to make sure you’ve followed these steps:
- Ensure you’ve linked Google Ads and Google Analytics.
- Check that you have an active display campaign in Google Ads that has received impressions.
- Navigate to ‘Admin’, select ‘Tracking Info’ and then ‘Data Collection’ (under the center column). Then ensure ‘Advertising Reporting Features’ is set to ‘On’.
- Select ‘Google Ads Linking’ and select your Google Ads account. Then select ‘Link Configuration’ and ensure that ‘Google Display Network Impression Reporting’ is enabled.
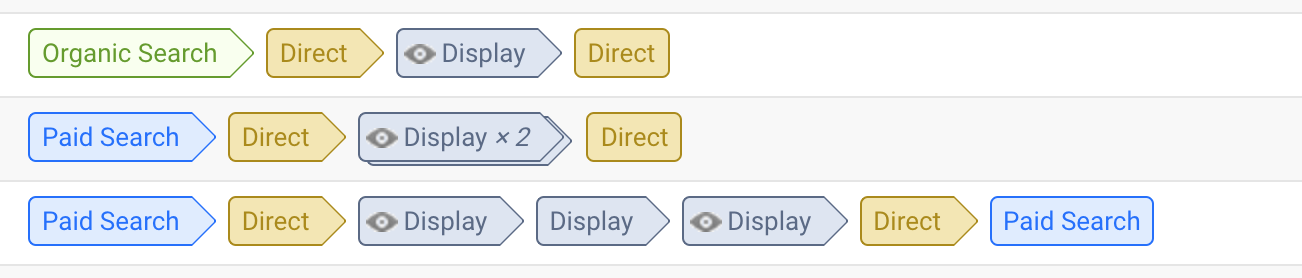
You’ll now be able to see when someone views your display ad (without clicking) and later converts on your website. I recommend using the ‘Top Conversion Paths’ report as you can easily see the different touchpoints, including impressions which are represented by a small eye icon.
It’s important to highlight that view-through conversion data is only available for Google Ads. This means if you’re running ads on Facebook or any other third party platform, you’ll need to use their analytics to understand view-through conversions.
In the following paths to conversion we can see there are impressions for our ads on Facebook, but since people didn’t click through to our website, we won’t be able to report on these impressions.
For these paths we’d see the following reported in Google Analytics…
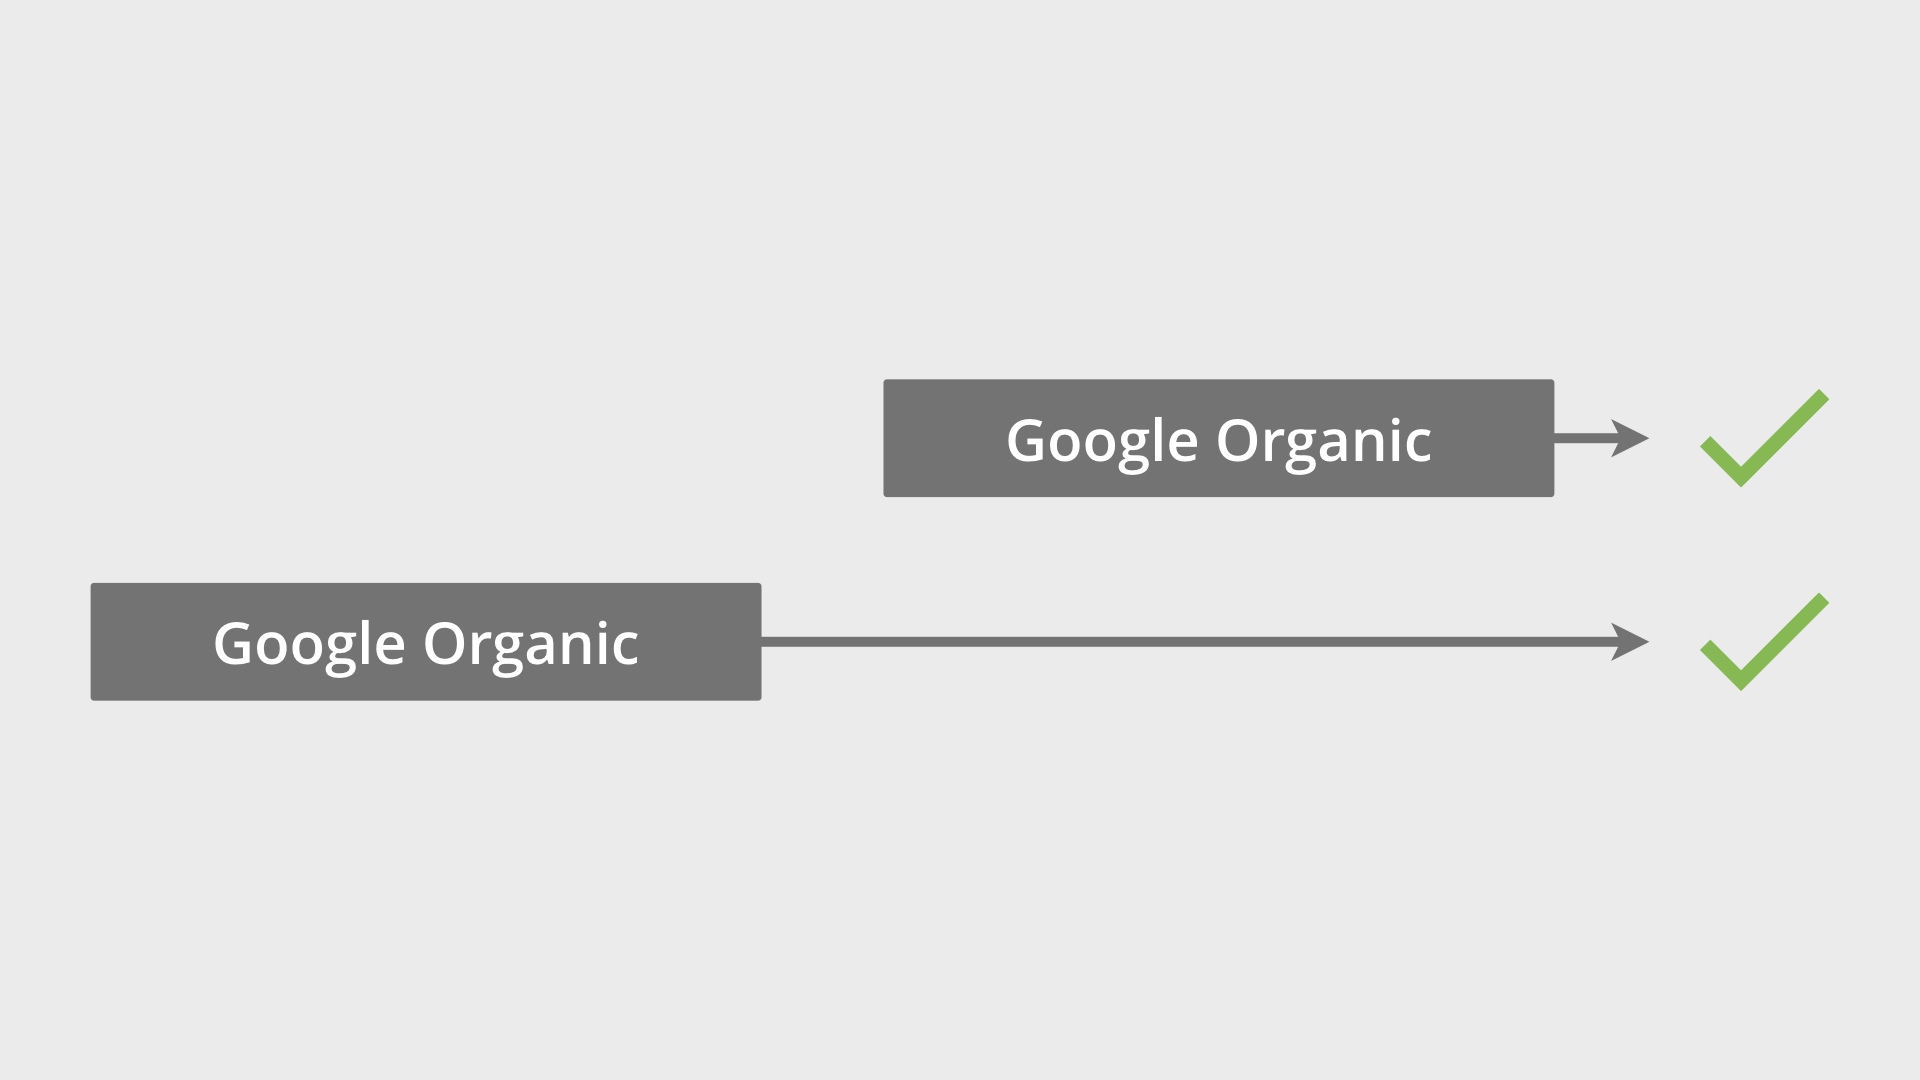
This is why you’ll want to complement the reports you’re using in Google Analytics with data from the other advertising platforms you’re using. This is especially important to do with Facebook since Facebook is also reporting on individuals across the different devices they’re using to view your ads.
Additional Impacts on Conversion Data
In this post, we’ve explored the key reasons why you might see different conversion numbers in Google Analytics. However, I also want to point out there are other impacts you might encounter when it comes to comparing conversions. Here are the top impacts on data accuracy when it comes to conversions:
- Each goal you configure in Google Analytics will count a maximum of one conversion per session.
- Goals need to be correctly configured (or ecommerce tracking implemented) for conversions to be reported. If the configuration isn’t correct, then conversion data won’t be accurate.
- Campaign tags need to be used for all inbound marketing, including ads on Facebook that direct people through to your website.
- Google Analytics has a default ‘lookback window’ of 30 days, but this can be changed from 1 to 90 days. This window lets you control how much historical data to include in the paths to conversion. Other platforms, like Facebook, can use a different lookback window which can make it harder to compare data.
- Google Ads, Facebook, and other platforms typically report conversions when the last click occurred, while Google Analytics reports on when the actual conversion took place.
Conclusion
Remember that depending on the report you’re using in Google Analytics you might see different conversion numbers – that the total number of conversions for each marketing channel will be different in the standard reports compared to the Multi-Channel Funnels reports. And don’t forget that if you’re running campaigns across different platforms, like Google Ads and Facebook, you’ll want to use a combination of data sources to understand performance


Comments