GA4 Bounce Rate: How it's calculated and where to find it
Loves Data
If you’re using Google Analytics 4 (GA4), you might have noticed that bounce rate isn’t included in the standard reports by default. But there's good news – bounce rate can be added to most of your reports in GA4.
Once you've added the bounce rate metric to your reports, you can quickly identify which landing pages are keeping people on your website and which ones don't.
In this guide, you’ll learn what GA4 bounce rate is, how it’s calculated, how to find it, and how to use it alongside other key metrics to improve your website’s performance.
What is Bounce Rate?
Traditionally, bounce rate was the percentage of sessions where people view a single page and leave without engaging further. For example, if two people visited your website and viewed a single page each, and two people viewed two pages each, you would have a bounce rate of 50% – half of the sessions contained a single page view.
2 Single Page Sessions / 4 Total Sessions = 50% Bounce Rate
So bounce rate was developed to help you understand if people engage beyond a single page on your website.
How is Bounce Rate Calculated in GA4?
In GA4, bounce rate is the percentage of sessions that are not considered engaged. This means someone visited your website and didn’t meet any of the engagement criteria. A session is considered engaged if:
- It lasts 10 seconds or longer
- It includes two or more page views
- It includes at least one key event which track conversions
So if someone lands on your page, stays for a few seconds, and leaves without clicking anything – that’s counted as a bounce.
GA4 Bounce Rate Formula
To calculate bounce rate in GA4, you divide the number of non-engaged sessions by the total number of sessions. Here's the formula:
Bounce Rate = (Non-Engaged Sessions ÷ Total Sessions) × 100
For example, if you had ten sessions and three of them were not engaged, the GA4 bounce rate would be 30%.
How to Find Bounce Rate in GA4
Bounce rate is not shown by default in GA4’s standard reports, but you can add it manually. Here’s how:
- Make sure you have editor or administrator access to the property.
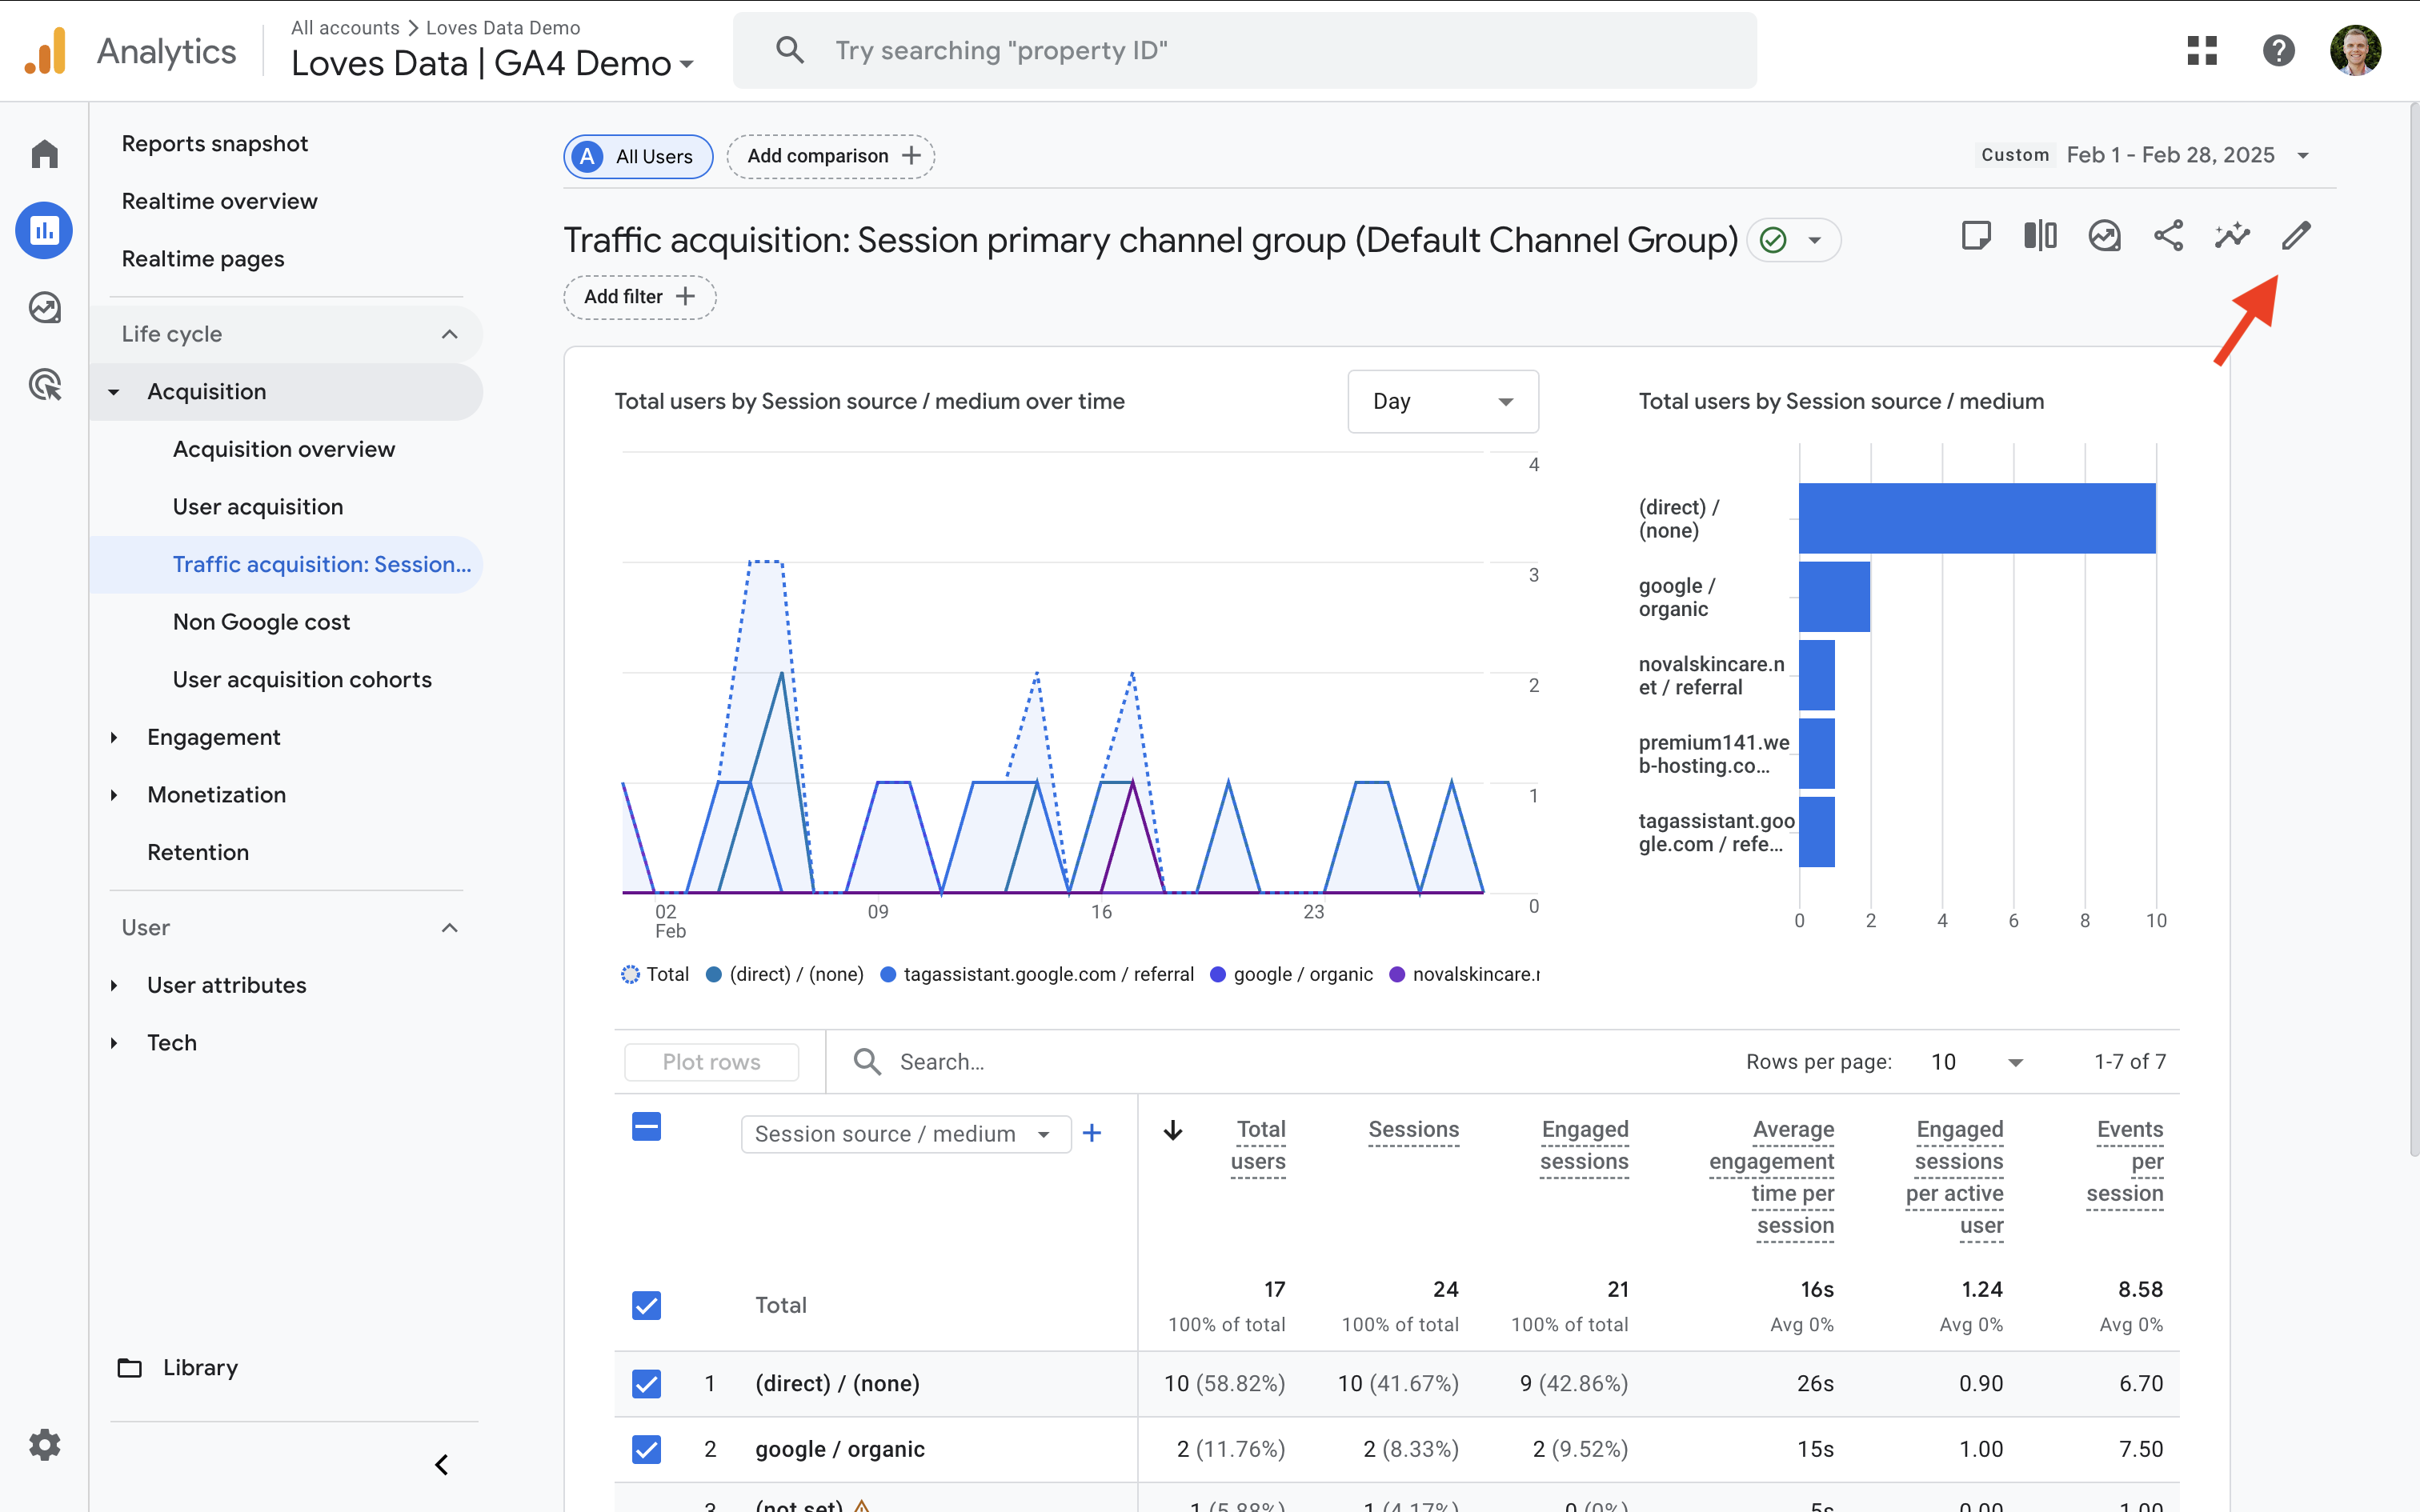
- Open the report you want to update.
- Click the pencil icon in the top right to edit the report.
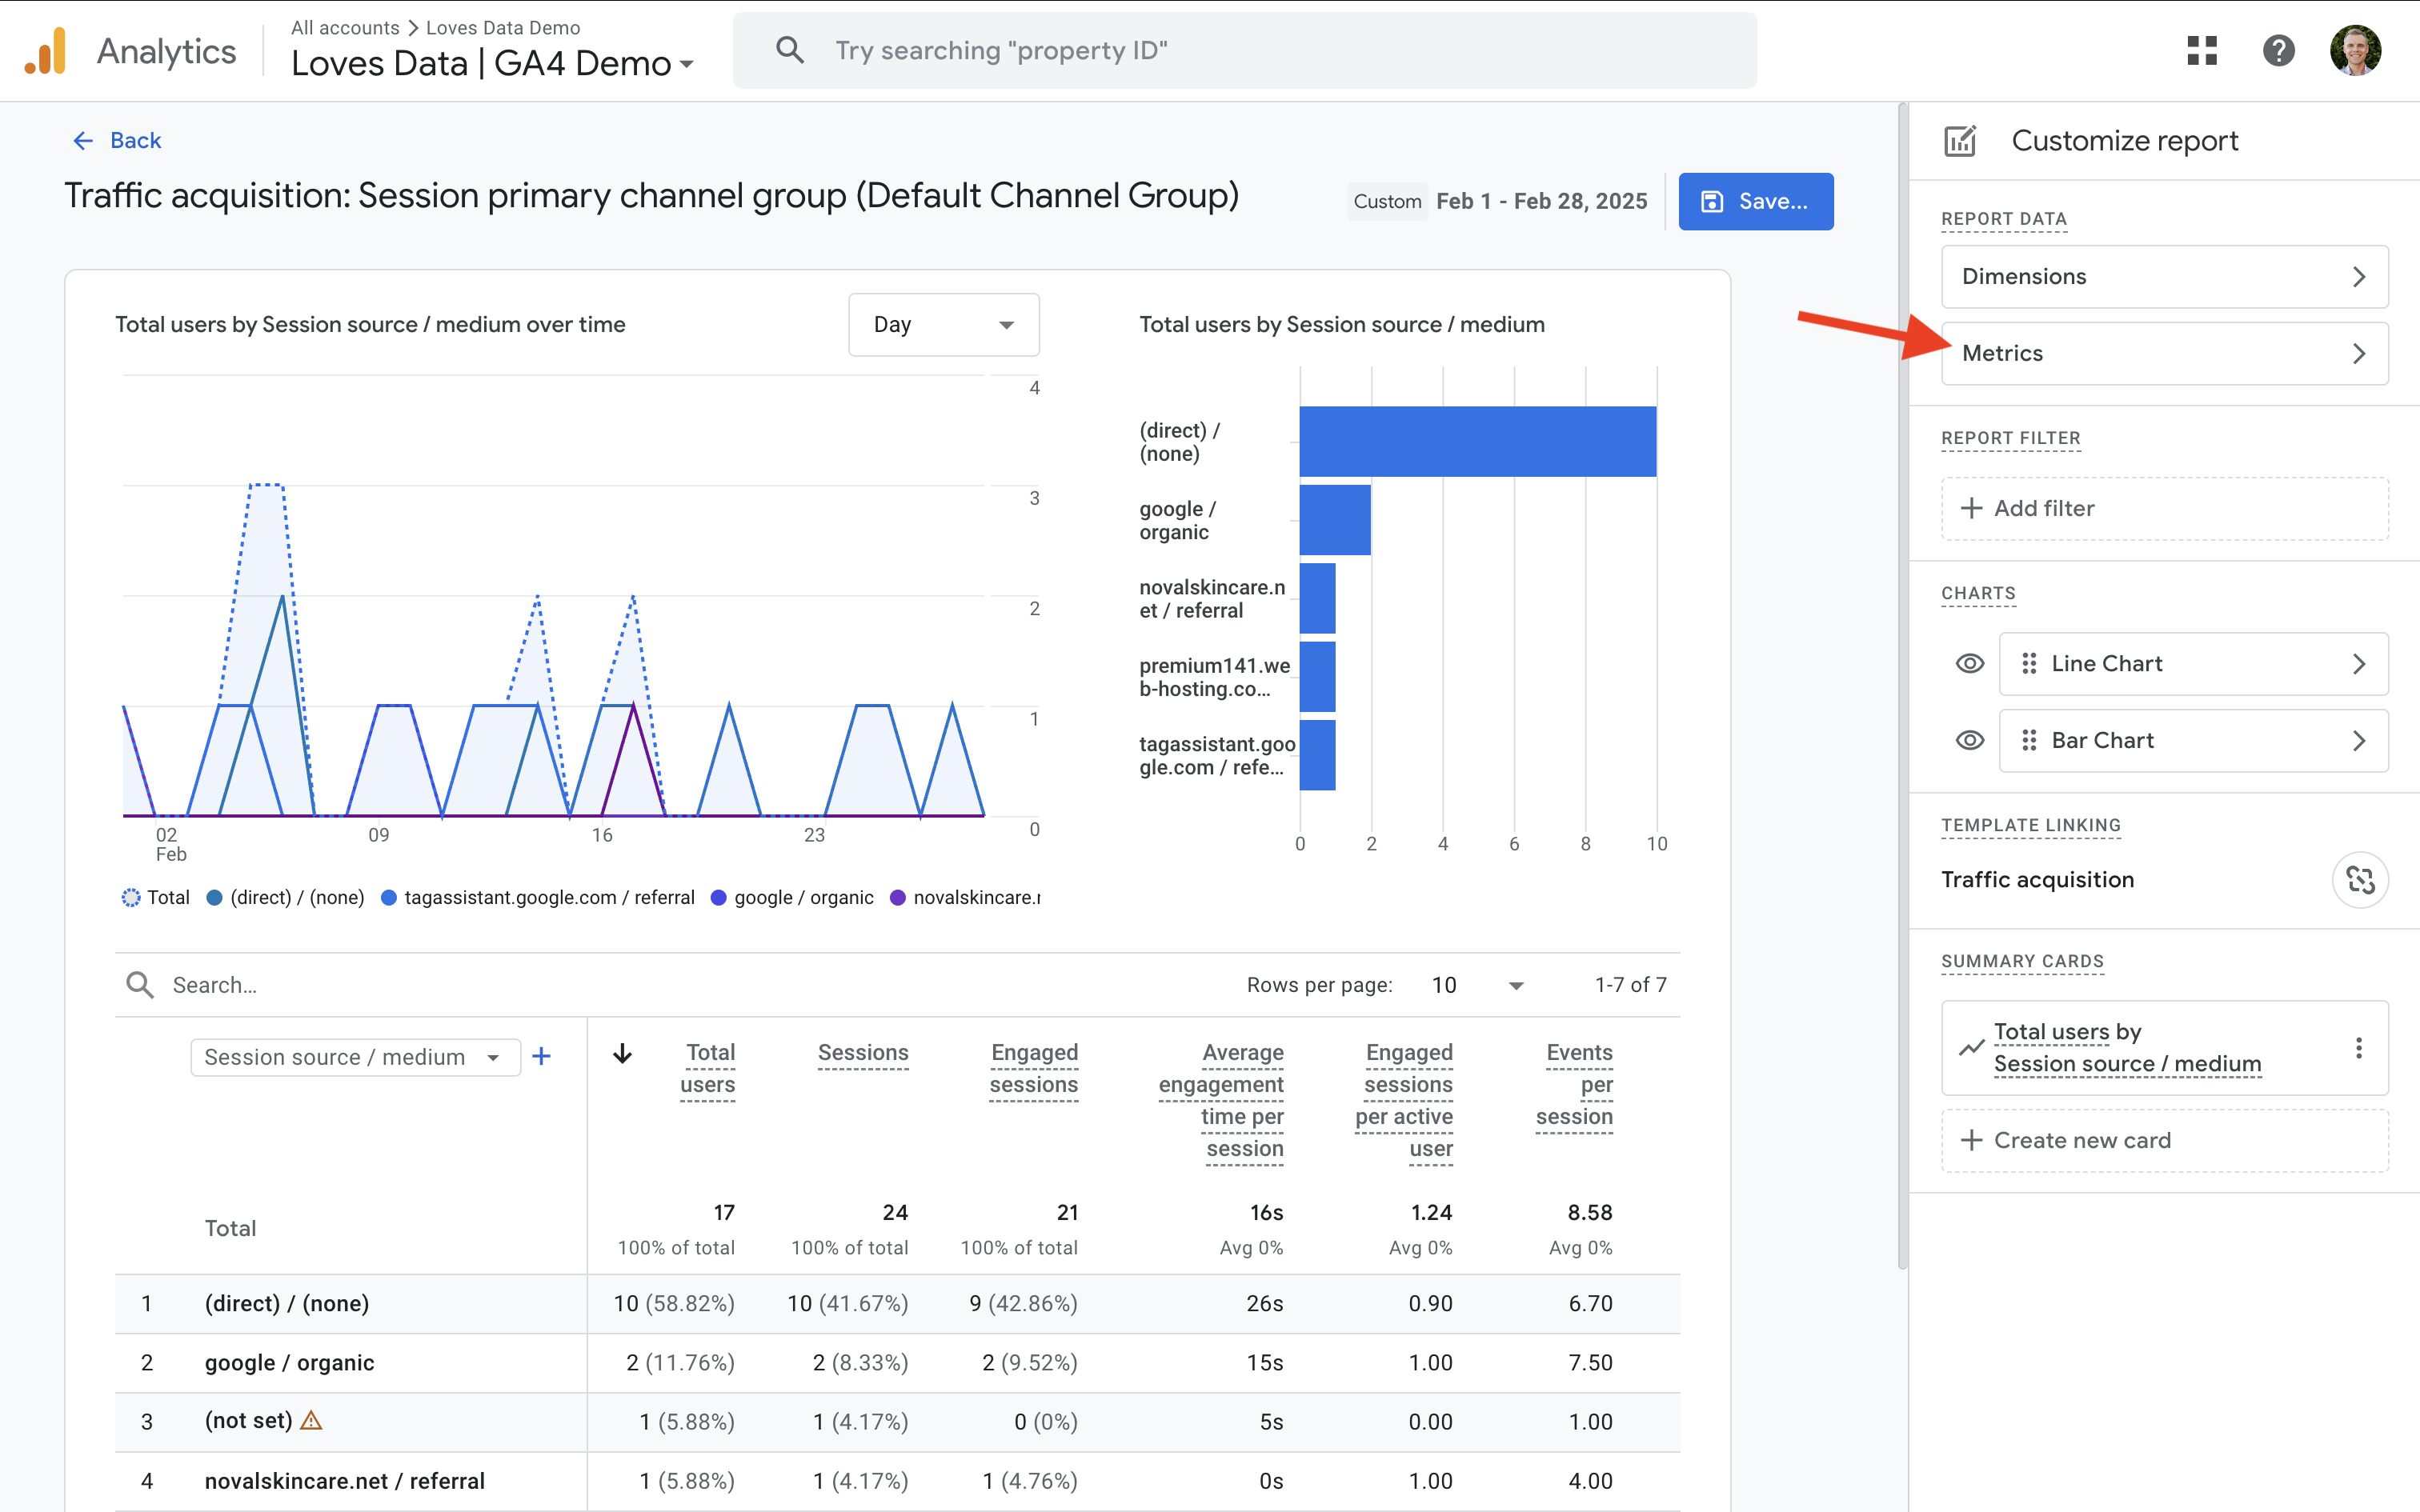
- Click 'Metrics' on the right, then click 'Add Metric'.
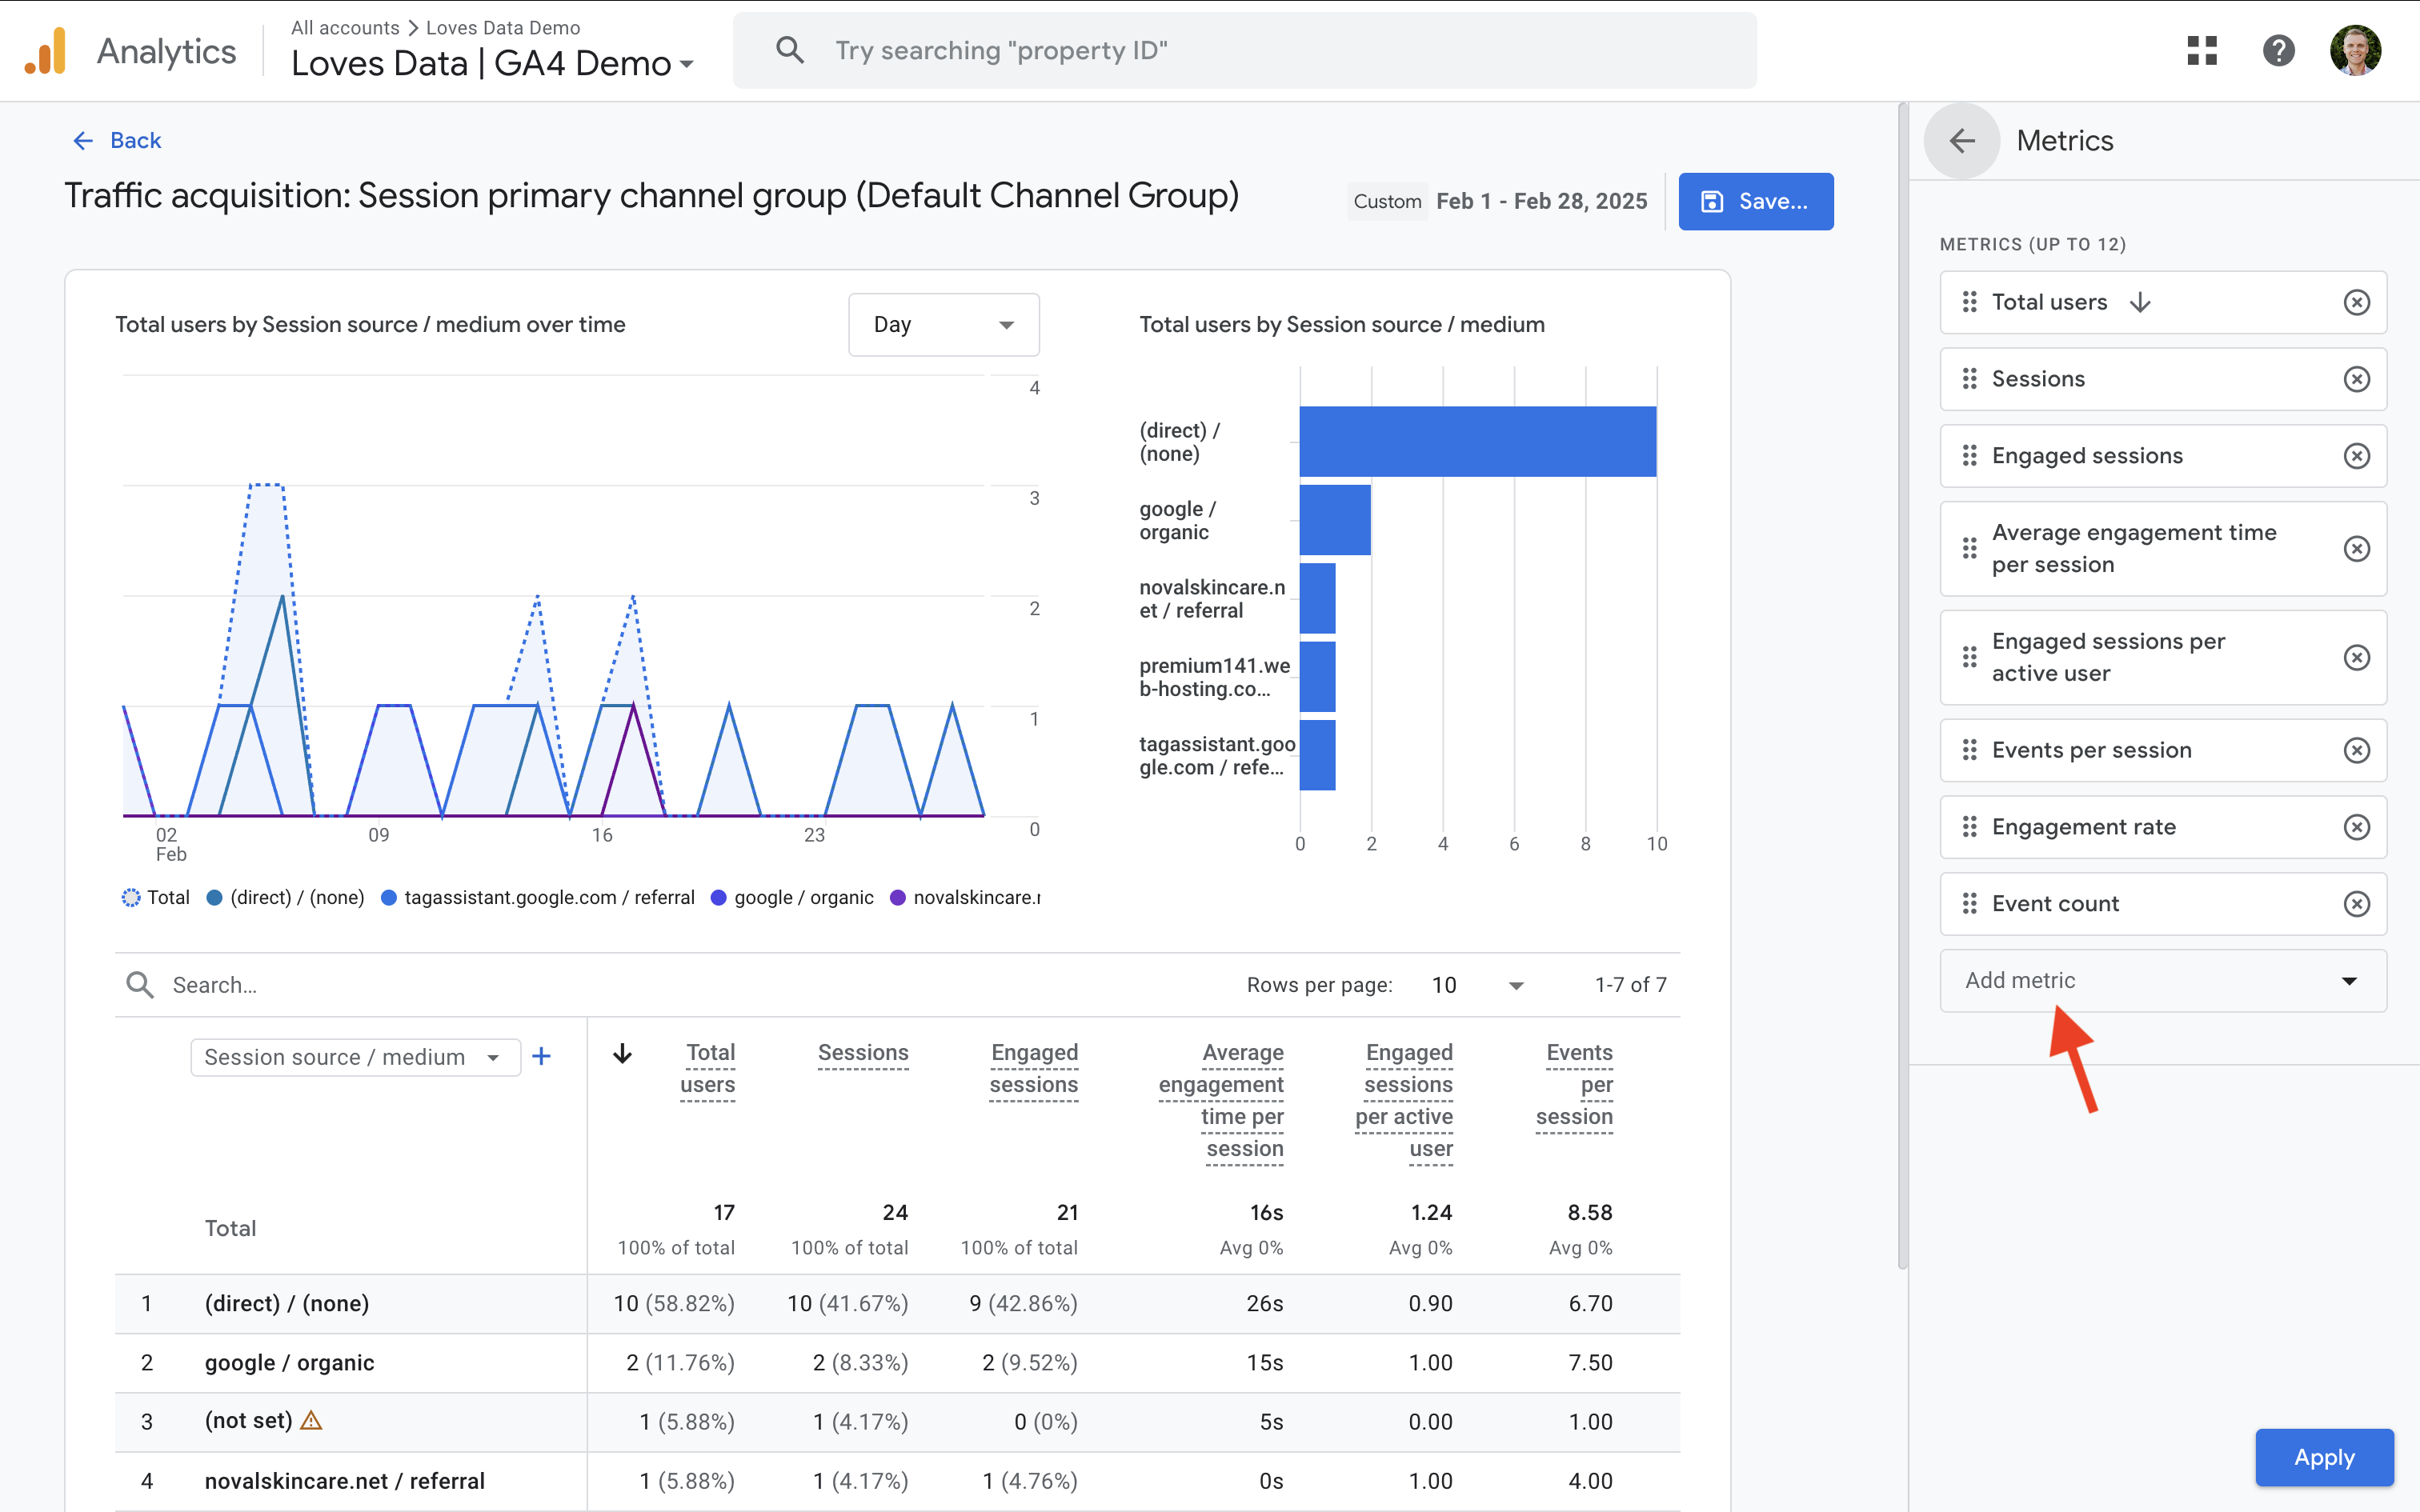
- Search for and select 'Bounce Rate', then click 'Apply'.
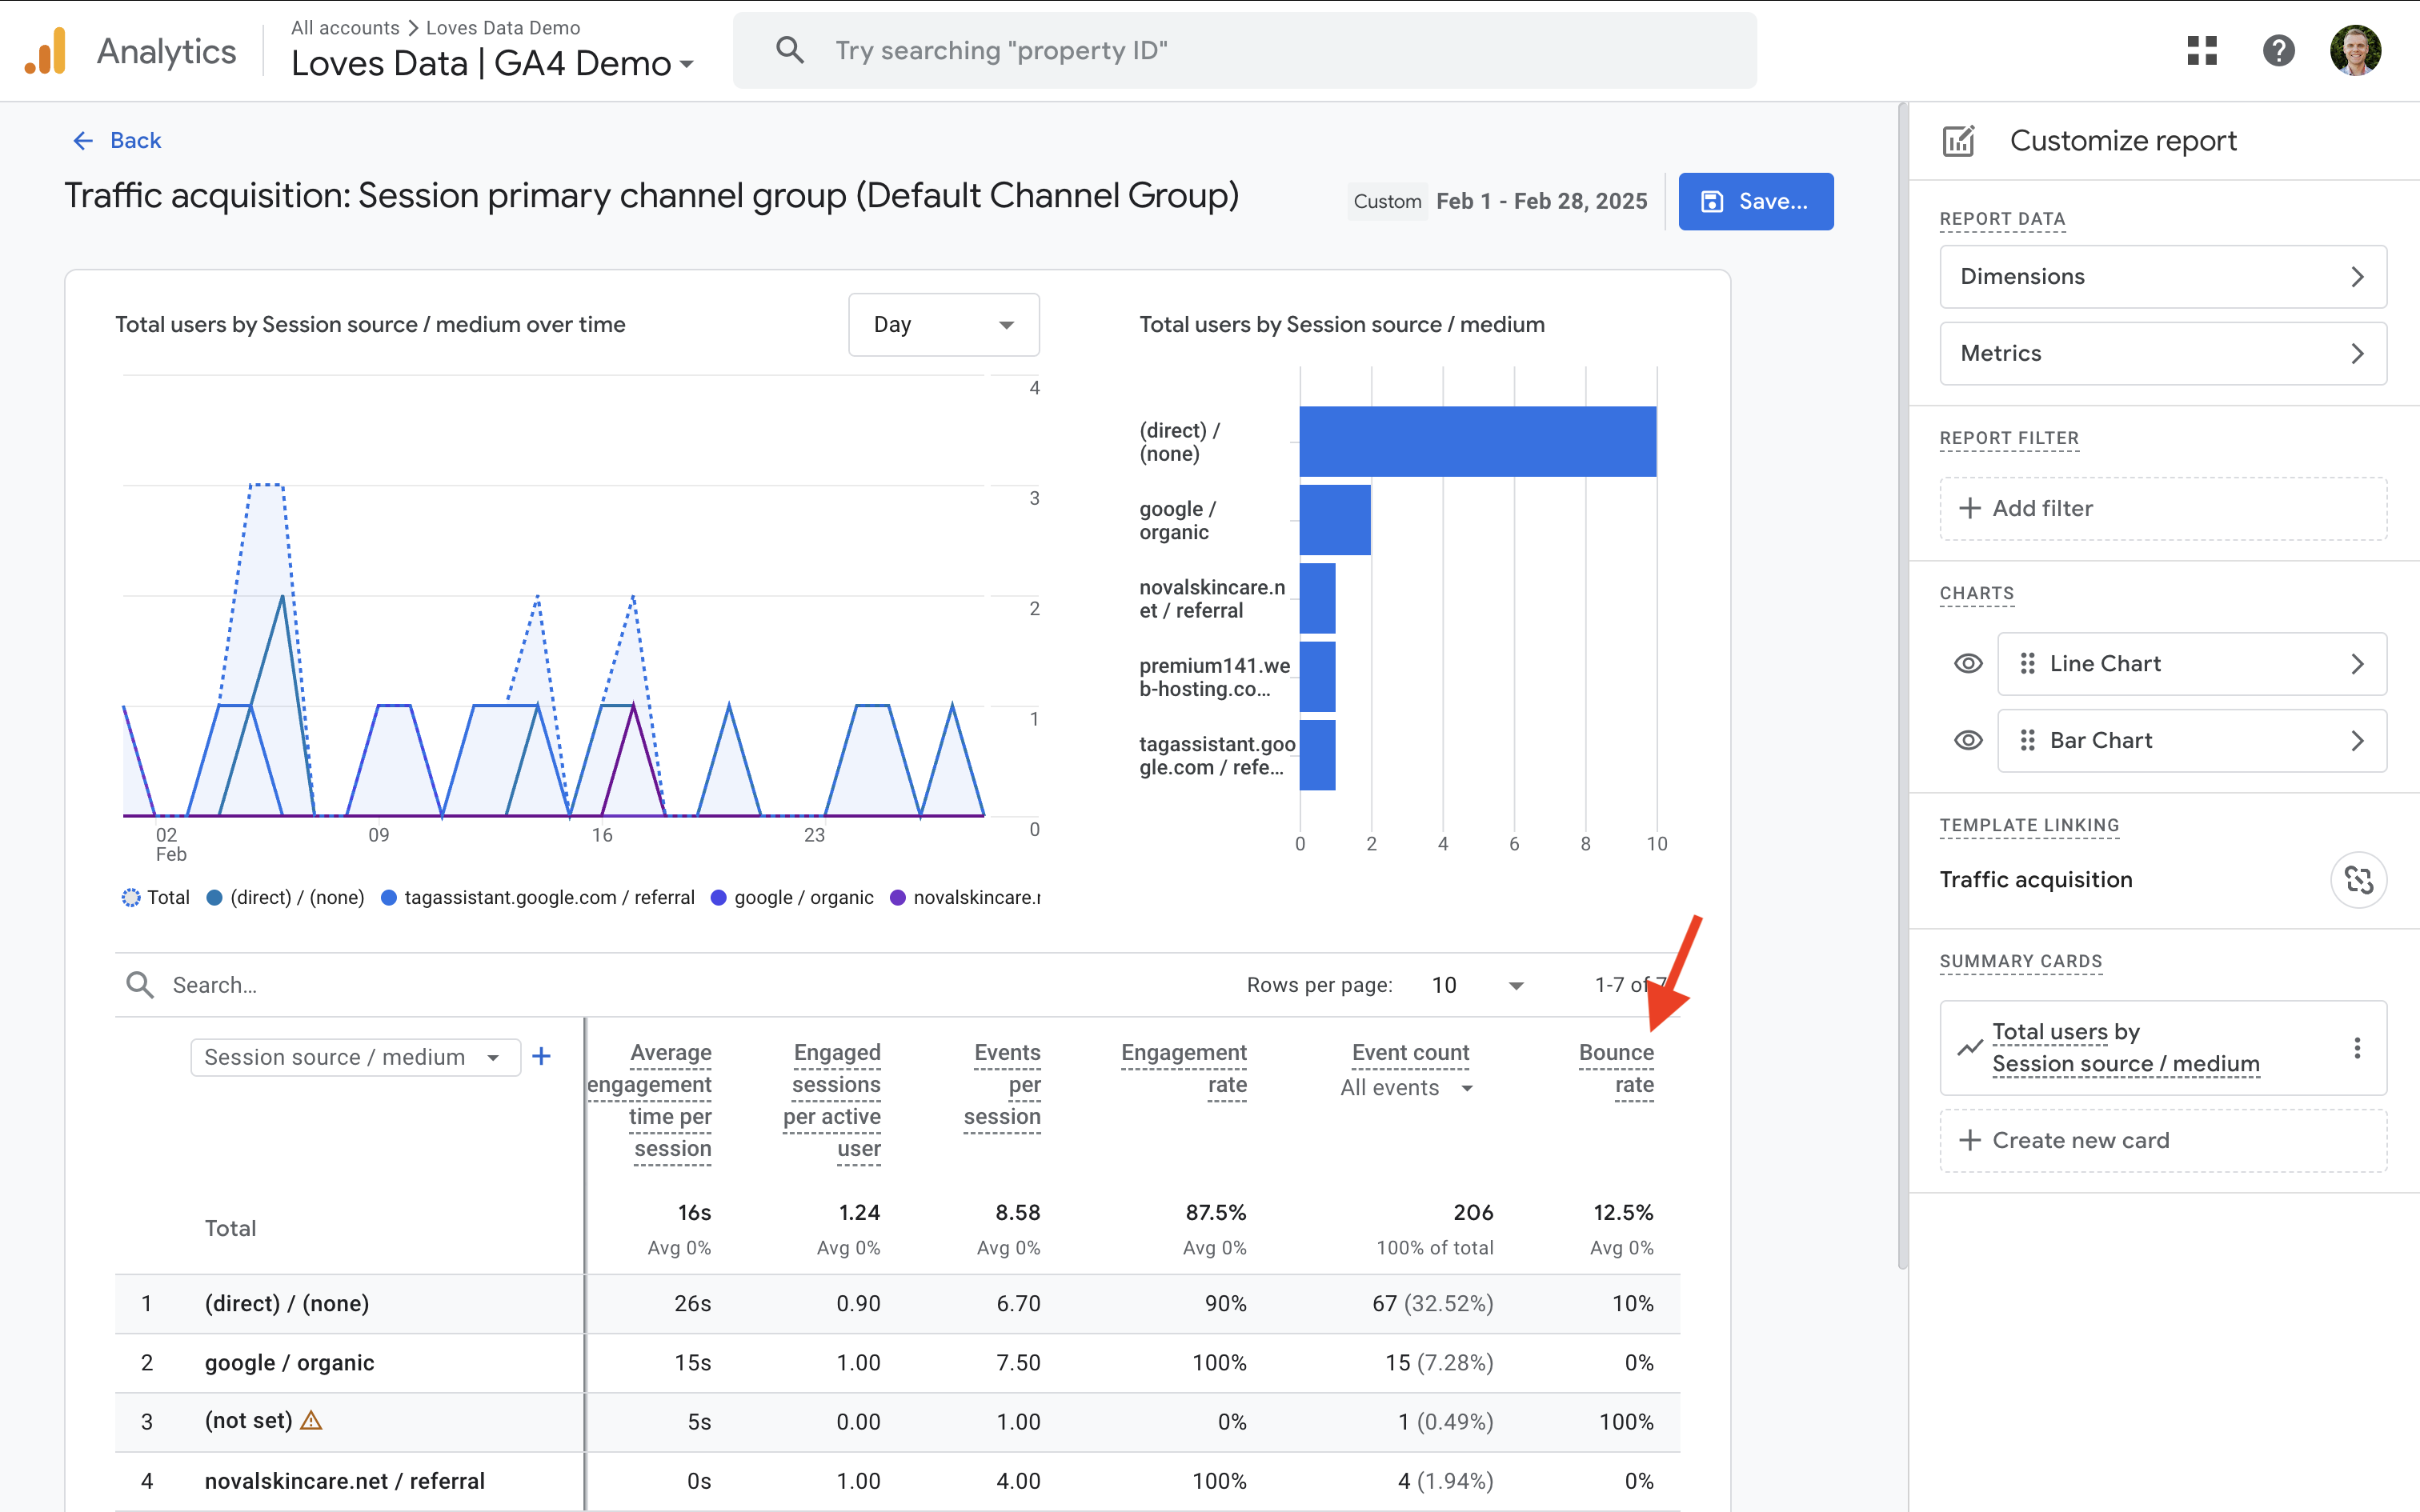
- Click 'Save' and save the change to the current report or create a new one.
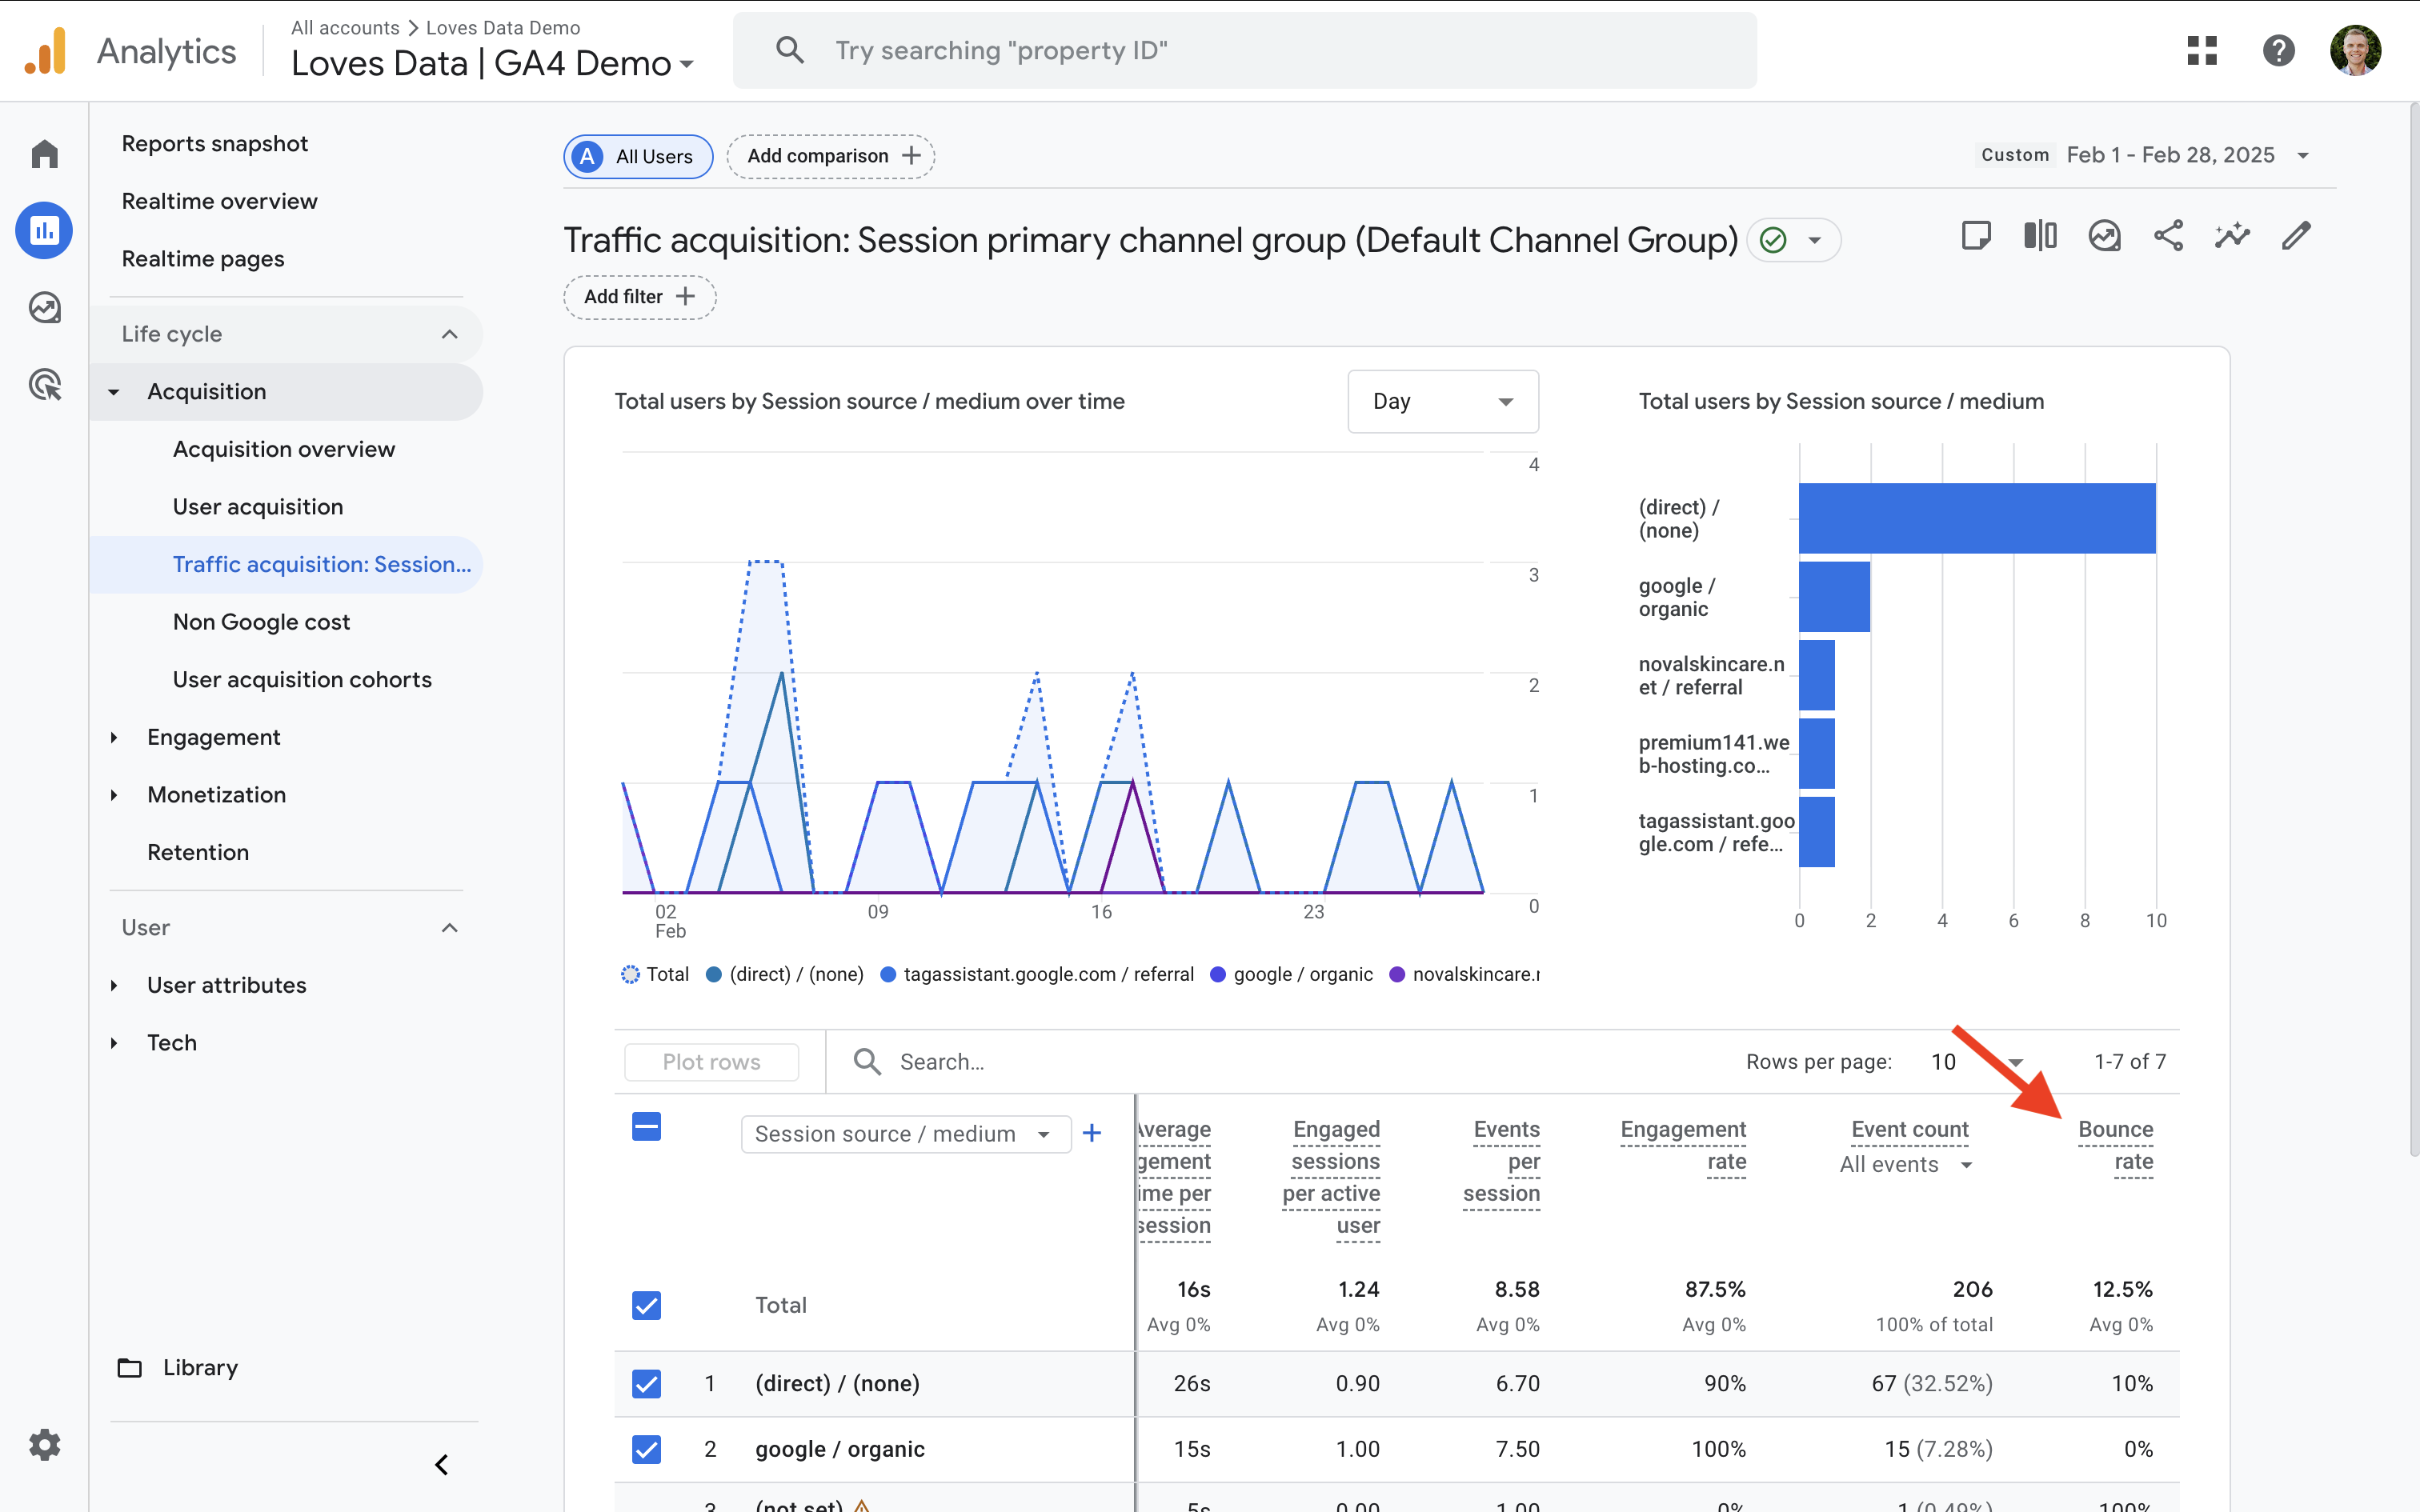
That’s it – your report will now include bounce rate.
Want help with the steps? Watch this bounce rate tutorial:
If you would prefer to build a custom report or if you don't have permission to edit the standard reports, you can also add bounce rate to an Exploration report. Here are the steps:
- Navigate to 'Explore' using the main menu.
- Click 'Blank' to create a new report.
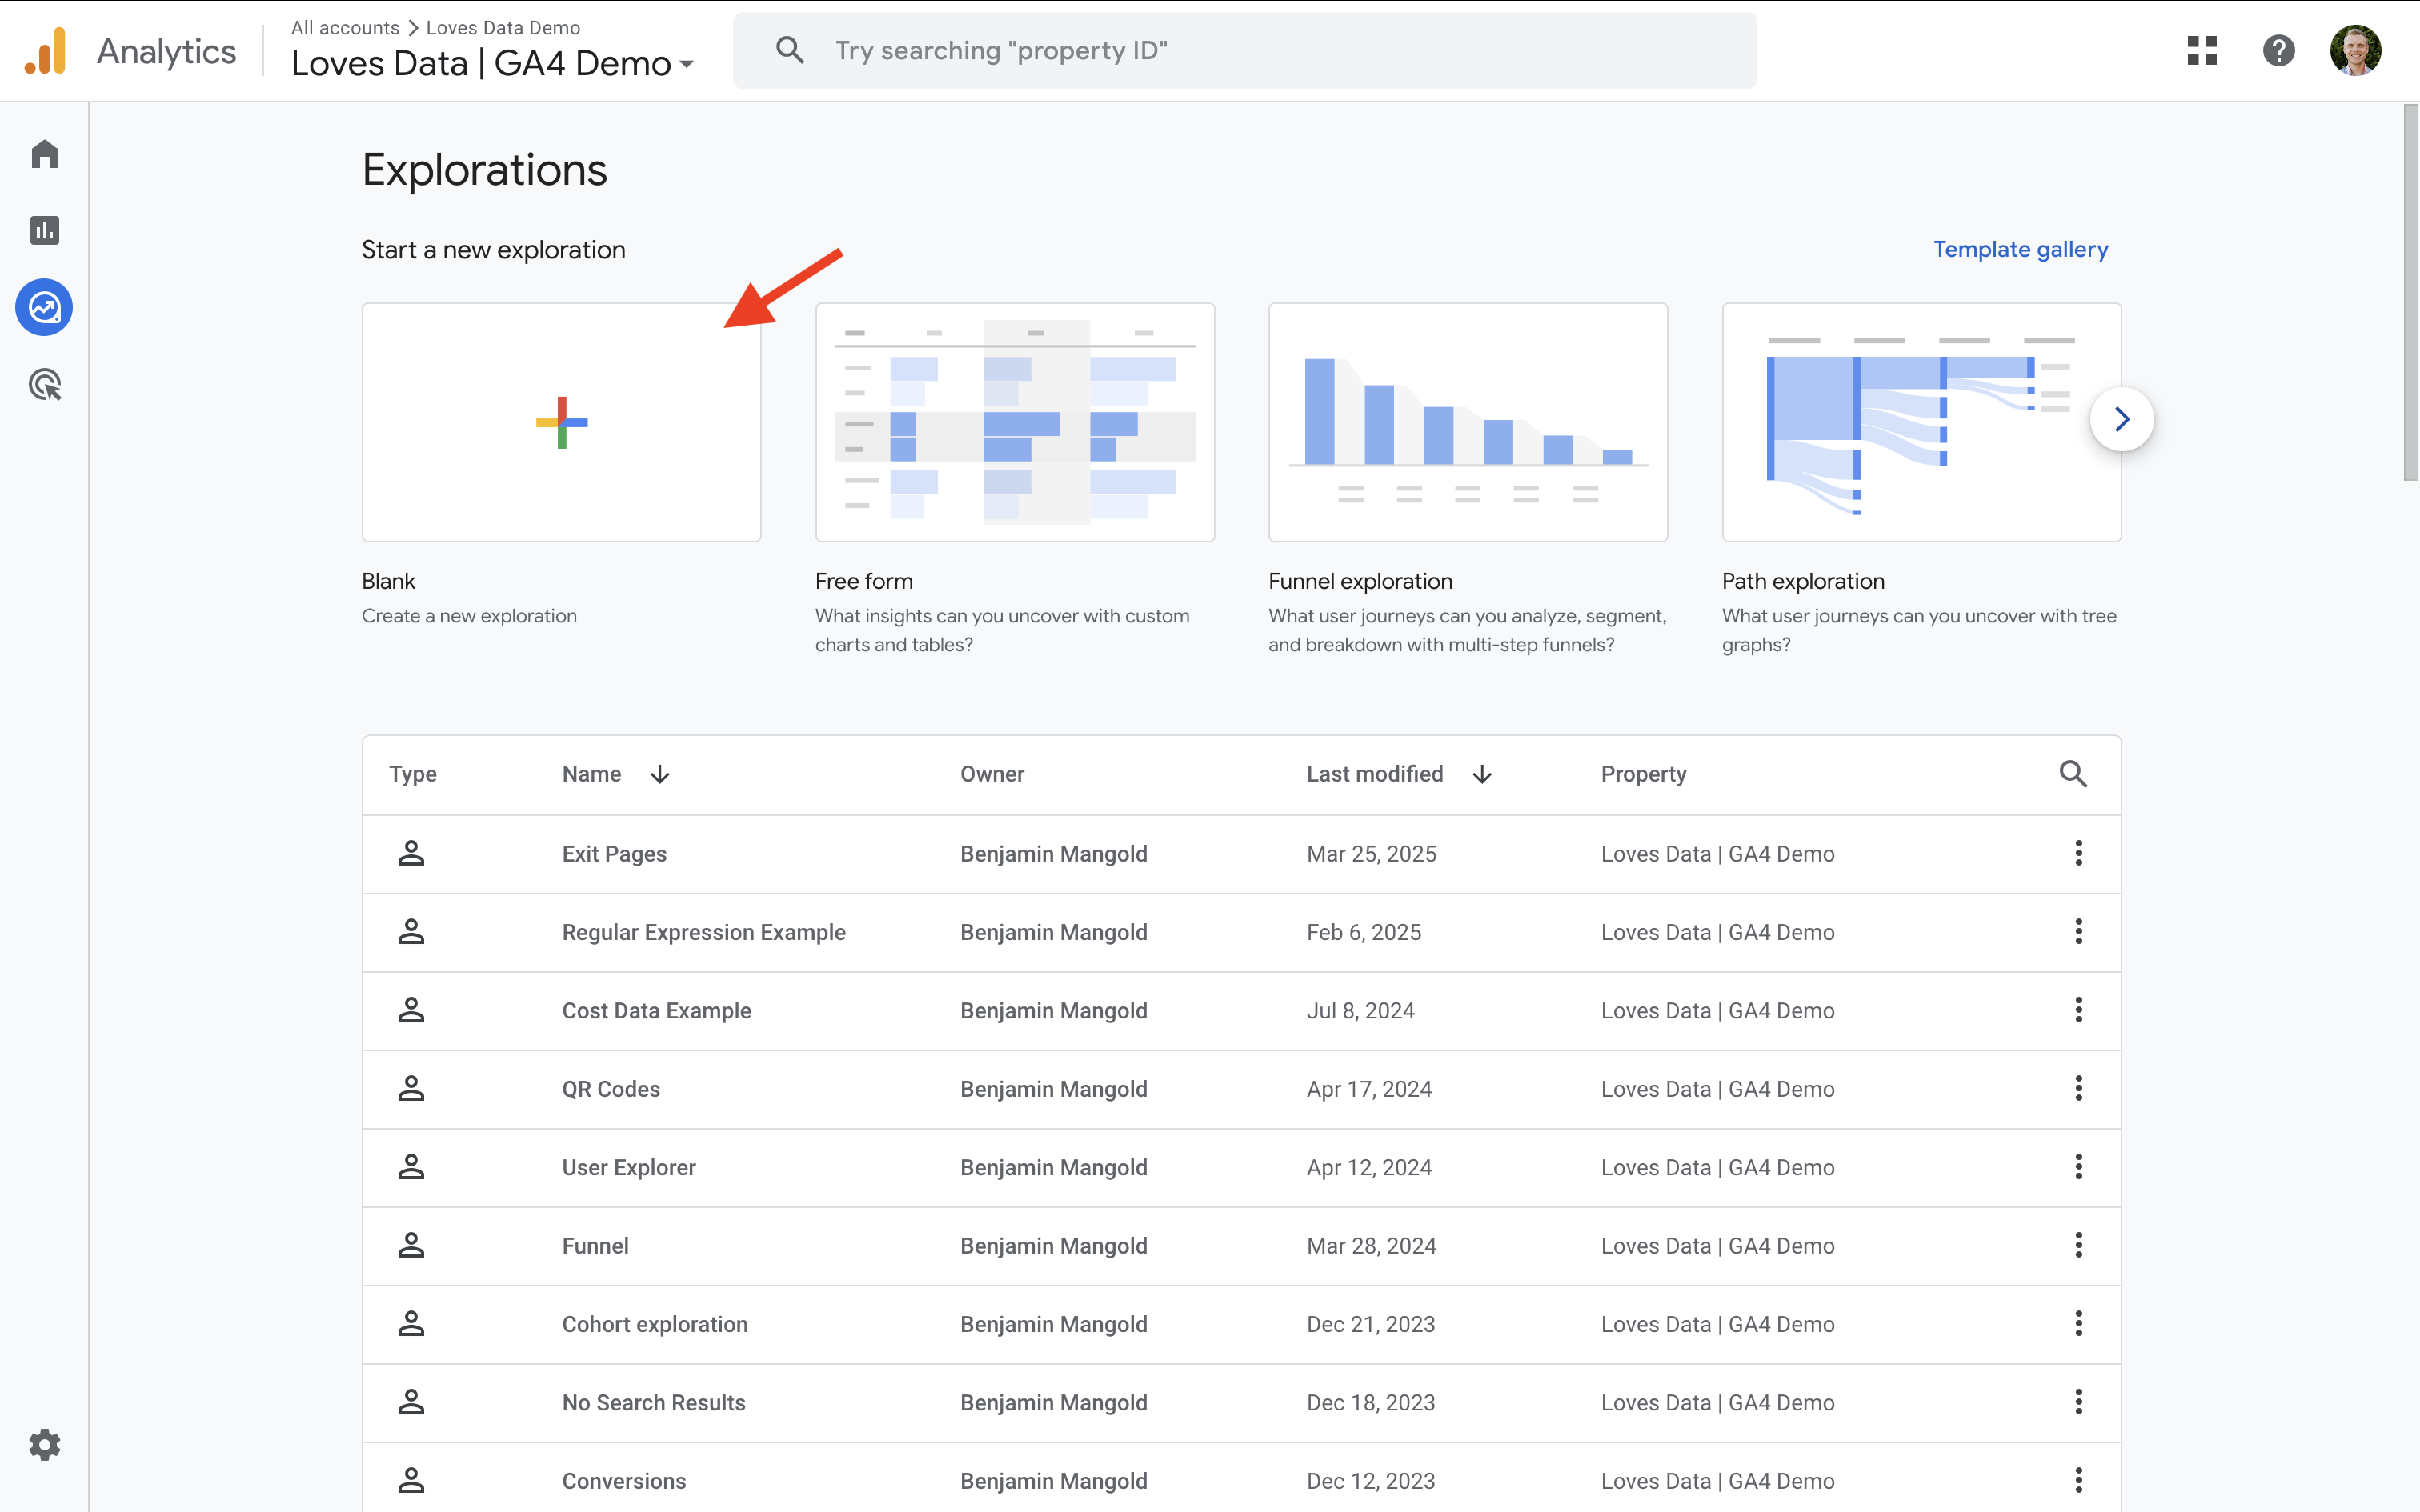
- Name your Exploration report. For example, something like 'Bounce Rate Report'.
- Click the plus sign next to 'Dimensions' and enable the dimension you would like to use, like Landing Page or Session Default Channel Group.
- Click the plus sign next to 'Metrics' and add Bounce Rate along with any other metrics you would like in the report.
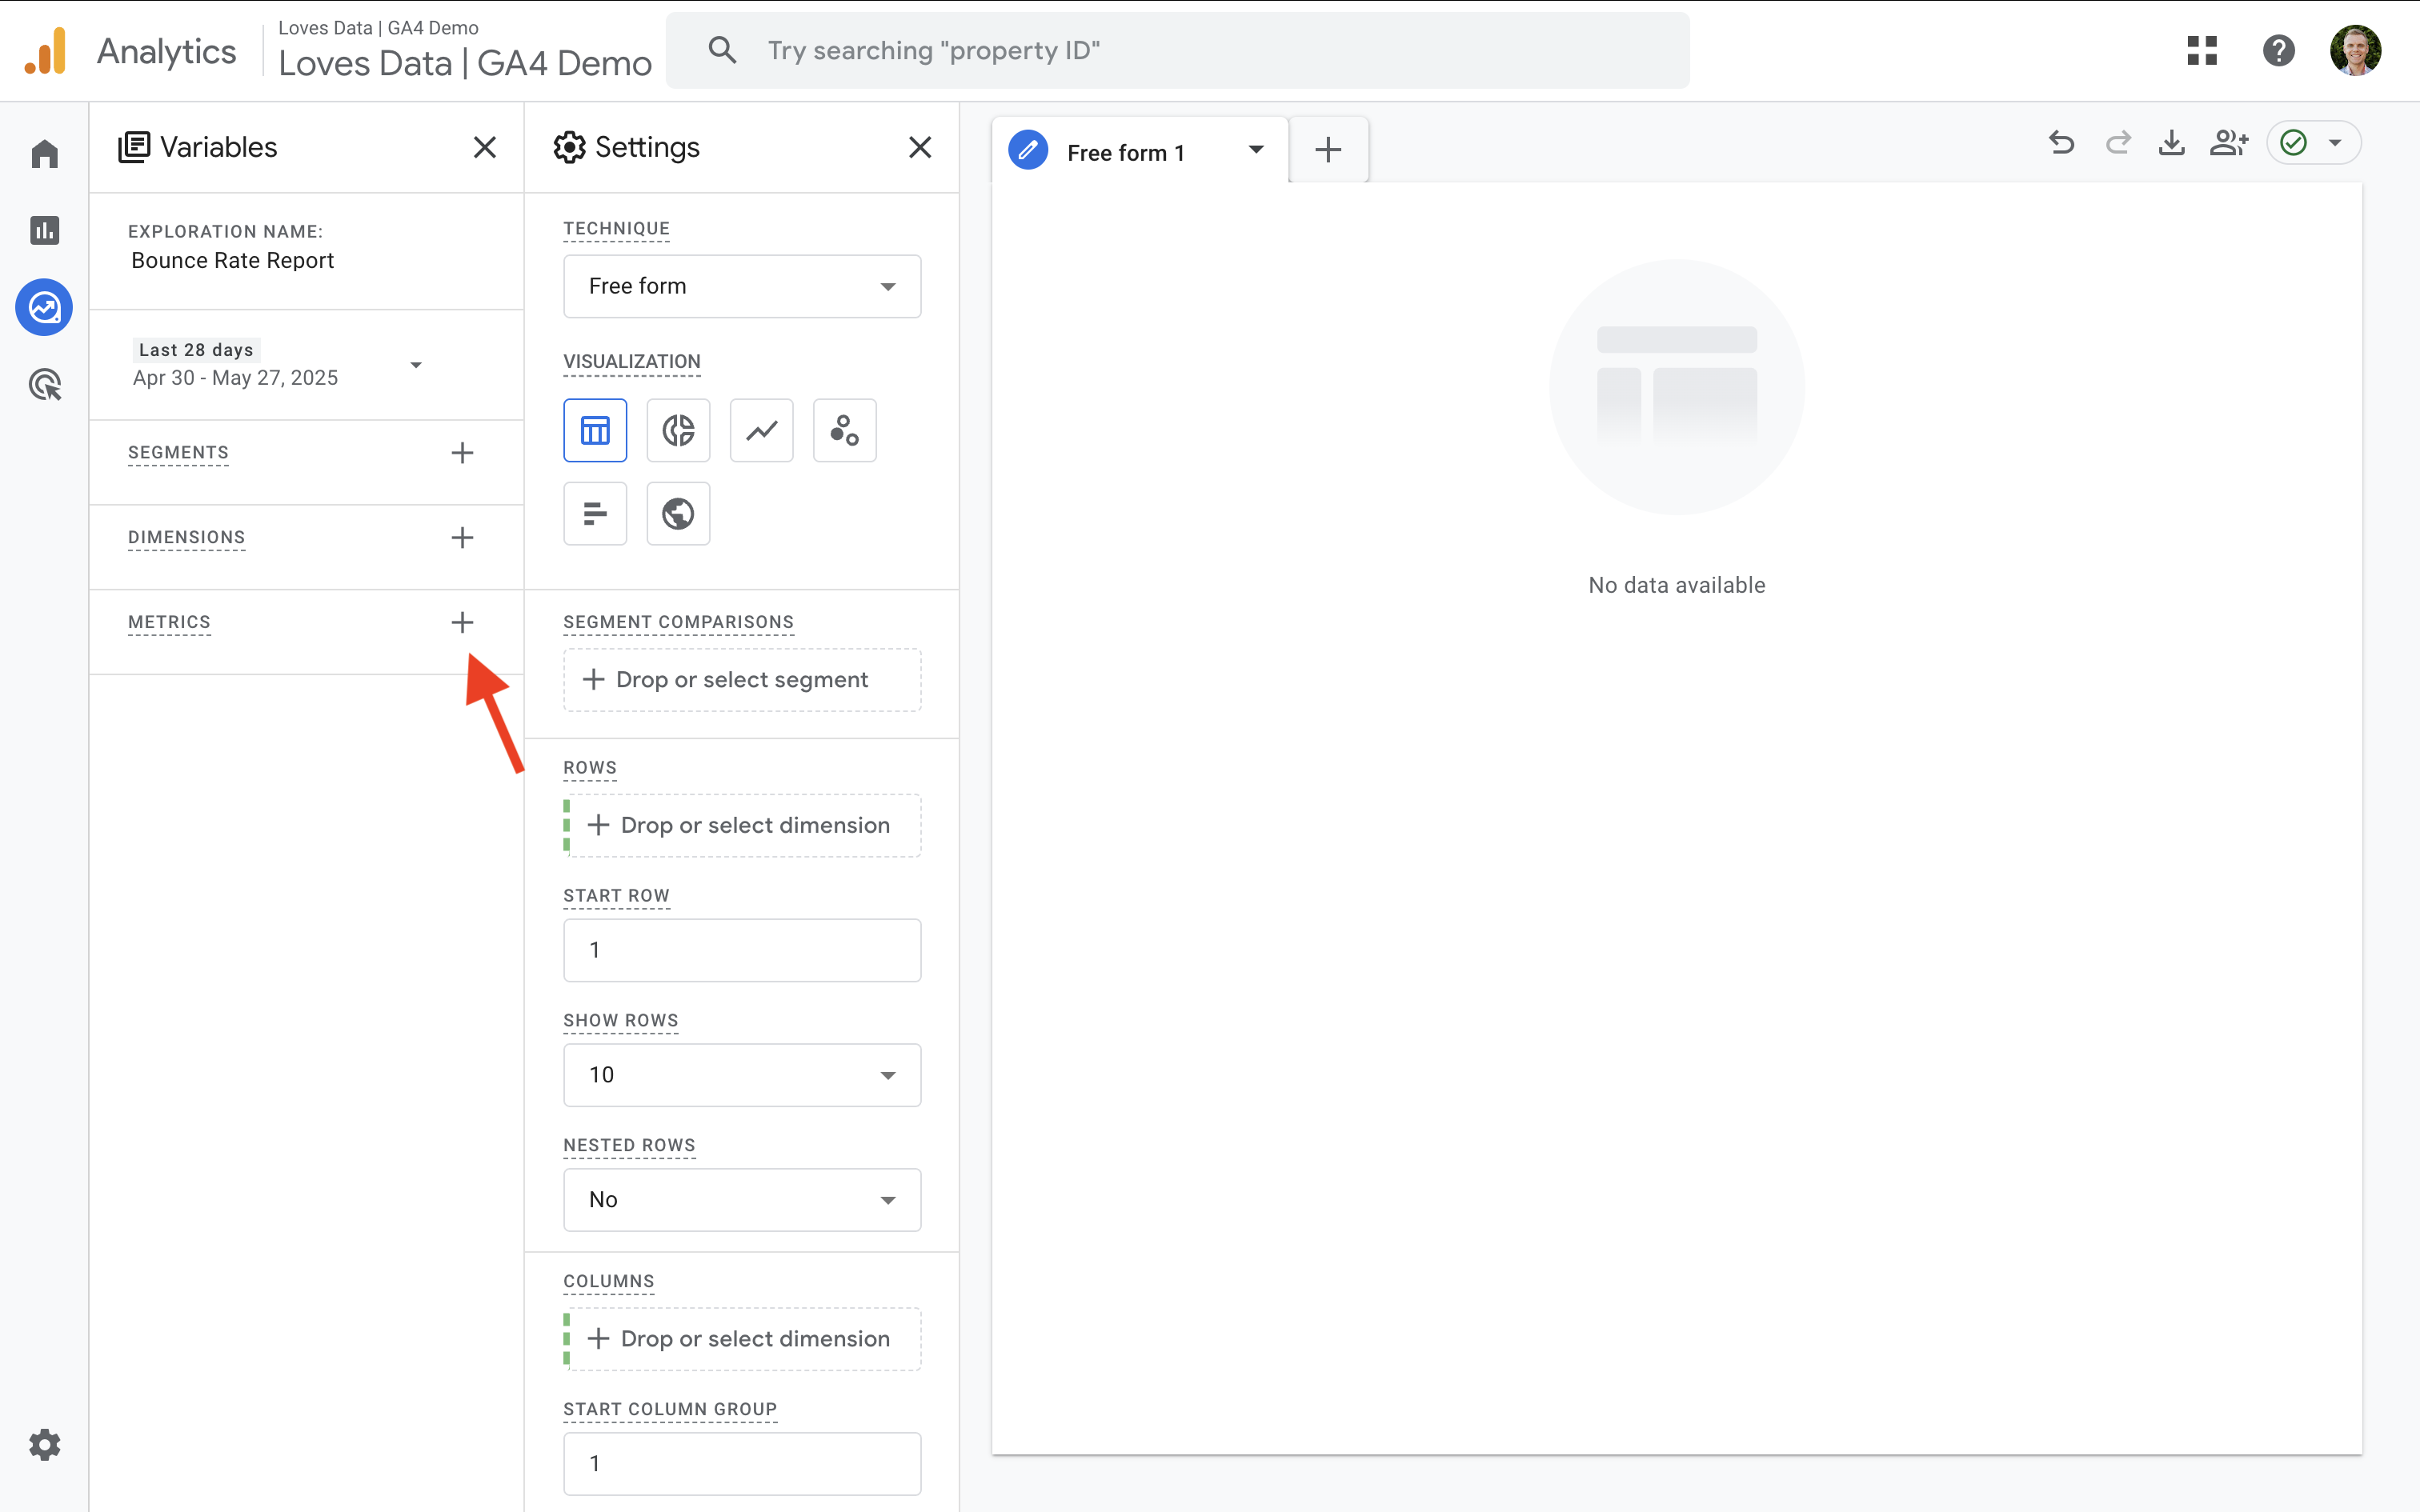
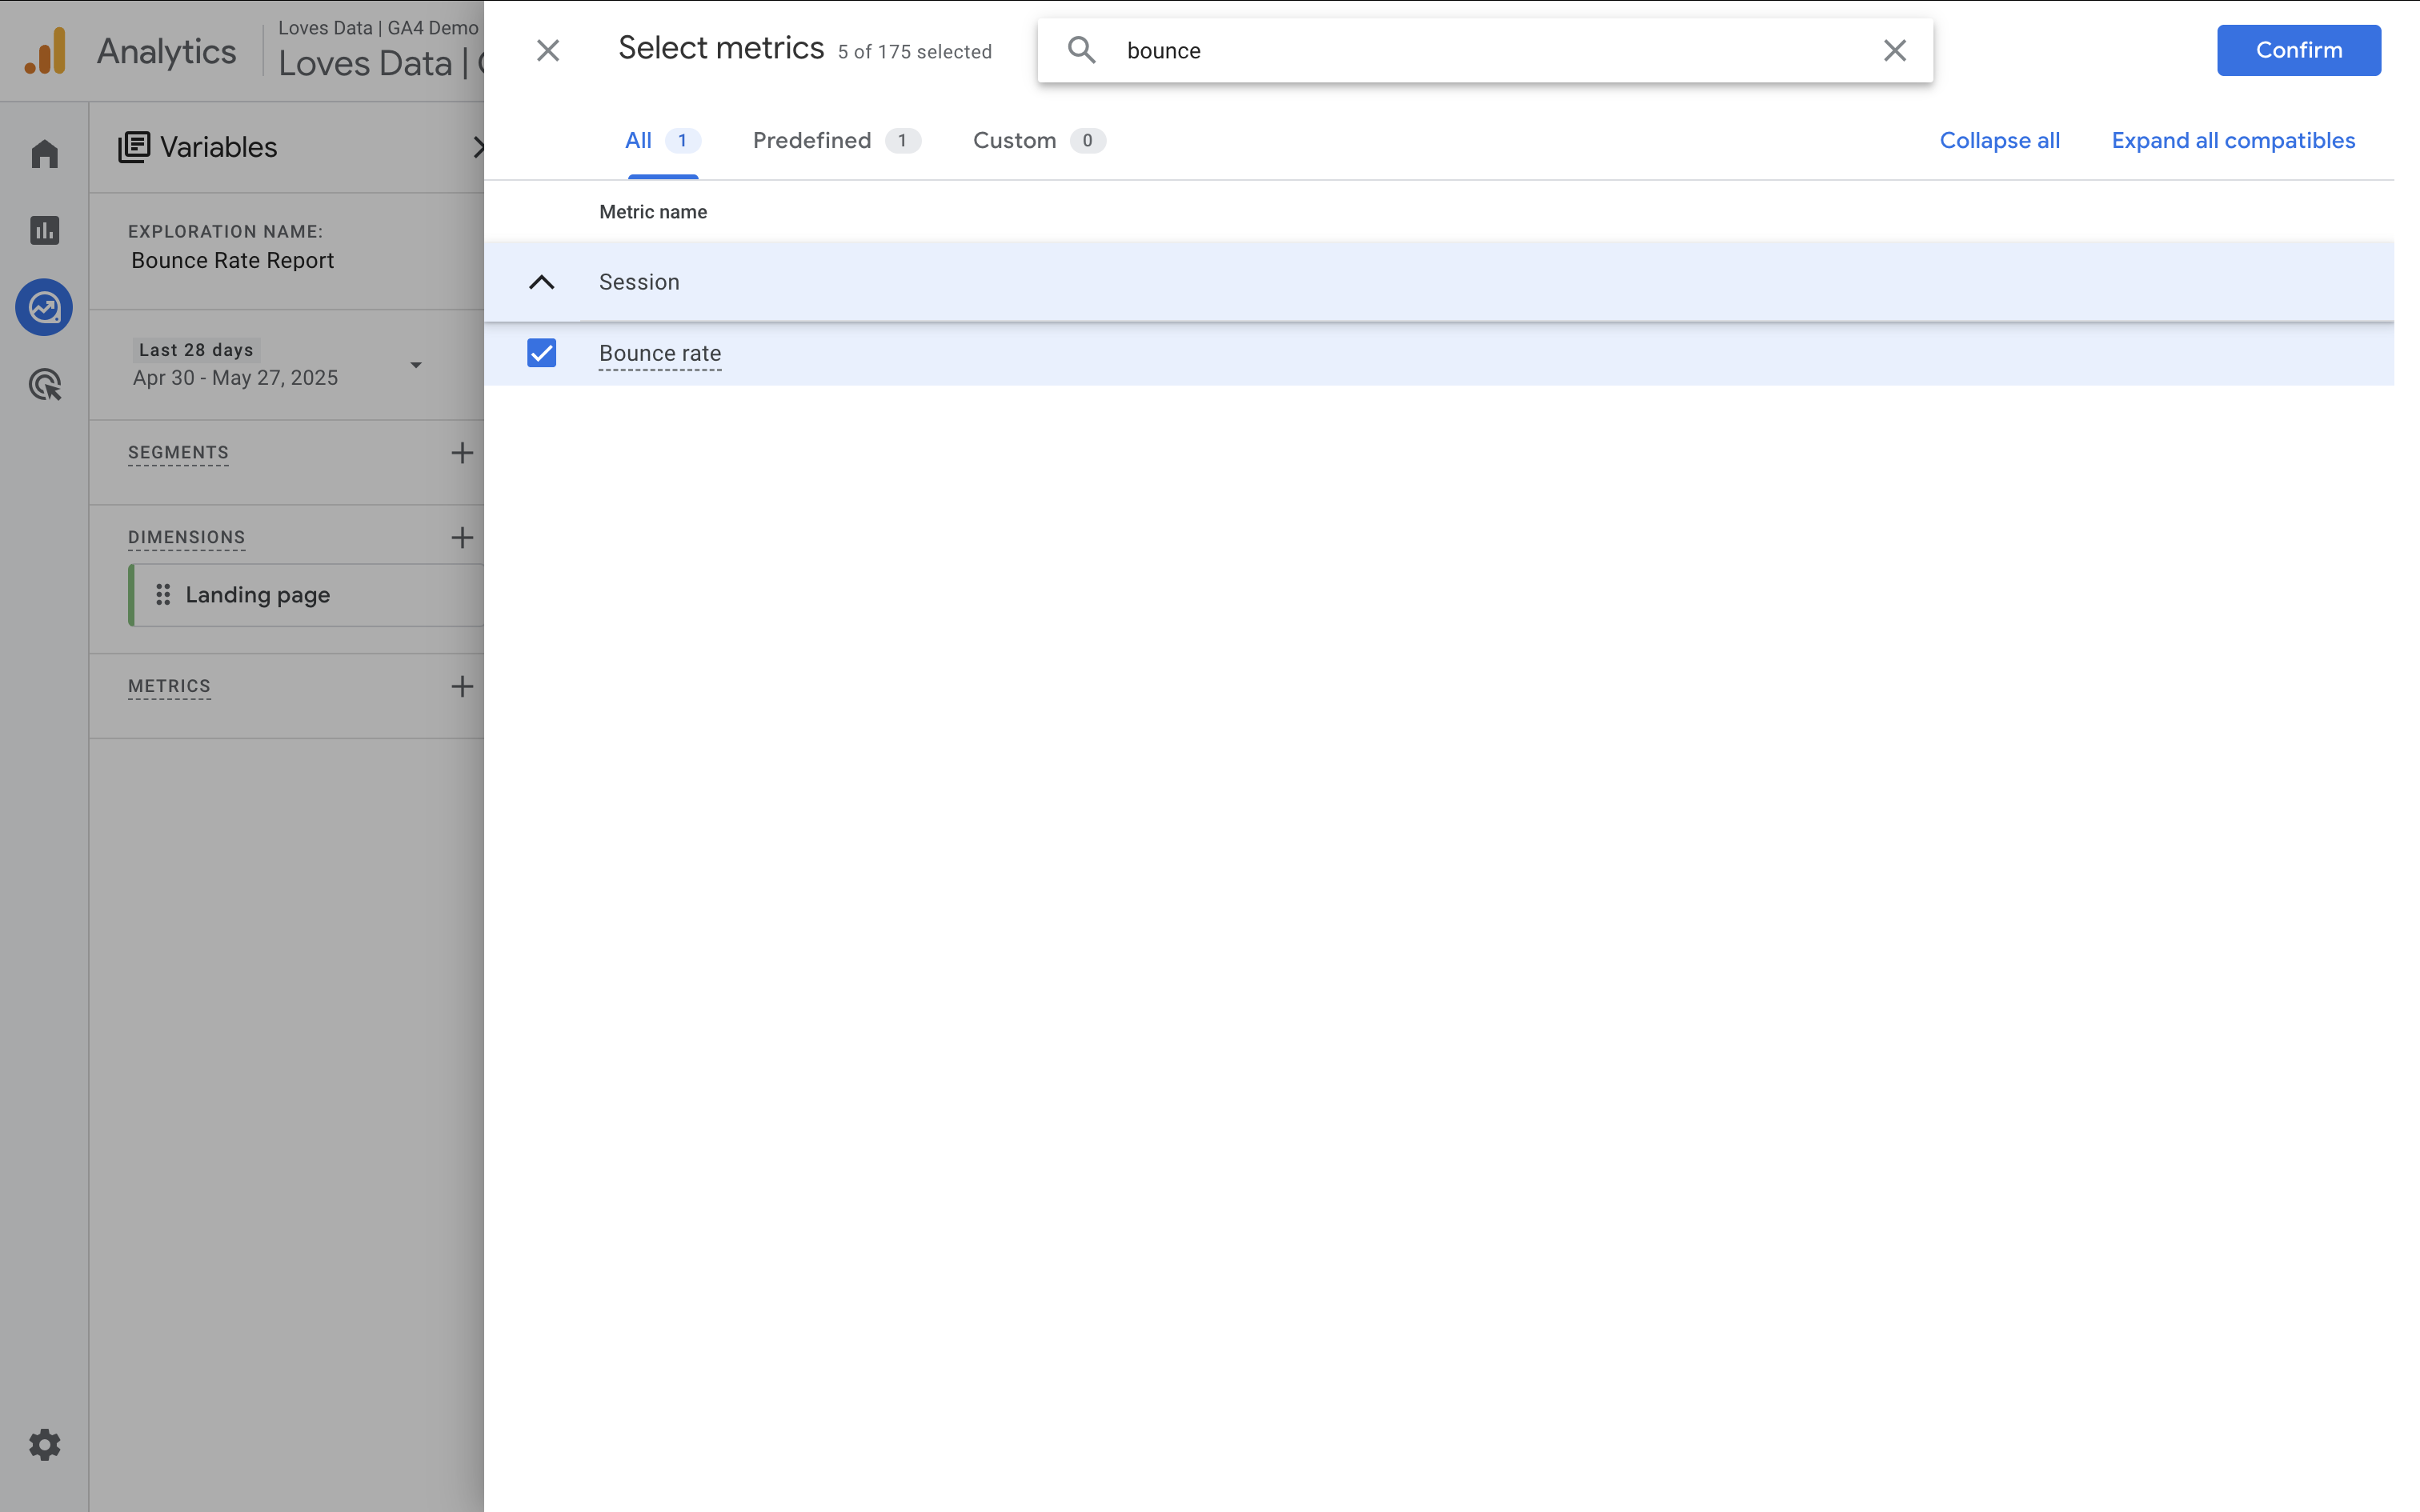
- Double click or drag your dimensions and metrics to add them to the report.
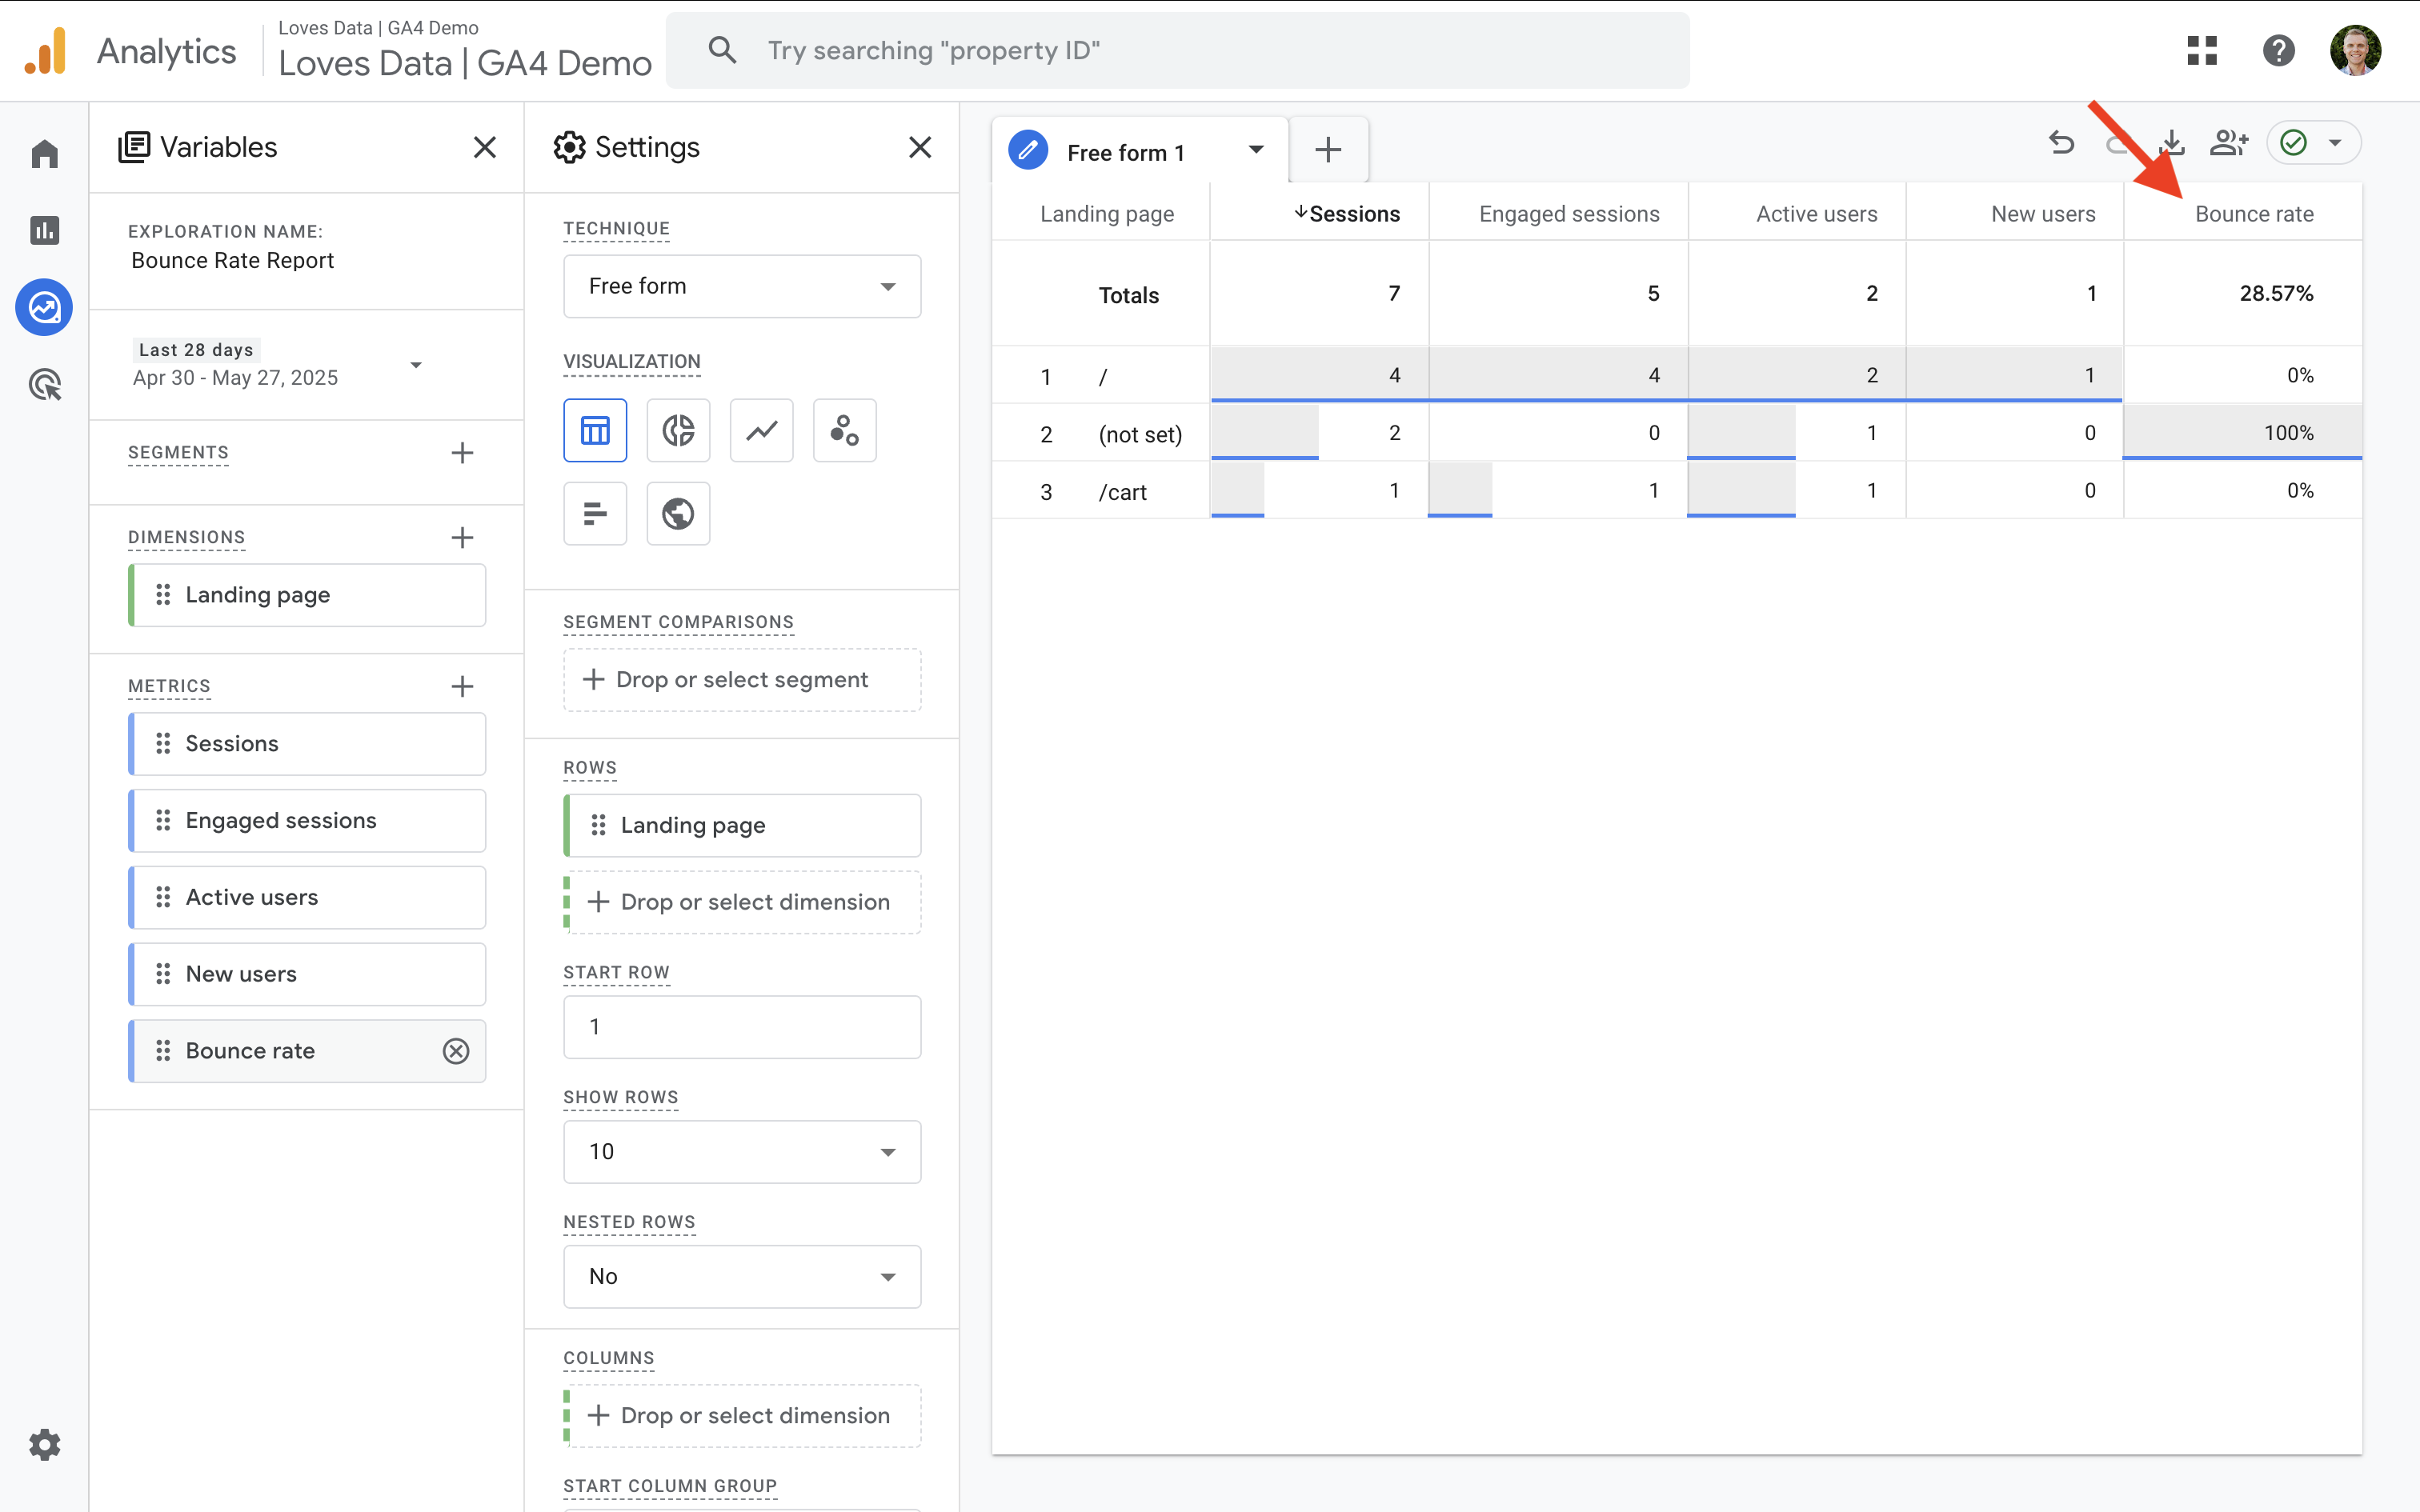
You now have a custom report showing bounce rate for the dimension you've added to the Exploration report.
How Bounce Rate Works in Google Analytics 4
In GA4, bounce rate is focused on engagement. Instead of simply looking at whether someone viewed a single page, GA4 bounce rate tells you whether someone interacted meaningfully with your content.
This makes bounce rate a much more useful metric – especially when paired with other metrics like engagement rate, average engagement time, and key event rate.
For example, if someone clicks a link to your website, skims your homepage for 8 seconds, and leaves – that’s a bounce. But if they spend 15 seconds reading, click a button, or view another page, that session is considered engaged, and it won’t count toward your bounce rate.
Why You Should Track Bounce Rate in GA4
While GA4 includes a number of new engagement metrics, bounce rate is still incredibly helpful – especially when it comes to understanding how people behave on your landing pages.
Use bounce rate to:
- Identify underperforming landing pages
- Spot mismatches between content and traffic sources
- Test and optimize page structure, headlines, and calls-to-action
- Compare traffic quality across channels and campaigns
If a page has a high bounce rate, it’s often a signal that something needs attention – whether it’s the content, the layout, or the intent behind how people are arriving on the page.
GA4 Bounce Rate vs Engagement Rate
You don’t have to choose between bounce rate and engagement rate – they work best together.
- Bounce rate tells you when sessions fail to engage.
- Engagement rate shows how many sessions include meaningful interaction.
These two metrics are inversely related. For example, if your bounce rate is 30%, your engagement rate will be 70%.
Why use both?
Tracking both bounce and engagement gives you a clearer picture of what’s working and what needs improvement. Bounce rate helps you find problems, while engagement rate highlights successes.
Related GA4 Metrics to Consider
Along with bounce rate and engagement rate, here are other useful metrics to include in your reports:
- Average engagement time measures how long users actively engage with your content
- Page views per session shows how many pages people view on average
- Key event rate helps you understand how often important actions occur (like sign-ups or purchases)
- Unique user scrolls indicates how far users scroll on a page
- Exits and exit rate shows where users are leaving your site
GA4 Bounce Rate vs Exit Rate
It’s easy to confuse bounce rate and exit rate in GA4, but they measure different things and serve different purposes.
- Bounce rate shows the percentage of sessions where people leave without engaging – they visit your site and don’t spend much time, click around, or convert.
- Exit rate shows the percentage of users who leave your site from a particular page, regardless of how many other pages they visited before.
So while bounce rate focuses on sessions with no meaningful engagement, exit rate helps you understand where users are exiting – even after interacting with other pages on your site.
Bounce Rate vs Engagement Rate vs Exit Rate
It can sometimes be tricky to know which metric to focus on. Here's a quick table comparing bounce rate, engagement rate, and exit rate to make things easier:
| Metric | What It Measures | When It's Useful |
|---|---|---|
| Bounce Rate | Percentage of sessions with no meaningful engagement (single page view, short time, no conversions) | Identifying landing pages that fail to encourage interaction |
| Engagement Rate | Percentage of sessions with meaningful engagement (longer than 10 seconds, multiple page views, or a conversion) | Understanding how well your content resonates and drives actions |
| Exit Rate | Percentage of sessions that end on a specific page, after one or more interactions | Analyzing where users leave your site after navigating multiple pages |
A Quick Note on Universal Analytics
In Universal Analytics, bounce rate was based on single-page sessions. In GA4, it’s based on non-engaged sessions. This change means GA4’s bounce rate is more aligned with how people actually use your website – and gives you a better way to assess content performance.
That said, the core idea is still the same: bounce rate helps you identify when people leave without engaging.
Bounce Rate: GA4 vs Universal Analytics
| Feature | Universal Analytics (UA) | Google Analytics 4 (GA4) |
|---|---|---|
| How it's calculated | Single-page sessions with no interaction hits | Sessions that don’t meet engagement criteria |
| Engagement criteria | None | 10+ seconds, 2+ pageviews, or a conversion |
| Included by default? | Yes | No – must be added manually |
| Ideal for | Identifying immediate exits | Understanding lack of meaningful interaction |
| Limitations | Misleading for content-focused or single-page sites | More accurate for behaviour analysis |
Final Thoughts
GA4 bounce rate is a powerful metric – even if it’s changed from what we were used to in Universal Analytics. By focusing on engagement and combining bounce rate with other GA4 metrics, you can better understand how people interact with your website, what’s working, and where there’s room to improve.
If you haven’t already, I recommend adding bounce rate to your GA4 reports. It only takes a minute – and it gives you another layer of insight into your website’s performance.
Comments