Benchmarking reports in Google Analytics
Loves DataIMPORTANT:
This is a historical post from 28 March 2008. Benchmarking has since been removed from Google Analytics.
The Google Analytics benchmarking reports are now available for those of us who have opted in to anonymously share our data. The reports are available within the Visitors report section.
The benchmarking reports include:
- Visits
- Pageviews
- Average pages per visitor
- Bounce rate
- Average time on site
- Percent of new visitors
These reports allow you to compare your site's performance to that of sites within your industry. The feature only compares your site to "site of similar size" which ensures that small sites (e.g. a local business) are not being compared to goliath sites (e.g. a multi-national). Ensuring that you can only compare your site to a "site of similar size" also ensures a level of democracy for the reports, large organizations will be prevented from creating a tiny site to try and get access to competitive data.
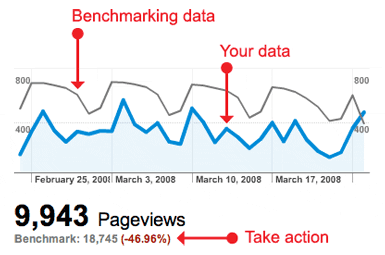
An example of an site under-performing in comparison to the benchmark:

benchmarking-google-analytics-pages
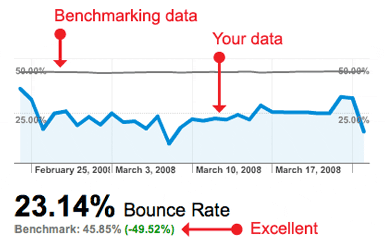
An example of a site that is better than the benchmark:

benchmarking-google-analytics-bounce
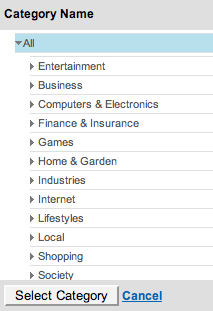
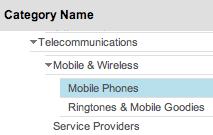
By default the initial benchmarking reports compare your site to "all sites of a similar size". To get the juicy reports and really see how you are performing you need to select "Open category list" and select a category that is the closest match to your industry. It is also a good idea to take a look at your data in comparison to other industries, for example, a winery could check their data against Food & Drink > Alcoholic Beverages > Wine and Travel > Attractions & Activities.
The available categories are expanding rapidly, so even if you do not currently see your industry, check the report in the couple of days and you might be pleasantly surprised.
Benchmarking category selection tool:

benchmarking-category

benchmarking-category-example

Comments