3 Top Tips to Help You Optimise AdWords Campaigns with Dashboard Reporting
Loves Data

Your online AdWords dashboard can be a valuable tool for measuring and optimising the performance of your campaigns. In this post, we will show you three top ways to use your AdWords dashboard to understand and improve the performance of your campaigns.
1. The comparison table
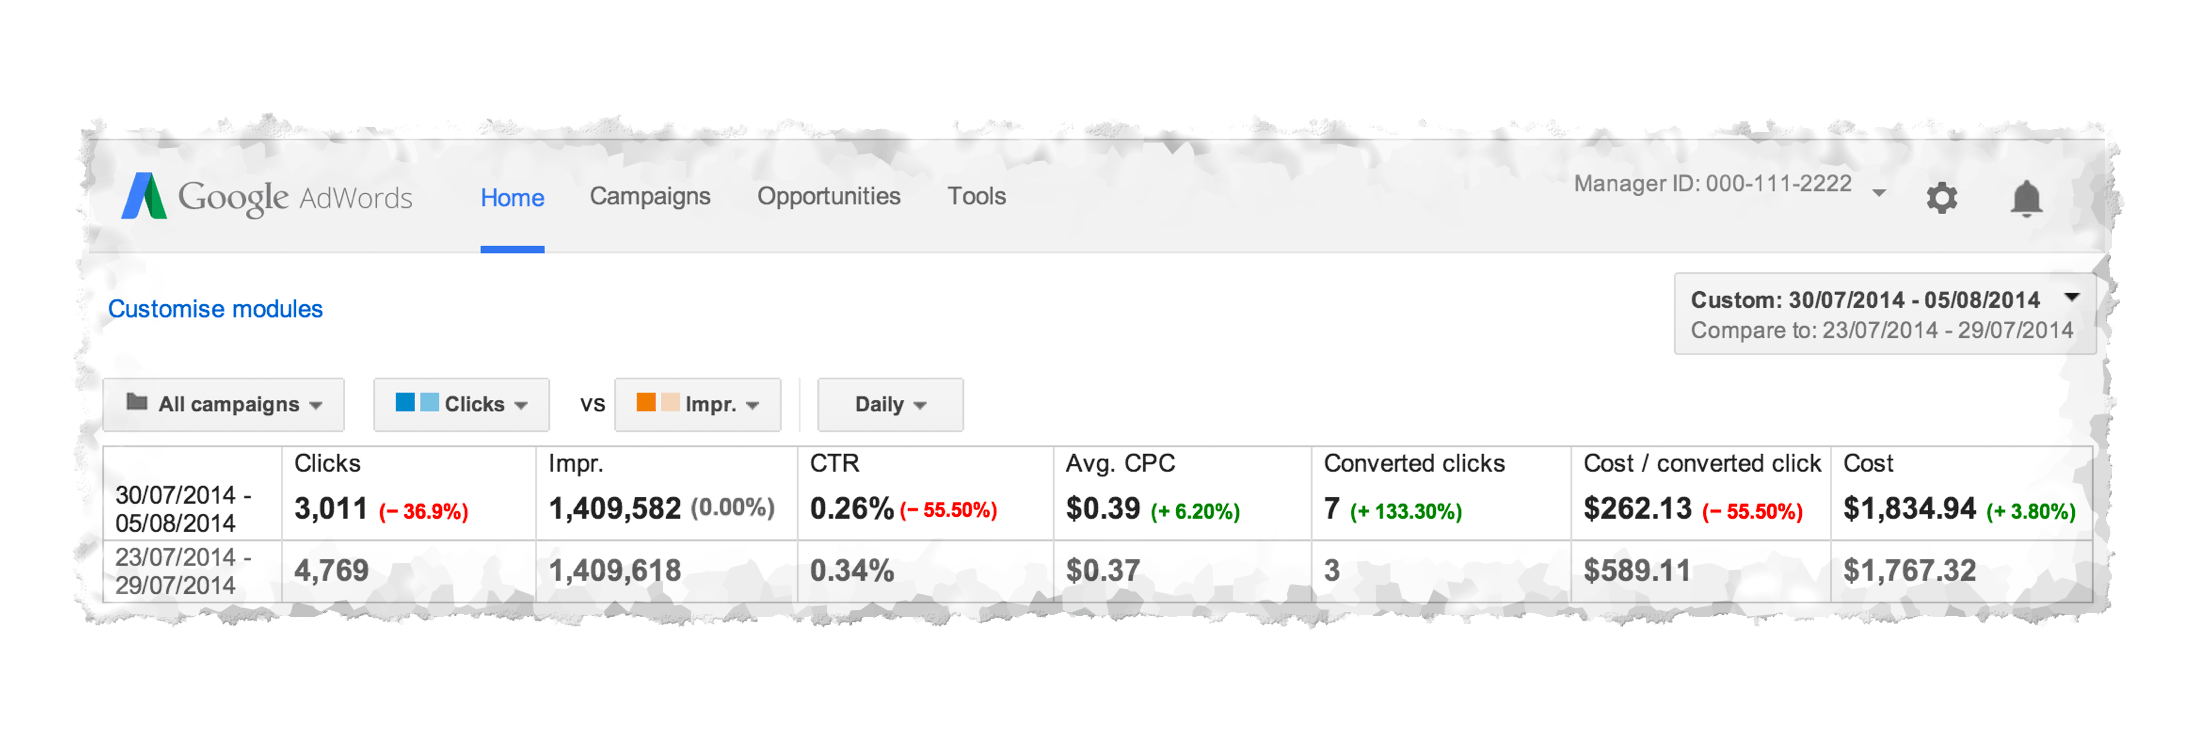
At the top of your dashboard there is a high-level comparison of key performance data on your campaigns for two date ranges.
Click in the box to the top right of the table to choose your comparison periods – maybe you’d like to compare the latest week against the previous week. The table will update to show the key metrics for your two comparison periods, including the number of times users clicked on your ads, the Click Through Rate and the total cost.
Let’s look at an example
We can see that the number of clicks has fallen by more than a third from one week to the next. That is a substantial drop and you will want to quickly understand why that is happening: are your ads not being shown as often (a fall in number of impressions) or just not leading users to click on them to the same extent (a fall in CTR)? In this case, the number of impressions has barely changed but the Click Through Rate has also fallen.
Now you can look into some of the more detailed reports to check which campaigns and ads were responsible for the decrease and why. Perhaps some ads are appearing in lower positions on search result pages and you can try changing the ad content or optimising your keyword bids.
2. The top movers report
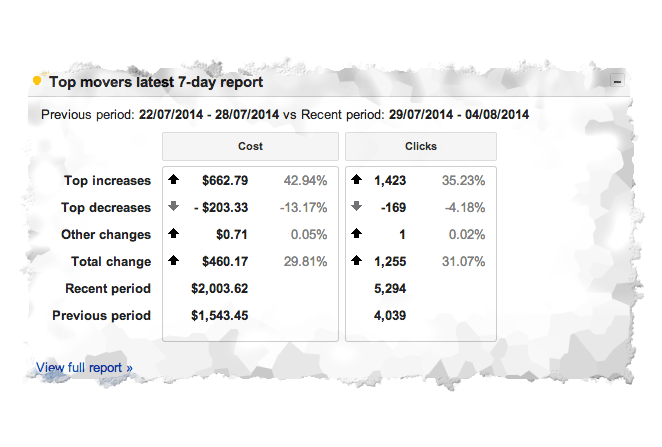
The top movers report is useful if you are wanting to monitor the impact of changesto your campaigns or just wanting to keep a watch for unexpected swings in campaign performance. This report might look a bit daunting at first, but it’s really quite simple and a powerful tool for you to use.
Let’s look at an example:
Having chosen your two comparative date ranges from the dropdown in the top-right, the total change row shows that the total number of clicks on your ads and the total cost both increased nearly one-third between the two periods.
But that’s not the whole story, as inevitably not all campaigns change in the same way. This report breaks out the contributions which is much more useful than just the single figure for total change. Now you know that there are some campaigns that have performed comparatively very well compared to the previous week and some not so well. And you can now dig into their performance in more detail: click on View full report to be taken to a more detailed report – this takes you out of the Home dashboard tab and into the Campaigns tab.
This report drills down into each of the top mover campaigns, showing the change in key metrics between your two chosen date ranges. Most usefully, it also gives some suggestions for the possible causes for those changes based on the edits made within your account.
So, by identifying at a glance the campaigns top movers, you can easily identify actions and optimisation measures to take to keep your campaigns on track.
3. Keywords below first page bid
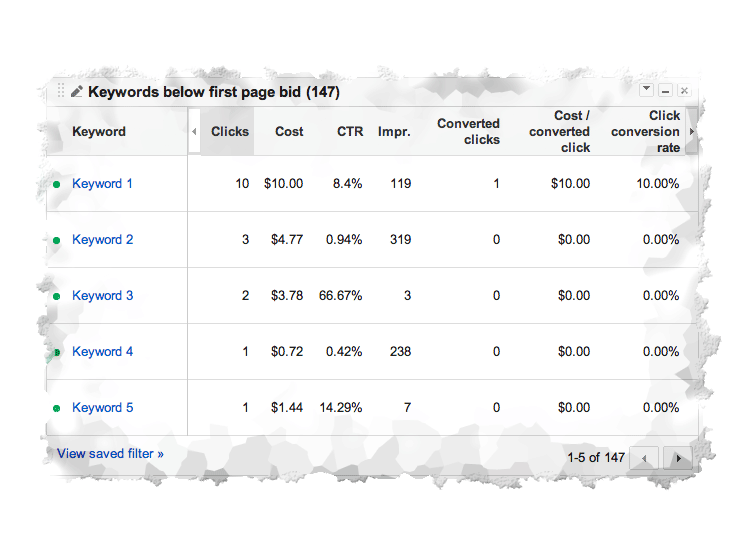
This report gives you a quickly accessible view of any keywords where your Cost Per Click bid is insufficient to place your ads on the first page of search results. Your ads for these keywords will usually appear only when users click through to the second or subsequent page of results – which we all know is rare.
If you consider any of these to be important keywords for your ads to appear on the first page, you will want to consider increasing your bids or working to improve your Quality Score.
Putting it into practice
To make the most of your AdWords investment requires spending time monitoring and optimising your campaigns on a regular basis and the dashboard is a great way to get started on this.
Do you use the AdWords dashboard to keep an eye on your campaigns? Do you have any custom reports that you find useful? Let us know in the comments.
Comments