Google Analytics App: Top 10 Tips
Loves Data
Mobile Apps are now available for Google Analytics on both Android and iOS
Ever felt the need to check your conversion rate or landing page engagement while you are out of the office?
The official Google Analytics Apps allow you to do just that and much more. The first official app was launched in 2012 for Android and allowed you to view a limited number of reports. Then in 2013 a new version of the app was rolled out and allowed for greater flexibility.
Until July 2014 the only option for iOS users was to use a third party app to access their data, but now iPhone owners can also use Google’s official app to check up on the performance of their websites and mobile apps. This recent roll out means a greater number of marketers will have access to their accounts on the go and it will encourage more flexibility in the workplace.
Before we start, don’t forget to grab the Android or iOS Google Analytics App if you haven’t already.
Tips for using the Google Analytics App
Tip 1: Apply a segment
When you first load up the app you will be presented with Google Analytics data for everybody who has visited your website. This is the same way the web interface works, so to get more granular apply a segment to narrow down your focus.
If you are looking at conversions, then you can apply either the ‘Conversions’ or ‘Transactions’ segment to the reports. This will provide more detail about who is converting on your website. Try using this in combination with one of the more detailed reports, like the ‘Location’ or ‘All Traffic’ report.
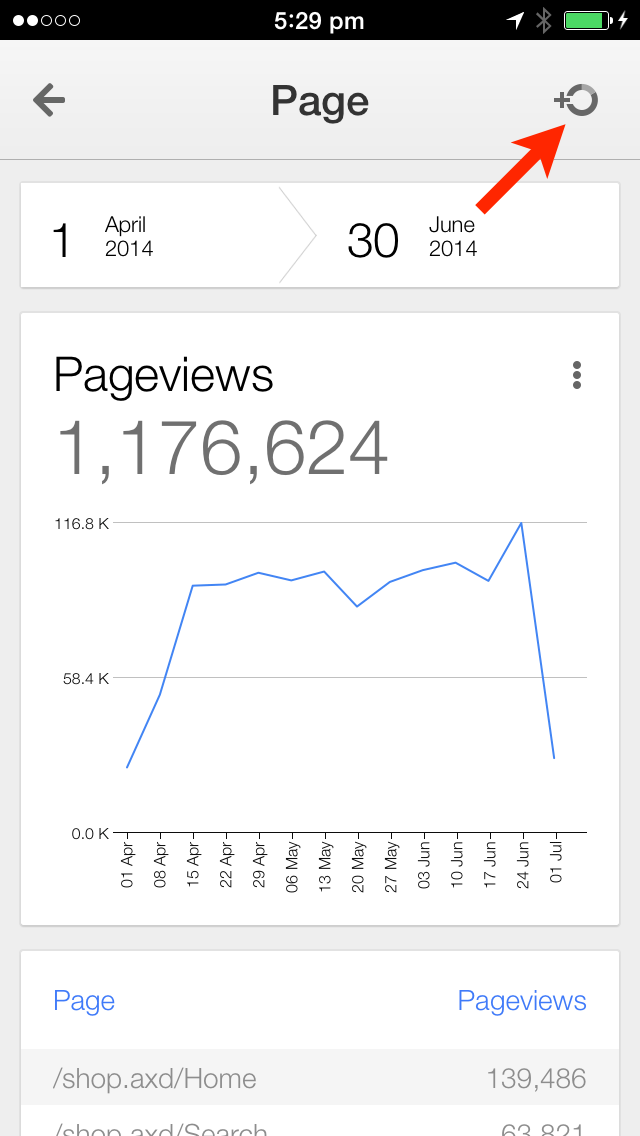
To apply a segment, click the segment icon on the top right corner of the report pages.
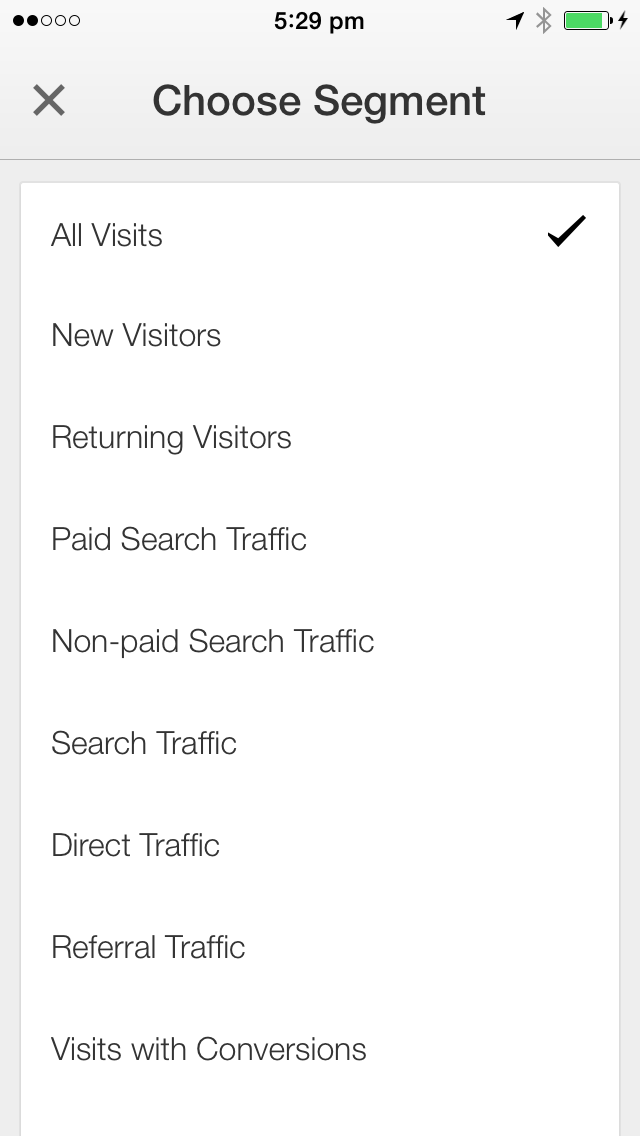
If you are running paid search campaigns, then you can apply the ‘Paid Search’ segment to analyse your Google AdWords campaign performance (and any other paid ads where you have applied campaign tags).
Tip 2: Use the pageviews heat map
The pageviews heat map report is a unique report which is not available (yet) within the web interface (it can be found under ‘Behavior’ on the Overview report).
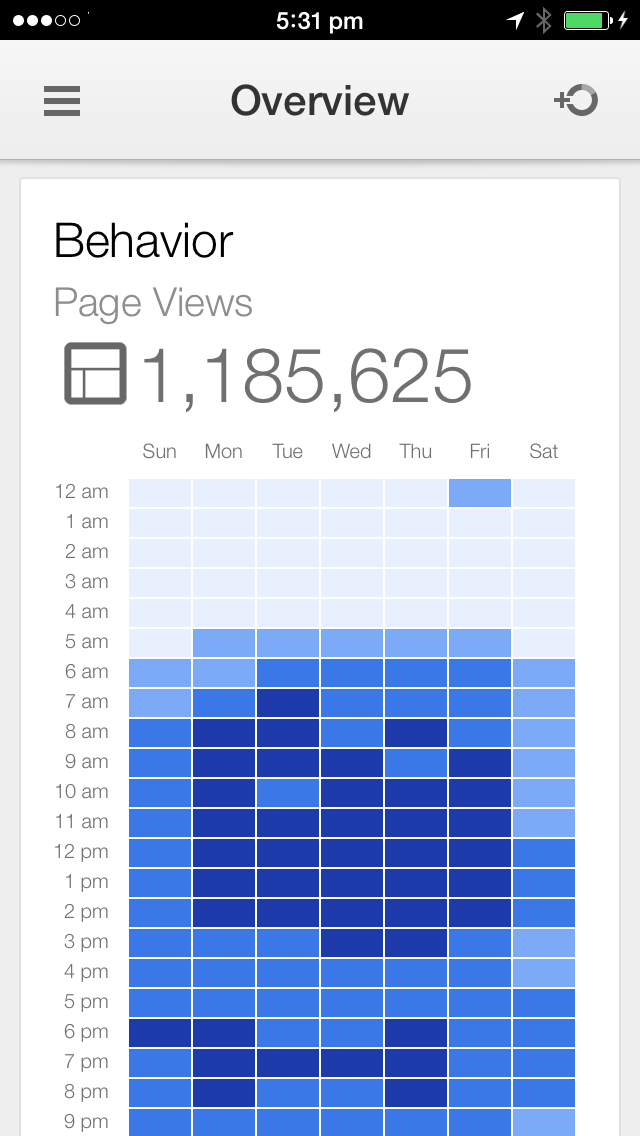
The report allows you to quickly identify the times of day and day of the week where you receive the highest number of pageviews. You can use this to identify times that are critical to you which will help promote particular content (or products, services or other offers) at specific times of the day.
This can be even more powerful if you combine it with one of the conversion segments. For example, if you find that there is a particular time when you get more pageviews and more conversions, then you could pinpoint that time for particular offers. This could be for your paid advertising, your social media initiatives and even content you feature on your website.
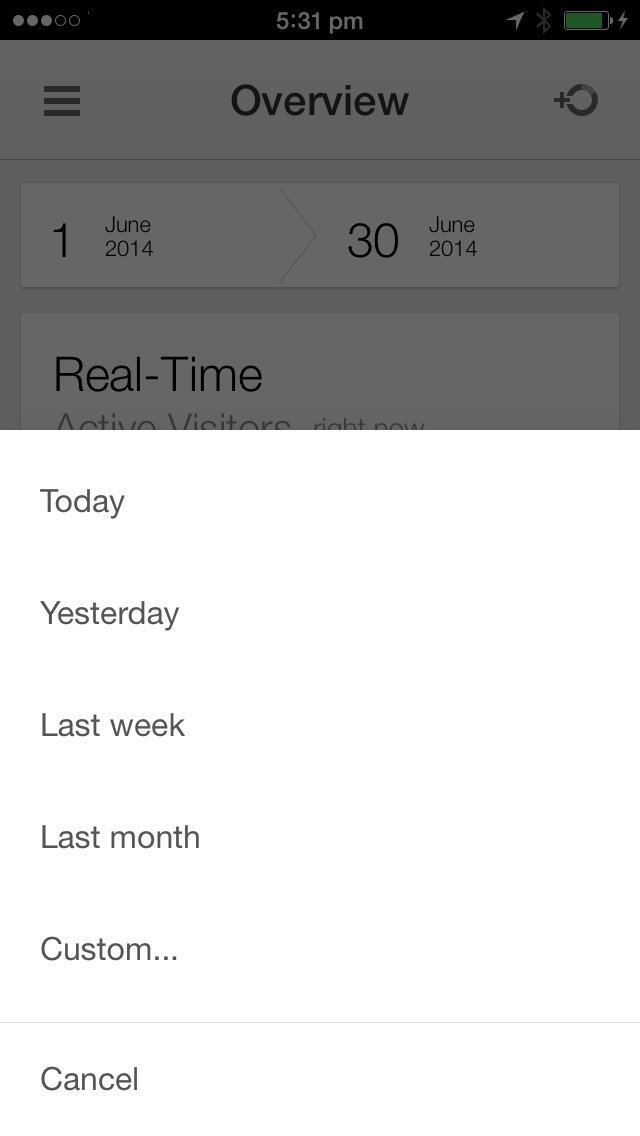
Tip 3: Choose a date range
You can quickly change the date range for the data that you are looking at within the reports. Simply click on the date range at the top of the reports (excluding the Real-Time report) to select today, yesterday, last week, last month or a custom date range.
Tip 4: Know which reports are available within the app
The mobile app contains a lot of reports, but it does not contain every single report that is available within the Google Analytics web interface. Knowing what is available within the app can save you time. Here is a quick list of the main reports you will find within the app:
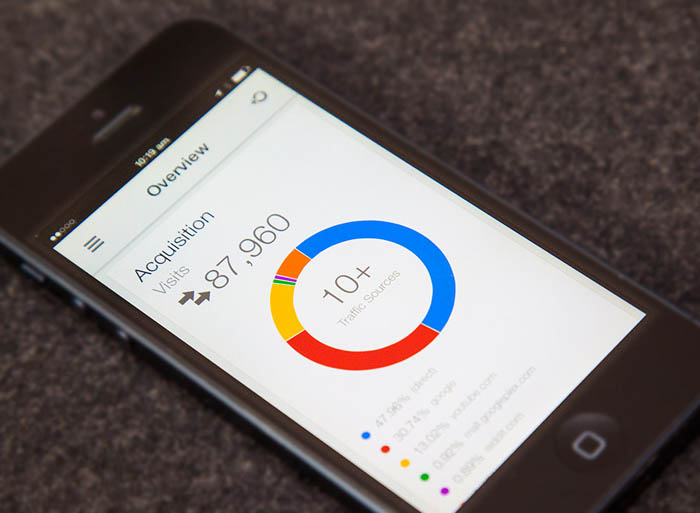
- Overview allows you to see the number of people currently engaging on your website, top 10 countries of your audience, top traffic sources, heat map of pageviews and conversions.
- Real-Time shows you details about people who are currently on your website, including their geographic location, how they found your website and what pages they are currently viewing.
- Audience reports allow you to see details about who has engaged with you, including if they are new or returning, what browsers they use and people using mobile devices.
- Acquisition reports show you how people are finding you, including their source and medium (under ‘All Traffic’), organic search, paid search and social traffic.
- Behavior reports allow you to see the content that people are engaging with, including your landing pages and any custom events you have implemented.
- Conversions allow you to see details about goal conversions and ecommerce transactions.
The only major difference between the Android and iOS version of the app is that the Android version allows you to create simple custom reports under ‘My Reports’. This allows you to select a single metric and single dimension to create a custom report.
Tip 5: Quick switch between views
If you use Google Analytics to measure multiple websites (or apps), then you might have a long list of reporting views when you log into Google Analytics. Once you have selected and loaded a view within the app it becomes available under a list of recent views you have used.
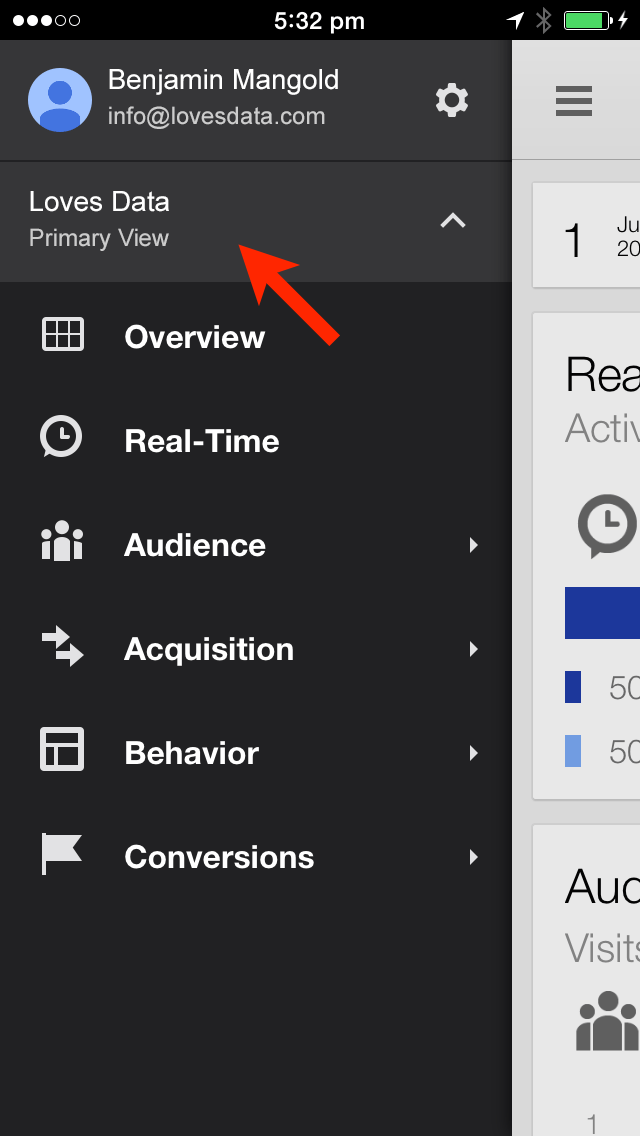
Click on the menu icon and then click the name of the current view you are using to see a list of your recent views and to even select another view you have access to.
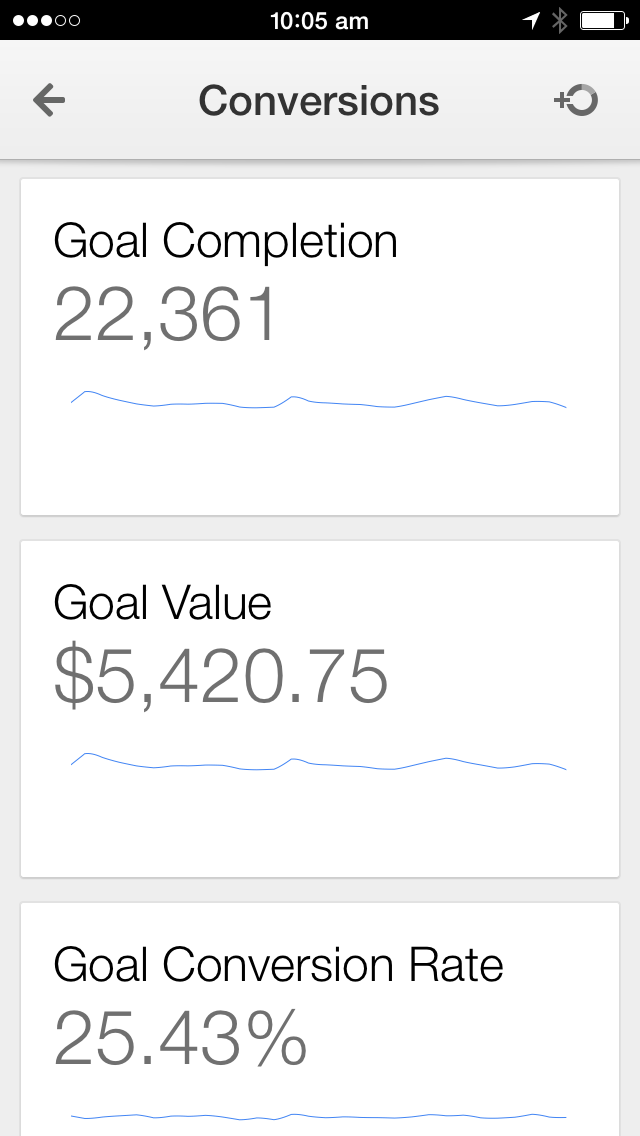
Tip 6: View more details
Each report within the app is made up of cards, each card presents a different piece of information. You can click on a card to then view more details. For example, if you are looking at the ‘Conversions’ card on the Overview report you can click on the card to then see more details about people converting on your website. After clicking the card you will see the total number of goal completions, along with goal value, conversion rate and additional details if you also have ecommerce tracking setup.
Tip 7: Change the graph
On some cards you will notice three little dots in the right hand corner, you will find these on some individual reports and also after you have drilled down on particular cards. Clicking the dots will allow you to change the way data is presented on the graph.
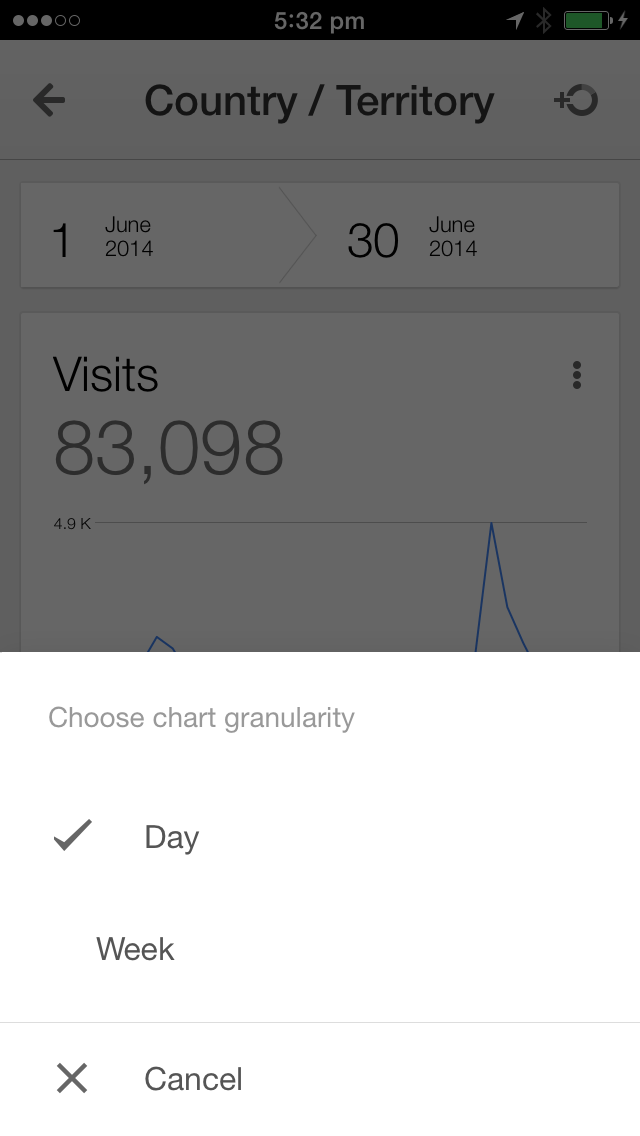
Depending on the date range you can switch from points on the graph to daily, weekly or monthly.
Tip 8: Switch logins
If you have multiple logins that you use for Google Analytics (for example a personal Gmail address and a corporate Google Apps address) then you might need to toggle between your different logins. To toggle between accounts, just click on the menu icon and then click on your profile. This will allow you to switch login accounts (if you are on Android this is on the top right corner).
Tip 9: Identify different goals
Currently the app gives you total goal conversions without the ability to select particular goals for a more granular view. You can work around this by using the ‘Goal URLs’ report within Conversions. The report will show you the number of conversions that occurred based on particular thank you page URLs. As long as you have a different thank you page for each goal action you will be able to see the different conversions that have occurred.
Tip 10: Know the limits
Although there are some great reports available within the Google Analytics app, you need be aware that it won’t give you absolutely everything you need, especially if you want to perform more detailed analysis. Here are some pain-points we have found with the app:
- The app still refers to ‘Visits’ and ‘Unique Visitors’ even though the web interface rolled out new terminology (so ‘Visits’ should be ‘Sessions’ and ‘Unique Visitors’ should be ‘Users’).
- There are only default segments available, so if you have created custom segments within the web interface you will not find them within the app. Plus you can only apply one segment at a time within the app, so to apply multiple segments you will need to head back to the web interface.
- The acquisition channels are missing from the ‘Acquisition’ reports. If you are not familiar with the channels, they provide you with a nice, clean top-level grouping of your marketing channels. It would be nice to see this inside the app.
How are you using the Google Analytics App? Let us know if you have any tips you want to share in the comments!
Comments